两个声学特征区分不同鼾声信号的性能比较*
2013-12-30房玉琢许志勇许辉杰
钱 昆,房玉琢,许志勇*,许辉杰
(1.南京理工大学电子工程与光电技术学院,南京210094;2.北京医院耳鼻喉科,北京100730)
Obstructive Sleep Apnea-Hypopnea Syndrome(OSAHS)is a serious chronic disorder which has a prevalent community[1].It will impair the patient’s interpersonal circles,lead traffic accidents,lower the quality of a patient’s life,and even trigger high blood pressure,coronary heart disease and some other severe diseases if OSAHS is untreated[1-2].Presently,polysomnogram(PSG)is the gold standard for diagnosis of OSAHS in medical practice.However,patients who choose PSG have to be attached by many sensors on body and required to stay at a laboratory in a hospital overnight.This invasive measurement brings a time-consuming and uncomfortable experience for individuals.In addition,the complexity and extravagance ofPSG also limitits possibility of prevalence.Therefore,it is demanding for practitioners to find an alternative method.
One typical symptom of OSAHS patients is their sound snores,which has motivated an increasing number of doctors and signal analysis to study acoustic features of snoresignals(SS).Nevertheless,mostexisting methods based on acoustic analysis focused on diagnosis of OSAHS[3-8].Finding suitable acoustic features to indicate the structure of the upper airway(UA)is more essential for doctors than only diagnosing this disorder,which can be useful to guide an accurate surgery[2].Beeton etal.studied a 2-means clustering method combining the statistical moment coefficients of skewness and kurtosis to discriminate the pure palatal and non-palatal snoring subject groups[9].Hill et al.calculated the acoustic crest factor of snoring signal to distinguish palatal and non-palatal subject groups[10]and Agrawal et al.utilized the peak frequency to find snore site[11].Xu et al.presented the spectral properties of SS generated by different obstruction sites and concluded that high frequency band has more energy proportion for SS generated by the lower level of pharyngeal cavity than the upper level[12].
In this paper,we compare the performances of two frequently-used acoustic features,the crest factor and power ratio 800 on classification of different SS.The results are presented by box plots,a 2-dimensional feature space and average recognition rate calculated by k-Nearest Neighbor method with cross validation.
1 Materials and Methods
1.1 SS Data Acquisition System and Patient Data
The SS data oftwo subjectswere recorded overnight(8 hours)and the most active snore episodes(about 1 hour)were selected for further experiments.Subject 1 is a moderate OSAHS patient who has snores generated both in condition of hypopnea(partly collapse of UA)and normal breath(normal or slight collapse of UA).Subject 2 is a mild OSAHS patient who has snores only originated in normal breath.Data from each subject were divided into frames of 32 ms each by 50%overlap.We selected 220 frames from Subject 1(half of these frames are from hypopnea condition and the rests are from normal breath)and 110 frames from Subject 2 for our experiments.
Fig.1 and Fig.2 illustrate the waveforms and spectrum distribution of two different SS,respectively.The spectrum distribution iscalculated by ShortTime Fourier Transform(STFT)technique.We can discern from Fig.1 that the SS generated in hypopnea condition of the UA has irregular waveforms with more components concentrated in higher frequency bands.Fig.2 shows that SS in normal breath has regular waveforms and more components of its spectrum are in lower frequency bands.
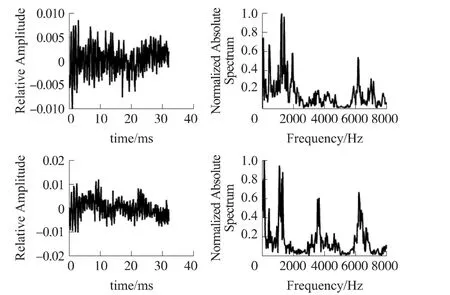
Fig.1 Time and Frequency Domain of Two Samples of SS Data Generated in Condition of Hypopnea
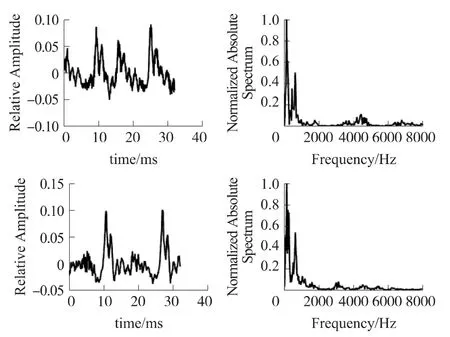
Fig.2 Time and Frequency Domain of Two Samples of SS Data Generated in Normal Breath
Fig.3 gives an expanded part below 2 kHz of SS spectrum generated in two different conditions.We can see from Fig.3 that 800 Hz is a good point of frequency to separate the spectrum powerofdifferentSS.Compared with the normal breath SS,ones generated in hypopnea have more spectrum power percentage beyond 800 Hz.
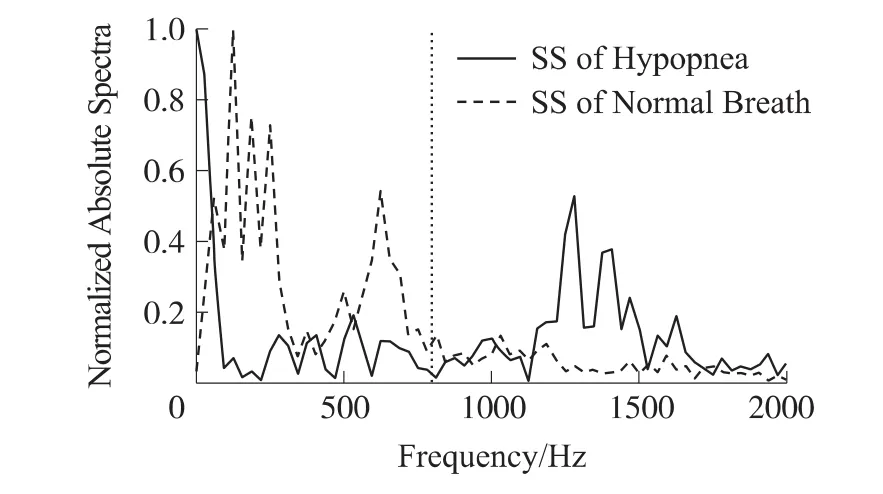
Fig.3 Expanded Part Below 2 kHz of SS Spectrum Generated in Different Conditions
1.2 Calculation of crest factor
crest factor is applied as a measure of the degree of amplitude modulation of the free-field snoring signal[4].Distinguished from traditional definition[4,10]slightly,we modified the crest factor as:
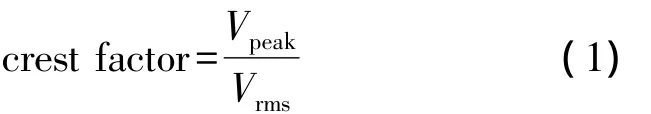
where,Vpeakis the 90th centile maximum absolute value of SS data in one frame,which can exclude the excessive random noise,Vrmsisthe root-mean-square ofall absolute values between the 10th and 90th centile maximum absolute value in one frame to minimize the impacts of both random and quantization noise.
1.3 Calculation of power ratio 800
Xu et al.had found that power ratio 800 has a good performance on discriminating SS generated from different obstruction sites[12].In this paper,power ratio 800 is defined as:
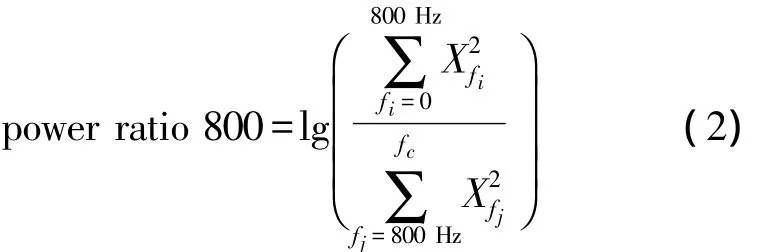
where,XfiandXfjare respectively the amplitude spectra of snoring signals at frequencies offiHz andfjHz calculated by STFT with a Hamming window,fc(=8 kHz)is the cut-off frequency of the SS.
2 Results and Discussions
All the SS data from the two subjects were divided into three groups.Each group has 110 frames and each frame can be regarded as a sample.Data in Group 1 and Group 2 are both generated from Subject 1,which includes the SS in both hypopnea and normal breath,respectively.Group 3 is the family gathering samples from Subject 2,namely SS generated in condition of normal breath.
Fig.4 shows the box plots of crest factor and Fig.5 is its power ratio 800 counterpart for the three groups.We can find that although the three box plots are not the same as each other in Fig.4,it is difficult for us to recognize whether the SS are generated in condition of hypopnea or normal breath.Furthermore,compared with Group 3,Group 1 and Group 2 have more overlaps in their crest factor boxes even though they are in different conditions.

Fig.4 The Box Plots of crest factor for Three Groups(the edges of the box are the 25th and 75th percentiles,the line inside the box is the median,whiskers indicate full range,and outliers are plotted individually)

Fig.5 The Box Plots of power ratio 800 for Three Groups
Fig.5 illustrates the distinctions of two different SS with clear separated intervals(to compare Group 1 with Group 2 and Group 3).We can conclude that SS generated in hypopnea condition has much more percentage of energy in high frequency bands than ones generated in normal breath.And from a statistic point of view,values of power ratio 800 are more concentrated than crest factor.That means power ratio 800 is a better feature to distinguish different SS than crest factor by results of these samples.
Theresults in a 2-dimensionalfeature space consists of values of crest factor and power ratio 800 are shown in Fig.6,where circular,crossed and triangular points correspond to Group 1,Group 2 and Group 3,respectively.We can see from this figure that Group 1 is separated from Group 2 and 3,which indicates that the SS data from hypopnea and normal breath can be distinct from each other.Distribution of crossed and circular points implies that values of crest factor generated in hypopnea are more concentrated than ones in normal breath.Comparing the triangular points with the crossed ones we can find that Group 2 and 3 are separated generally,even though some intersections of points still appear.This result implies that crest factor might be vulnerable to individual characteristics(e.g.,gender,weight,height,age,habits,etc.)in distinguishing different SS.

Fig.6 The 2-Dimmensional Feature Space of Three Groups
Finally,we selected some other samples of SS to take a recognition rate calculation based on k-Nearest Neighbor method with cross validation.We randomly selected half of the samples as training samples and the rest samples were regarded as the testing samples for recognizing the two different SS.In the experiments,we found that 29 is an appropriate value fork.The experiment was repeated for 50 times,we can see from Table 1 and Table 2 that power ratio 800 achieved an average correct recognition rate with 90.43%,whereas crest factor only had a recognition rate with 69.65%.
It is known that crest factor is a form factor[9],which will be determined mostly by structure of the organ and some physiological conditions.Therefore,it is a good feature to distinguish palatal from non-palatal snoring[4,10].However,when it is applied into classify differentSS itwould notbe a good indicator.Fortunately,power ratio 800 can reflect more information about the spectrum of SS,which are determined mostly by the movement characteristic of the UA[12].As a result,it should have a significant effect to classify SS generated in different conditions.When the UA has a normal or slight condition,SS generated by it passes a relatively bigger resonance cavity,which can be regarded as a low-pass filter.By contrast,SS generated in a condition of partly collapse in the UA confronts an opposite situation,which leads it have more high frequency components.

Table 1 The average recognition rate by utilizing the feature of crest factor
3 Conclusions
This paper compared two typical acoustic features for different SS classification.We found that power ratio 800 has a better performance on distinguishing SS generated in different conditions of the UA than crest factor.The box plots,a 2-dimensional feature space,and average recognition rate had verified that crest factor is vulnerable to individual characteristics in the experiments.For classifying different SS better,much more data need to be acquired from large scales of subjects who suffer from OSAHS.
Acknowledgement
This study is supported by the National Natural Science Foundation of China under grant No.61271410 and 61171167.We wish to record appreciation to all the doctors of Otolaryngology Department,Beijing Hospital,China for their assistance and organization of this research.
[1]Otero A,Fe'lix P,Presedo J,et al.Evaluation of an Alternative Denition for the Apnea-Hypopnea Index[C]//Proceedings of 2010 EMBC.Buenos Aires,Argentina:IEEE Press,2010.4654-4657.
[2]He Quanying,Chen Baoyuan.Sleep Disordered Breathing[M].Beijing:Pepole’s Medical Publishing House,2009:13-378.
[3]Hou Limin,Xie Su,Kai Shankai,et al.Detection of OSAHS Using Only Time-Domain Property of Snoring Signal[C]//Proceedings of 2011 ICMT.Hangzhou,China:IEEE Press,2011.519-522.
[4]Hill D P,Osman Z E,Osborne E J,et al.Changes in Snoring during Natural Sleep Identified by Acoustic Crest Factor Analysis at Different Times of Night[J].Clinical Otolaryngology,2000,25:507-510.
[5]Cavusoglu M,Ciloglu T,Serinagaoglu Y,et al.Investigation of Sequential Properties of Snoring Episodes for Obstructive Sleep Apnoea Identification[J].Journal of Physiological Measurement,2008,29:879-898.
[6]Ng K A,Koh S T.Using Psychoacoustics of Snoring Sounds to Screen for Obstructive Sleep Apnea[C]//Proceedings of 30th IEEE EMBS Conference.Vancouver,Canada:IEEE Press,2008.1647-1650.
[7]Xu Huijie,Yu Lisheng,Huang Weining,et al.A Preliminary Study of SnoringSound in Patientswith ObstructiveSleep Apnea Hypopnea Syndrome(OSAHS)and with Simple Snoring[J].Journal of Audiology and Speech Pathology,2009,17(3):235-238.
[8]Abeyratne R U,Wakwella S A,Hukins Craig.Pitch Jump Probability Measures for the Snoring Sounds in Apnea[J].Journal of Physiological Measurement,2005,26:779-798.
[9]Beeton J R,Wells I,Ebden P,et al.Snore Site Discrimination Using Statistical Moments of Free Field Snoring Sounds Recorded during Sleep Nasendoscopy[J].Journal of Physiological Measurement,2007,28:1225-1236.
[10]Hill D P,Lee V W B,Osborne E J,et al.Palatal Snoring Identified by Acoustic Crest Factor Analysis[J].Journal of Physiological Measurement,1999,20:167-174.
[11]Agrawal S,Stone P,Mcguinness K,et al.Sound Frequency Analysis and the Site of Snoring in Natural and Induced Sleep[J].Clinical Otolaryngology,2002,27:162-166.
[12]Xu Huijie,Huang Weining,Yu Lisheng,et al.Spectral Analysis of Snoring Sound and Site of Obstruction in Obstructive Sleep Apnea-Hypopnea Syndrome[J].JournalofAudiology and Speech Pathology,2011,19(1):28-32.