Synthesis and cost estimation of ethylene oxide process using PRO/II
2013-12-20SuriParkSangwookHanYonghoHongByungjickKim
Suri Park, Sangwook Han, Yongho Hong, Byungjick Kim
(Department of Chemical Engineering, Soongsil University, Seoul 156-743, Korea)
Synthesis and cost estimation of ethylene oxide process using PRO/II
Suri Park, Sangwook Han, Yongho Hong, Byungjick Kim
(Department of Chemical Engineering, Soongsil University, Seoul 156-743, Korea)
Ethylene oxide (EO) is a sold-out intermediate material for producing various chemicals. Major chemical companies are interested in whether new EO plant can create profit. This research is undertaken to investigate the economic feasibility of EO production. Direct oxidation of ethylene using silver on alpha-Al2O3catalyst type is adapted to produce EO of 60 000 t/year. We conduct the conceptual design. Firstly, we synthesize the optimal structure and then determine optimal conditions and the size of the equipments. Feasibility study shows that profit and loss turning point turns out to be 3.2 years based on the present market price. In addition, we conducts the economic analysis to prepare the risk of raw material market price variation ranging from 70% to 130%.
ethylene oxide (EO); PRO/II simulation; optimal structure; feasibility study
CLD number: TQ314 Document code: A
Ethylene oxide (EO) is an important material for producing detergents, thickeners, solvents, and various organic chemicals such as ethylene glycol, ethanol amines, simple and complex glycols, polyglycol ethers and other compounds. EO is industrially produced by direct oxidation of ethylene in the presence of silver catalyst[1].
Commercial production of EO can date back to 1914 when Badische Anilin Und Soda Fabrik (BASF) (German chemical products company) built the first factory which used the chlorohydrin process (reaction of ethylene chlorohydrin with calcium hydroxide). The chlorohydrin process was unattractive for several reasons, i.e. low efficiency and loss of valuable chlorine into calcium chloride[2]. More efficient direct oxidation of ethylene by air was invented by Lefort in 1931 and in 1937, and Union Carbide Co. opened the first plant using this process. It was further improved in 1958 by Shell Oil Co. by replacing air with oxygen and using elevated temperature of 200-300 ℃ and pressure of 1-3 MPa[3]. This more efficient routine accounted for about half of EO production in the 1950s in the U.S., and after 1975, it completely replaced the previous methods[3].
EO, also called oxirane, is the organic compound with the formula C2H4O. It is a cyclic ether, which consists of an alkane with an oxygen atom bonded to two carbon atoms of the alkane, forming a ring. EO is a colorless flammable gas at room temperature, with a faintly sweet odor; it is the simplest epoxide: a three-membered ring consisting of one oxygen atom and two carbon atoms. Because of its special molecular structure, EO easily participates in addition reactions, e.g. opening its ring and thus easily polymerizing. EO is isomeric with acetaldehyde[4,5].
Although EO is a vital raw material with diverse applications, including the manufacture of products like polysorbate 20 and polyethylene glycol that are often more effective and less toxic than alternative materials, EO itself is a very hazardous substance: at room temperature it is a flammable, carcinogenic, mutagenic, irritating and an aesthetic gas with a misleadingly pleasant aroma.
The chemical reactivity that is responsible for many EO's hazards has also made it a key industrial chemical. Although too dangerous for direct household use and generally unfamiliar to consumers, EO is used industrially for making many consumer products as well as non-consumer chemicals and intermediates. EO is important or critical to the production of detergents, thickeners, solvents, plastics and various organic chemicals such as ethylene glycol, ethanol amines, simple and complex glycols, poly-glycol ethers and other compounds. As a poison gas that leaves no residue on items it contacts, pure EO is a disinfectant that is widely used in hospitals and medical equipment industry to replace steam in the sterilization of heat-sensitive tools and equipment, such as disposable plastic syringes[1].
EO is industrially produced by direct oxidation of ethylene in the presence of silver catalyst. It is extremely flammable and explosive and is used as a main component of thermobaric weapons[6,7]. Therefore, it is commonly handled and shipped as a refrigerated liquid[4].
Table 1 shows four chemical companies in Republic of Korea that produce EO and the sum of production capacity of four companies, which is equal to about 860 kt/year.

Table 1 ROK chemical companies and its EO production
1 Theoretical study
1.1 Reaction kinetics
EO is industrially produced by direct oxidation of ethylene in the presence of silver on alpha-Al2O3. Ethylene and enough amount of air are fed into the Plug Flow reactor for direct oxidation of ethylene. Reaction kinetics on the catalyst is expressed as[8,9]:

C2H4+3O2→2CO2+2H2O

where C1, C2and C3are concentrations of ethylene, oxygen and EO, respectively.
Unit of measurement in each variable is
1.2 Physical property method
The selection of proper physical property method is most critical in process simulation to get the right results. Fig.1 shows the pure component data to produce EO by direct oxidation of ethylene in the presence of silver on alpha-Al2O3.

Fig.1 Component selection of EO process
SRK modified panagiotopoulos-reid(SRKM) is selected as physical property method. Fig.2 shows the selection of physical property in PRO/II simulation.
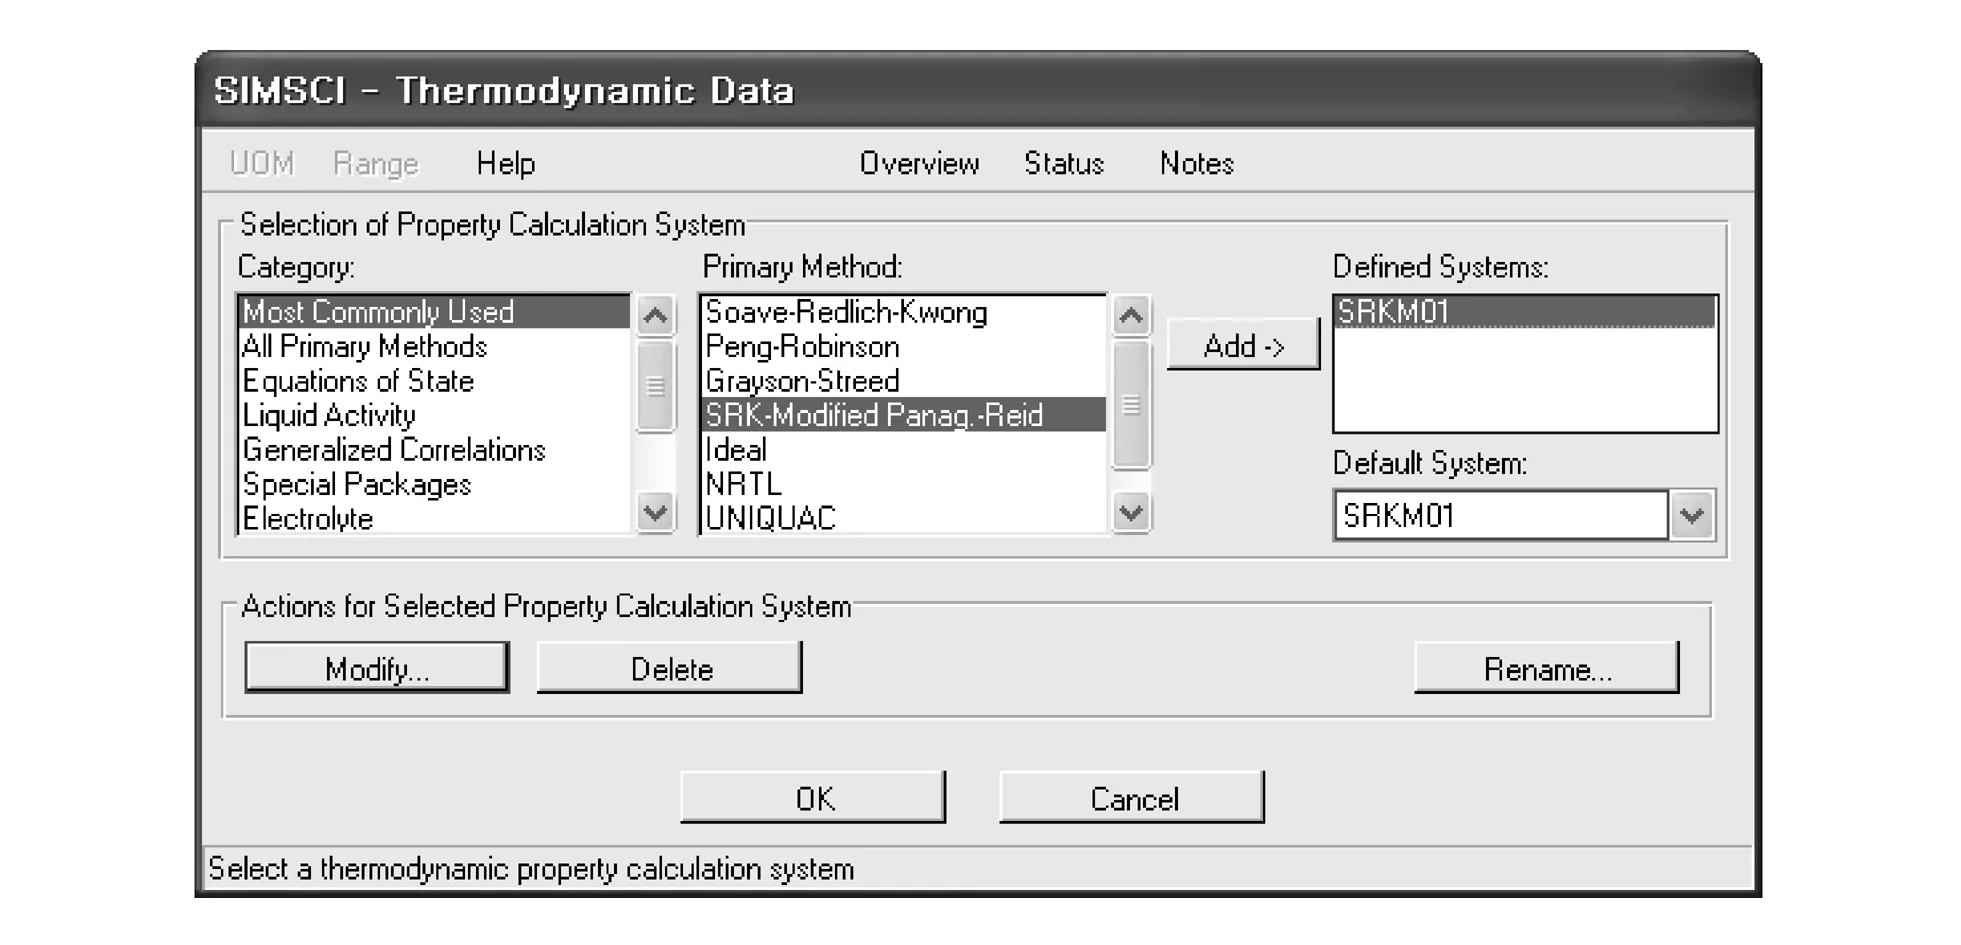
Fig.2 Thermodynamics data of EO process
The equation of SRKM is
where
ai=ajac,

Ωa=0.427 480 23, Ωb=0.086 640 35.
The meanings and units of measurement of the above parameters in Eq.(10) are as follows: Tcis critical temperature [K]; PCis critical pressure [Pa]; R is gas constant [J/(mol·K)]; v is molar volume [m3/mol]; V is volume [m3]; X is mole fraction; i and j are component identification numbers; C,C2and C3are parameters.
Comparison of the simulation data with the experimental data is conducted to see the validity of the selected physical property.
Fig.3 shows the vapor-liquid equilibrium (VLE) experimental data in T-x,y diagram obtained from EO-water mixture. Fig.4 shows the VLE data in T-x,y diagram obtained by Pro/II simulation using SRKM property method.
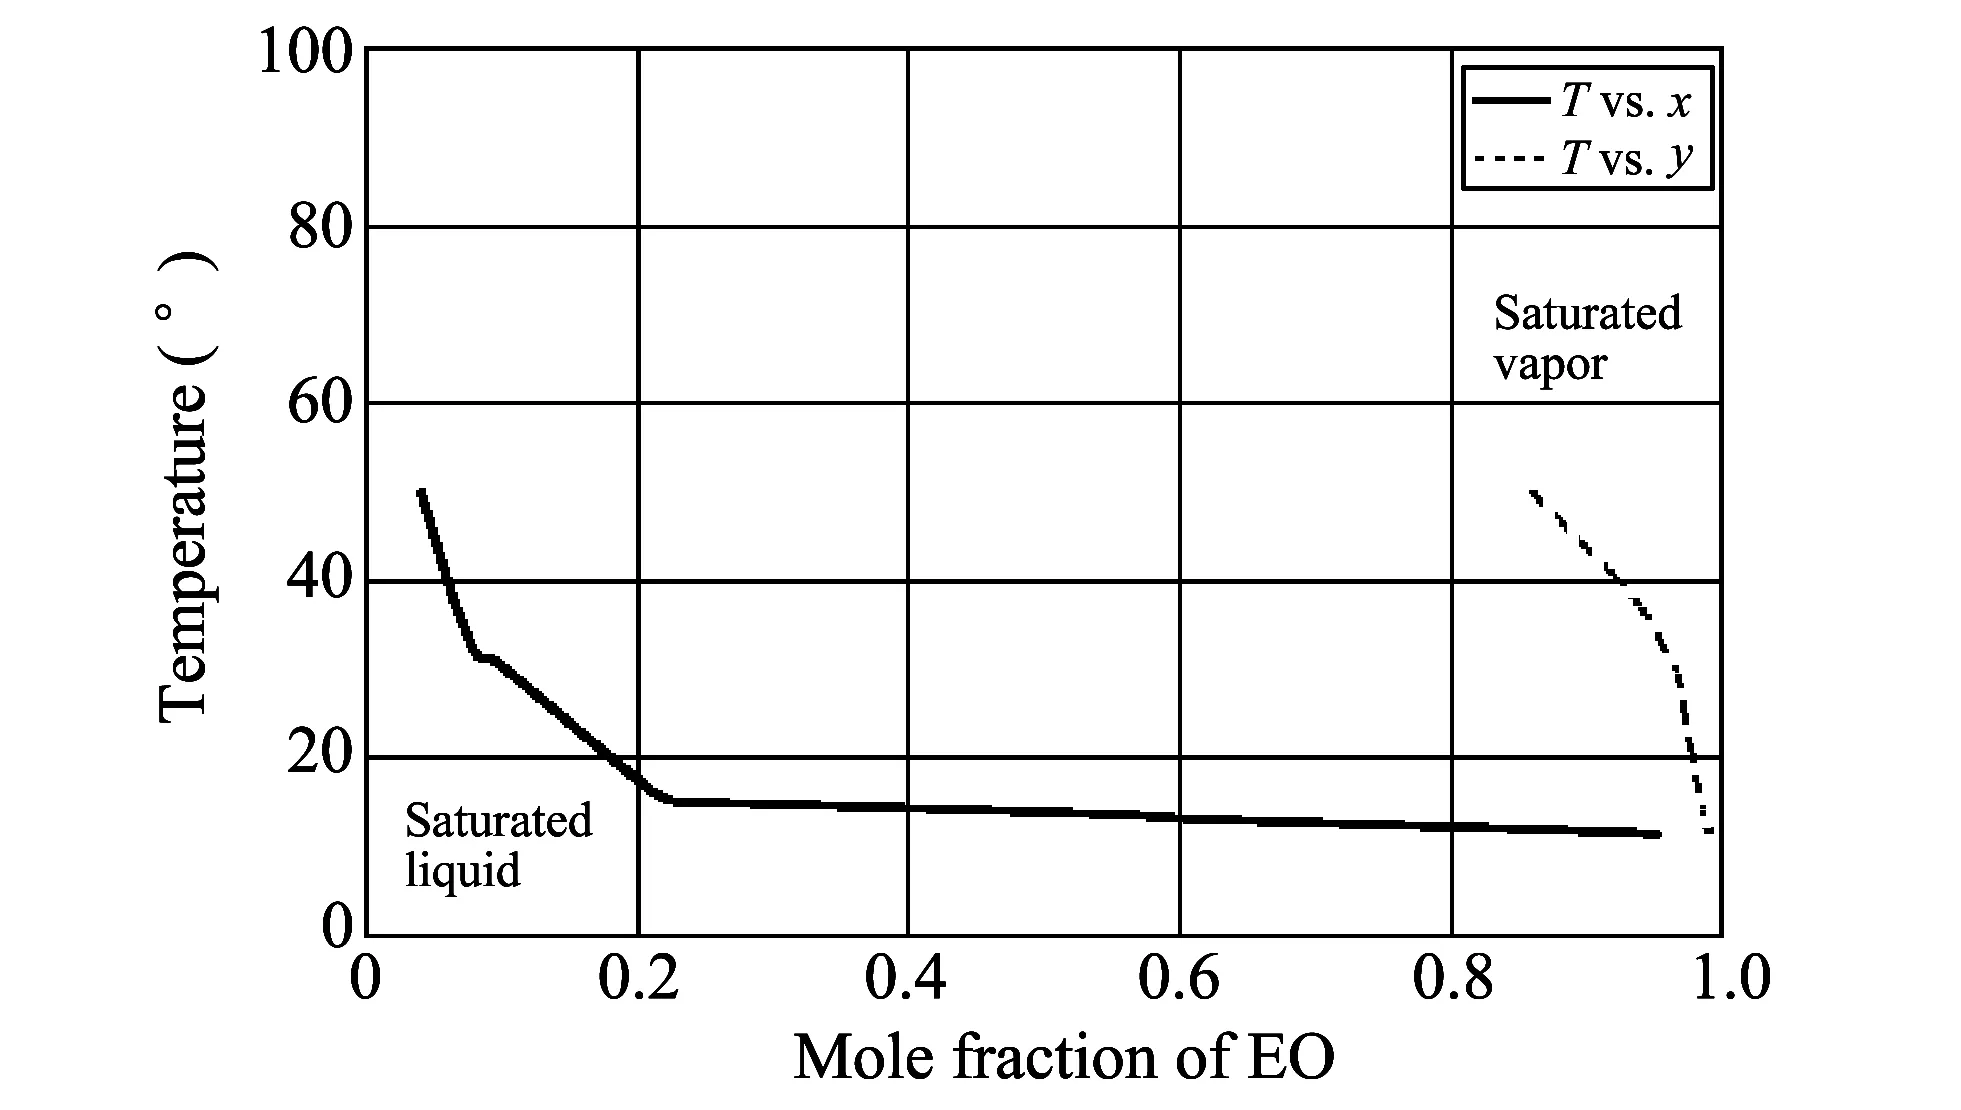
Fig.3 T-x,y chart for EO-water of real VLE data

Fig.4 T-x,y plot for EO-water of VLE Pro/II program data
Fig.3 and Fig.4 are merged into one diagram as shown in Fig.5. It can be seen that the simulation data is in good agreement with the real data.

Fig.5 Comparison of VLE data in real and Pro/II program
1.3 EO production methods
Oxidation method can produce EO compound by contact with oxygen or air. Japanese companies like Misbishi Chemical Co. and Mitsui Chemical Co. use this method. Hydrolysis method can hydrolyse and neutralize the ethylene chlorohydrine, and production cost is low and product purity is also low[10-12], therefore, this method has been seldom used. Recently, EO method is industrially produced by direct oxidation of ethylene in the presence of silver on alpha-Al2O3. Most of new EO plants adopt the direct oxidation method[13,14].
2 Process simulation
2.1 Product specification and input feedstock
Table 2 lists the EO product specification. Purity of EO in product stream is more than 99.9 wt %.

Table 2 Product specification
As input feedstock, ethylene, air and oxygen are used. Table 3 lists the composition of three input components.

Table 3 Feedstock
2.2 PFD and the size of equipments used
Process flow diagram (PFD) is shown in Fig.6.

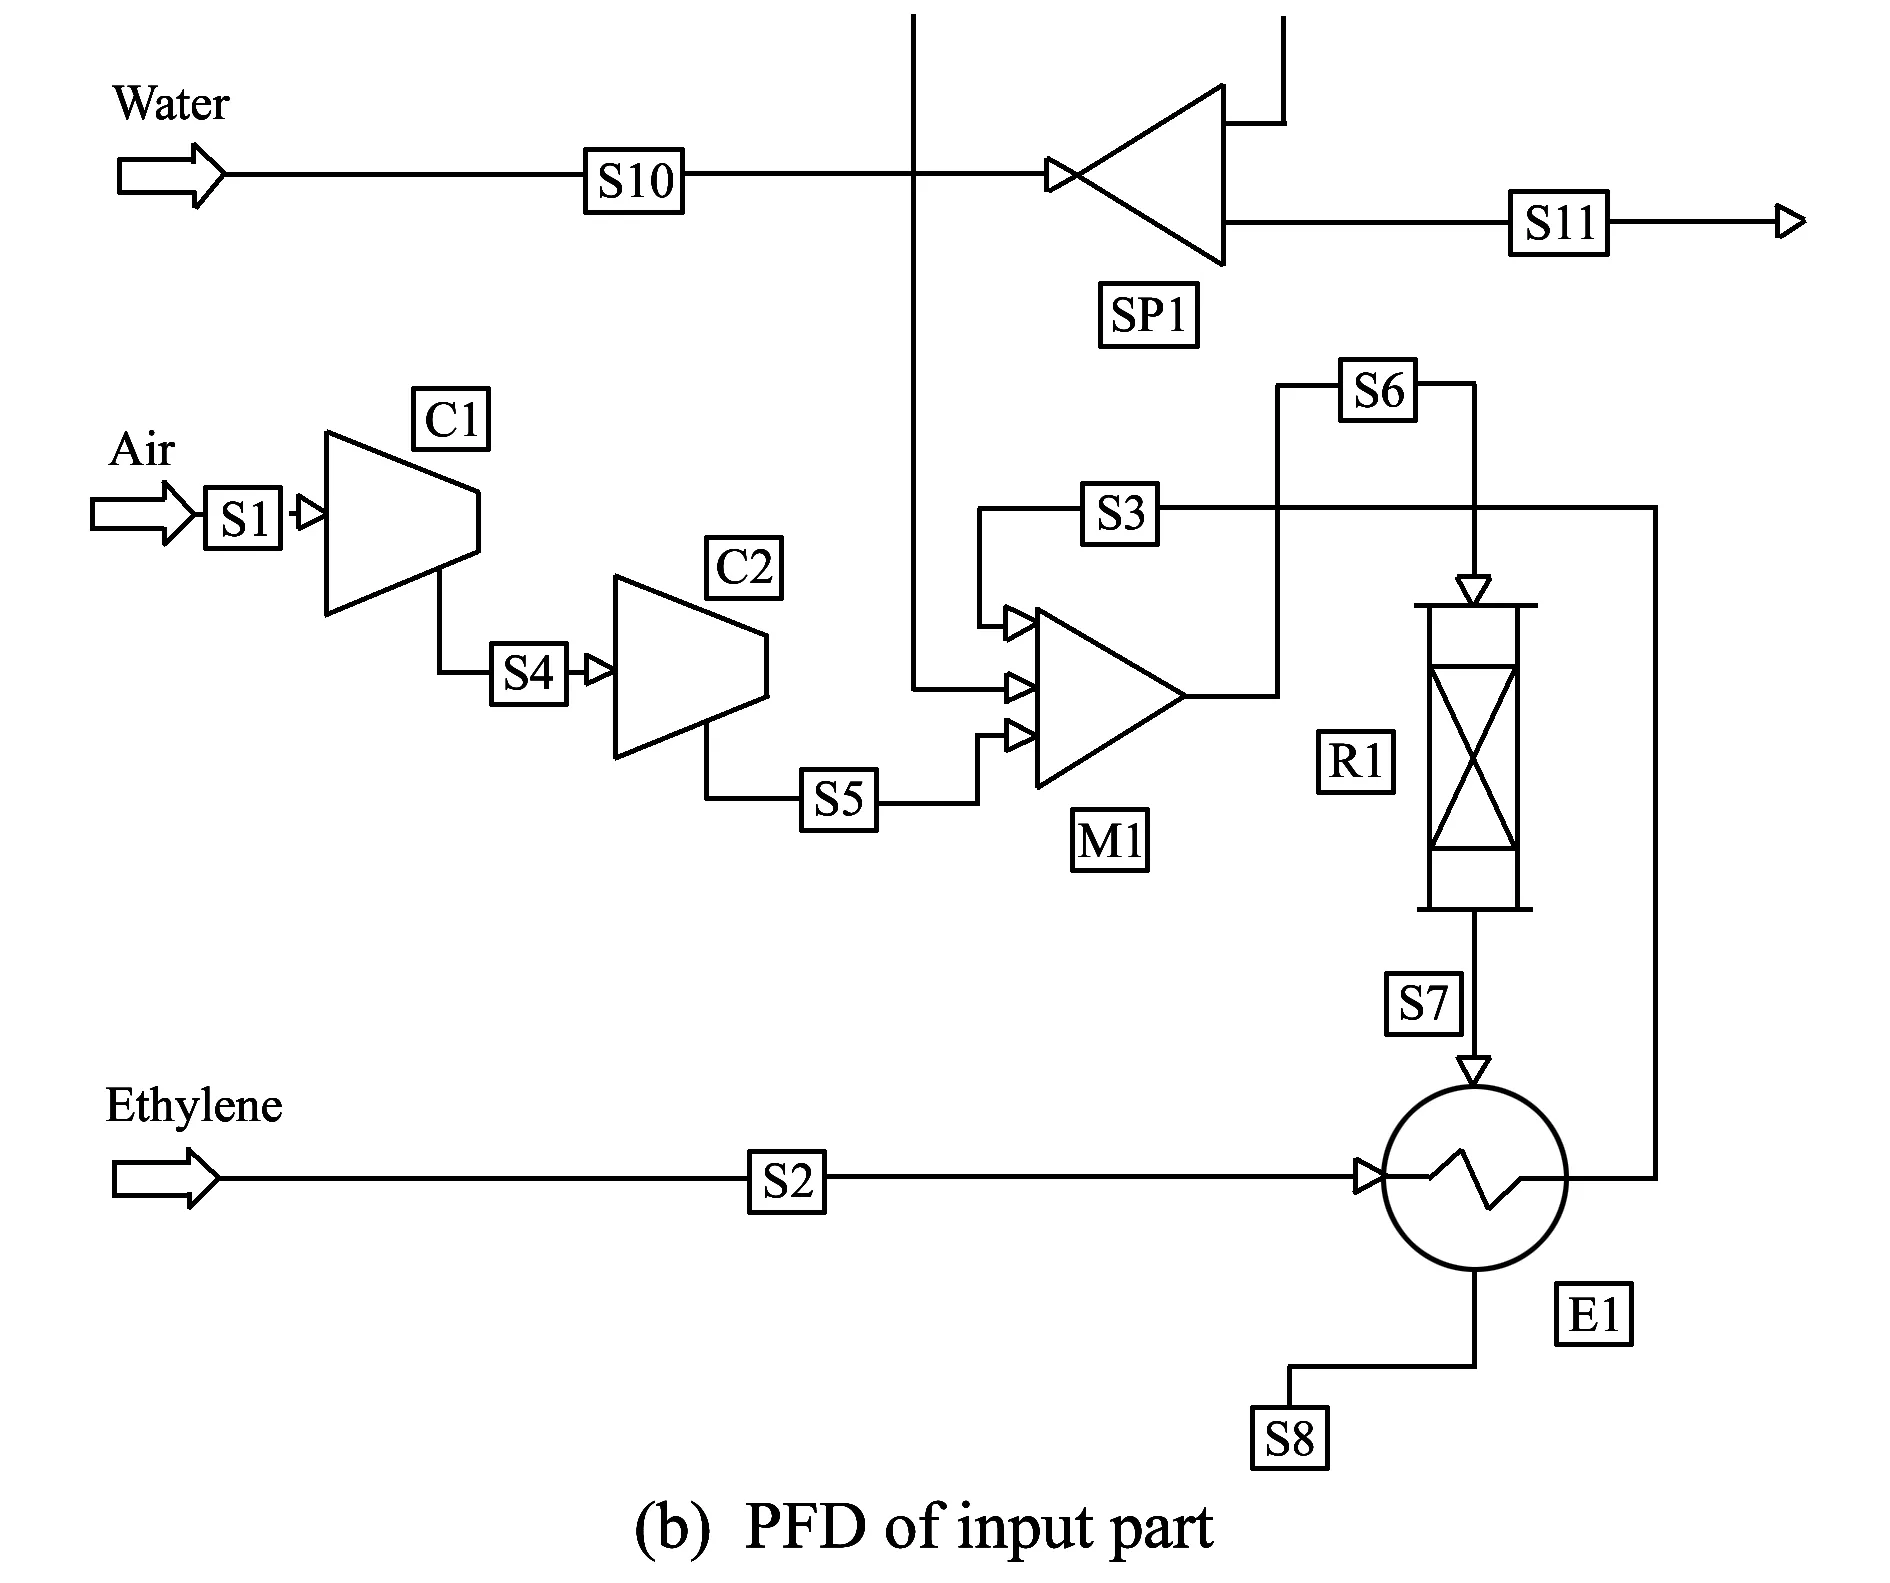
Fig.6 PFD of EO
Fig.6(a) shows the PFD of the whole EO process and Fig.6(b) is the magnification of Fig.6(a) input part. It can be seen that air is supplied via S1 and compressed through compressor (C1, C2) and ethylene is supplied via S2and heated through heat exchanger (E1). After that, both air stream (S5) and ethylene stream (S3) are mixed in mixer (M1), and then the mixture stream (S6) is fed to plug flow reactor (PFR; R1), thus EO is produced in R1[15-17]. Finally, purity 99.9 wt% EO is produced through two absorbers and two distillation towers which separate the impurities.
Table 4 lists the optimal size of main equipments (reactor, absorber and distillation tower). Two reactors with the same size (R1, R2) are used, and the volume is 32 m3and the length is 3.5 m. Also two absorb adsorption towers with the same size (T1,T2) are used, and the number of trays is six, the height and the diameter of the tower is 3.6 m and 1.4 m, respectively. And two distillation towers with different sizes are used. T3has 25 trays and T4has 15 trays.

Table 4 Size of main equipments
3 Results and cost estimation
3.1 Simulation results
We conduct the simulation of direct oxidation EO process via Pro/II. The stream output is shown in Fig.7. Purity of EO product can be identified 99.9% in this chart.

Fig.7 Input and output stream information via Pro/Ⅱ
3.2 Cost estimation
Fig.8 indicates the cash flow chart of a chemical production company.

Fig.8 A corporate funds flow
The meanings of abbreviations in Fig.8 are as follows:
V: Manufacturing fixed capital investment;
Ax: Nonmanufacturing fixed capital investment;
W: Working capital investment;
T : Total capital investment, T=V+Ax+W;
Sj : Total income;
Coj : Cost for operations;
Dj : Depreciation;
Npj : Net profit;
Aj : Annual net profit.
Total cash flow of the firm (TCFF) is the movement of money into or out of a business, project or financial product. It is usually measured during a specified, finite period of time.
Cash flow can be obtained from total after-tax income, total cost and each-year-depreciation. Feedstock material, catalyst and utility costs are needed to estimate the total cost. Table 5 lists the economic conditions of EO production[18-21].

Table 5 Economic conditions of EO process
Table 6 lists EO production and total income for initial 6 years. We assume the product targets of the 1st year, and the 2nd year are 75% and 85% of normal product rate of 60 000 t/year, respectively. After initial two years, we assume that the product rate will be the normal value. Since EO market price is $0.98 per kg, total income of the first year will be $4.1 million. In the same way, total income of the 2nd year will be $49.98 million. After two years, total income will be $58.8 million consistently.
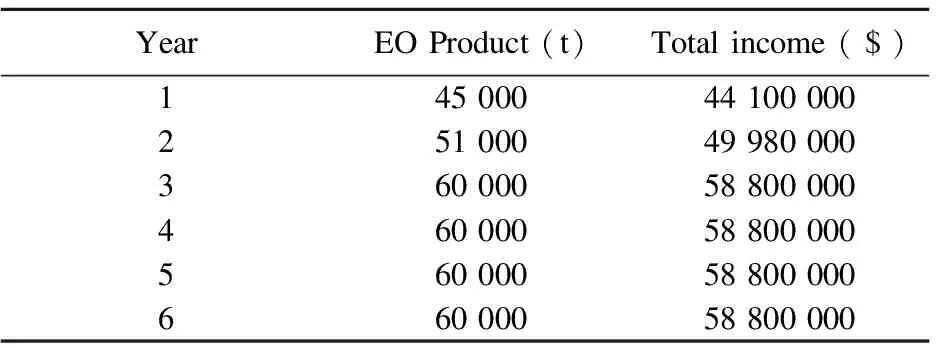
Table 6 EO production and total income for initial 6 years
EO process consists of mixer, splitter, reactor, absorber, distillation, compressor, heat exchanger and pressure vessel. The cost is estimated based on present international price and method. Table 7 lists the costs of main equipments of EO process.
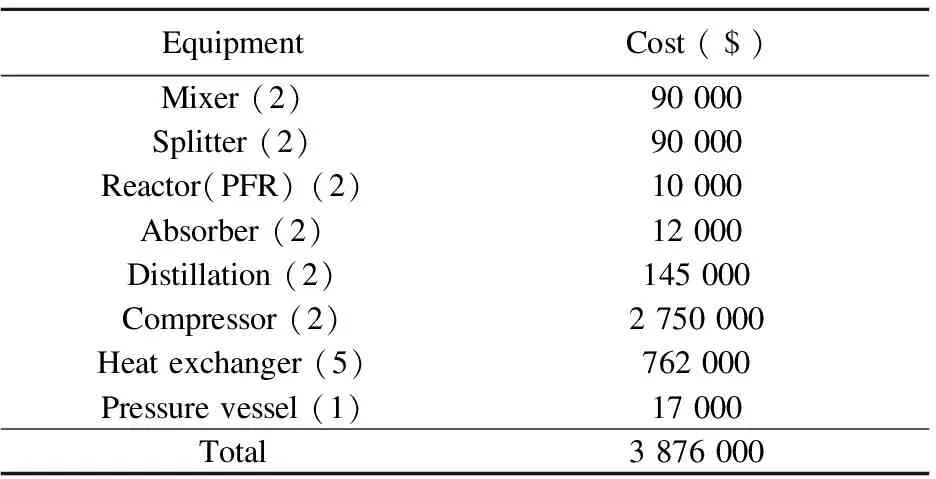
Table 7 Costs of main equipments of EO process
With time passing, value of assets of EO plant will decrease. Therefore, the cost of assets needs to be allocated to periods in which EO plant is used. Table 8 lists the depreciation of EO plant facility with time passing. The depreciation of fixed capital investment(FCI) is assumed to be 33.3% of the 1st year, 44.5% of 2nd year, 14.8% of the 3rd year, and 7.4% of the 4th year, respectively.

Table 8 Depreciation of FCI
Income and cost of EO production are presented in Table 9.

Table 9 Depreciation of FCI
Total cost of the 1st year includes initial capital investment, raw materials cost, and production cost. After the 1st year, total cost excludes initial capital cost and includes others. Including all depreciation, the income and cost are 329.28 million dollars and 283.947 million dollars, respectively.
Fig.9 shows the profit and loss turning point of EO plant. From the feasibility study, profit and loss turning point turns out to be 2.35 years, which means that the EO plant will get the net profit after 2.35 years of operation.

Fig.9 Profit and loss turning point of EO plant
It can be expected that ethylene and EO market price can vary. Additional economic analysis is conducted to prepare for price variation risk. Fig.10 shows income vs. the difference of product cost and feedstock cost ranging from $0.69 per kg to $1.28 per kg with the time of year.

Fig.10 Total income according to EO price ranging from $0.69 per kg to $1.12 per kg
Fig.11 shows the profit and loss turning point according to the cost difference of product and feedstock. In case of $0.1 increase of 1 kg of EO, the profit and loss turning point can be shortened by about 1 year. On the contrary of $ 0.1 decrease 1 kg of EO, the profit and loss turning point will be prolonged by about one and half year. It can be found that the profit and loss turning point is very sensitive to the market price variation.

Fig.11 Profit and loss turning point according to product and feedstock price difference
4 Conclusion
1) We conduct the conceptual design of EO process, obtain the optimal structure, and determine the optimal conditions and size of each equipment.
2) Feasibility study shows that profit and loss turning point turns out to be 2.35 years based on the present market price.
3) We also conduct the economic analysis to prepare the risk of raw material market price variation ranging from 70% to 130%.
[1] Kim J S, Lee S E Chung H W. Chromosome aberration and glutathione s-transferase activity in peripheral lymphocytes of workers exposed to ethylene oxide. Korea Journal of Epidemiology, 1993, 15(2): 1-5.
[2] Norris J F. The manufacture of war gases in Germany. Journal of Industrial and Engineering Chemistry, 1919, 11: 817-829.
[3] Weissemel K, Arpe H J. Industrial organic chemistry. 4th ed. Wiley-VCH, Weinheim, 2003: 145-148.
[4] Liteplo R G, Meek M E. Ethylene oxide. World Health Organization, 2003.
[5] Peters M S, Timmerhaus K D. Plant design and economics for chemical engineers. 5th ed. McGraw-Hill, USA, 2003.
[6] McCabe W L, Smith J C, Harriot P. Unit operations of chemical engineering. 7th ed. McGraw-Hill, USA, 2003.
[7] Douglas J M. Conceptual design of chemical processes. McGraw-Hill, USA, 1988.
[8] Thuesen H G, Fabrycky W J, Thuesen G J. Engineering economy. 8th ed. Prentice-Hall, USA, 1993.
[9] Lou H H, Chandrasekaran J, Smith R A. Large-scale dynamic simulation for security assessment of an ethylene oxide manufacturing process. Journal of Computers & Chemical Engineering, 2006, 30(6/7): 1102-1118.
[10] Zahedi G, Lohi A, Mahdi K A. Hybrid modelling of ethylene to ethylene oxide heterogeneous reactor. Journal of Fuel Processing Technology, 2011, 92: 1725-1732.
[11] Moudgalya K M, Goyal R. Modelling an industrial ethylene oxide reactor. In: Proceedings of the 5th International Federation of Automatic Control Conference on Dynamics and Control of Process Systems, Korfu, USA, 1998.
[12] Bingchen Z, Yuanshun W, Hongshi W. Modelling catalytic reaction-absorption coupling process of ethylene oxide, synthesis in slurry reactor. Journal of Chemical Engineering Science, 1998, 54: 1531-1534.
[13] Zahedi R, Lohi A. Heterogeneous dynamic modeling and simulation of an industrial ethylene oxide reactor experiencing catalyst deactivation. Journal of Chemical Engineering Science, 2009, 3: 18-26.
[14] Aryana S H, Ahmadi M, Gomes V G, et al. Modeling and optimisation of an industrial ethylene oxide reactor. Journal of Chemical Product and Process Modeling, 2009, 4(1): 1231. [doi: 10.2202/1934-2659.1231]
[15] Kenson R E, Lapkin M. Kinetics and mechanism of ethylene oxidation—reactions of ethylene oxide on a silver catalyst. Journal of Physics and Chemistry, 1970, 74: 1493-1502.
[16] GU Yan-li, GAO Zheng, JIN Ji-quan. Kinetic models for ethylene oxidation to ethylene oxide. Petrochemical Technology, 2003, 32: 838-840.
[17] Enviromental tips. Ethylene oxide environmental technology center. 1998.
[18] Research and Markets. China ethylene oxide (EO) industry chain report. AMID Co.Ltd, USA, 2013.
[19] Bernardo R P, Clarizia G. Integrated membrane operations in the ethylene oxide production. Journal of Clean Technologies and Environmental Policy, 2012, 14: 475-485.
[20] Betancourt-Torcat A R, Ricardez-Sandoval L A, Elkamel A. Engineering economics for chemical processes∥Holloway M D, Nwaoha C, Onyewuenyi O A. Process plant equipment operation, control and reliability. John Wiley & Sons, Inc., Hoboken, USA, 2012: 331. [doi:10.1002/978/1118/62569.ch14]
[21] Sommerfeld J T. Petrochemical plant costs for the new millennium. Hydrocarbon Processing, 2001, 80: 103-108.
date: 2013-10-09
The MSIP (Ministry of Science, ICT & Future Planning), Korea, under the Convergence-ITRC (Convergence Information Technology Research Center) support program (NIPA-2013-H0401-13-1004) supervised by the NIPA (National IT Industry Promotion Agency)
Byungjick Kim (bjkim@ssu.ac.kr)
1674-8042(2013)04-0385-07
10.3969/j.issn.1674-8042.2013.04.018
杂志排行

Journal of Measurement Science and Instrumentation的其它文章
- A 4-layer method of developing integrated sensor systems with LabVIEW
- Calibration and compensation methods of installation error of electronic compass
- Design of shared bus DSP board in vector network analyzer
- Error modeling and analysis of inclinometer based on digital accelerometer
- Analysis of condition monitoring methods for electromotor on oil platform
- U disk recorder based on CH376 and ATmega 128