A high-speed index for the multi-scale overlay landscape map on ubiquitous WebGIS
2013-11-26LyuZhihanZhongChenFengLiangbingChenQianandFengShengzhong
Lyu Zhihan,Zhong Chen,Feng Liangbing,Chen Qian,and Feng Shengzhong†
1)Shenzhen Institutes of Advanced Technology,Chinese Academy of Science,Shenzhen 518055,P.R.China
2)Department of Applied Physics and Electronics,Umea University,Umea 90187,Sweden
3)Future Cities Laboratory Singapore,ETH Zürich 117566,Singapore
1 Introduction
Ubiquitous web-based geographic information system(Web-GIS)has been developing rapidly in this Internet of Things era.It is the integrated production of cartography and computer networks,and built on the web technology under a ubiquitous environment.It can store,process and analyze spatial information,and also display and apply it via internet and mobile phone networks[1].
Google Earth and the other web-based 3D digital earth software broke hrough the traditional WebGIS interactive method and promoted the 3D representation,which had increasingly become the main format for geo-spatial information services[2].The accuracy for expressing 3D GIS data,speed and scope of modeling expands increasingly,the finesse and complexity improves continuously,resulting in the rapid expansion of the amount of data,and showing a large-scale feature,which brings out the prominent contradiction between limited processing capability and network bandwidth[3-5].The performance increase brought on by hardware such as mobile phone acceleration is always limited,or the cycle is long and costly even through we could improve computing processing capability and network transmission capacity to a certain extent by enhancing server performance and increasing bandwidth.For example,the terrain and image database of Google Earth containing 70 Tbit in 2007 as supported with a huge“cloud storage”server cluster in Google Inc.GIS data is large scale,diverse,predictable and real time,which falls in the range of definition of Big Data defined by Intel fellow Faye Briggs[6].In 2008,Nature published a special issue concerning with the subject of Big Data[7],which makes people focus on the use of extant massive data such as analysis and visualization.Since then some new concepts and theories have been advanced such as‘Internet of Things'and‘Cloud Computing'and new things such as the multi-touch mobile have emerged.On the 28th March 2012,the Obama administration announced“data is new oil”and invested$200 million to Big Data research especially in“Gamefication”and“Data Mining”.The idea not only includes interpreting big data by visualization techniques,but also broadens the channels for data acquisition with sensor technology and computing anywhere through mobile.This requirement conforms to the development of the Internet of Things.
3D landscape map is one solution of this requirement,it presents large-scale urban landscape in 3D style by cheap devices such as mobile phones,tablet PCs,reflecting the characteristics of ubiquitous computing.In fact,on the three elements of the map,mathematical laws,map symbols and cartographic generalization,there are significant differences between the 3D landscape maps and traditional maps[8].
A 3D landscape map is actually a kind of observation of surface-rich 2.5-D.It is static raster data generated from 3D model rendered on a fixed perspective.We determine the camera angle according to the orientation of the house in the region,3D modeling software,set the camera and lighting effects,and produces base maps,and then styles the standard scenario[9-10].
The concept of landscape maps shows that this technology is not a 3D real-time rendering.It reduces the dependency on hardware,and is easier to integrate onto the traditional WebGIS and also the ubiquitous WebGIS.
To meet the diversity of different application and analysis requirements of geographic data,landscape map data processing and multi-scale expressed online have now become a urgent and practical problem of web geographic information science[11].The 3D landscape map of Fengxian district,Shanghai,PRC is as in figure 1.
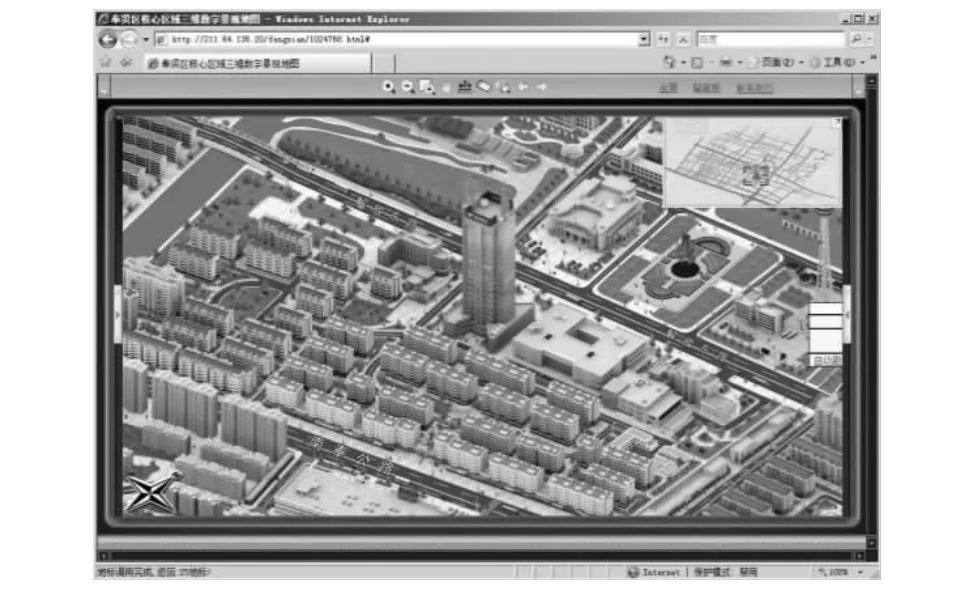
Fig.1 3D landscape map图1 三维景观地图
There are many issues involved in the landscape map data processing and multi-scale representation,but they can be summed up in four aspects:①How to present landscape map data in a one-dimensional model,now after having more mature technical means in the industrial sector;②How to split the division of geographical space,that is,to distinguish between multiscale sequence of sub-space[12],which is more representative in the research from the perspective of spatial cognition[13-14];③How to generate the sub-space sequences while dynamically creating and maintaining spatial relationships between them;a great deal of research has been made to explore it from the perspective of this cartographic generalization,and have had some initial results,such as the model processing based on Delaunay graph[15]etc.④ How to manage the generated sequence of sub-space and establish the index structure of landscape map data.It exerts great influence on not only the rendering speed of multi-scale representation of spatial data,but also the efficiency of the query and analysis.The basic idea to solve this problem is to improve the existing spatial data indexing method to fit the landscape map representation of spatial data in network environment.In the traditional single-dimensional spatial index,more representation index is based on quadtree multi-scale representation of spatial data[16].
To solve these problems,a new index structure of landscape map data representation for the adaptability of network environment should be created.
2 Multi-scale representation in WebGIS
To establish a spatial index,we can divide the spatial objects by their relationships and generate an object map,which describes the data location information stored in media,and can be used to access spatial object based on partition block.A spatial index can improve the efficiency on data acquisition,specifically in displaying speed and searching time-consuming.
WebGIS spatial index is proposed by two issues.Firstly,because the data is stored on the server disk,it will be traversed every time if it cannot be well organized.Thus,the efficiency goes down because of the multiple access to the server disk.Therefore,the designer must record and organize the location of the data on disk,using a number of calculations in memory to replace disk aimlessly for visits.Specifically,GIS involves all kinds of mass of complex data,the index is crucial for the efficiency of data processing.Secondly,in ubiquitous WebGIS,landscape map data makes R-tree index inadequately explained.For the traditional stand-alone index,R-tree makes excellent performance,and it has been widely used in the prototype research and commercial space database system such as ORACLE,which is one of the most popular index in stand-alone platforms at present.However,due to the massive distribution of spatial data in WebGIS,building R-tree[17]is time-consuming,and inefficient in real time data update.Therefore,it is desirable to propose a special space index to adapt to the landscape map of WebGIS.
Now popular index in stand-alone environment such as R-tree can not meet the landscape map data distribution network for efficiency requirements,and the current region quadtree index,while suited to network data release,but does not support landscape map data,therefore,it needs to design an index structure for the multi-scale representation of landscape map data-Multi-Scale Overlay Region quadtree,which we name as MSORQ-Tree in this research.
3 MSORQ-Tree
MSORQ-Tree isadeformation oftheregulardivision quadtree index of the region based on pyramid in network environment,which supports online multi-source,multi-dimensional data fusion and multi-scale representation.Compared to the pyramid structure of traditional rule-based segmentation of the region quadtree index,MSORQ-Tree added a landscape map overlay layer to express landscape map data.Figure 1 is diagram of the MSORQ-Tree structure,as well as unit linkages with other units.
3.1 Data structure of MSORQ-Tree
MSORQ-Tree utilize the main tree to store WebGIS data,and the subtree to store the landscape map data as shown in figure 1,the main tree and the subtree move synchronously and removed based on the vision.The data structure of MSORQ-Tree and the relationship between the main-tree and the overlapping sub-trees in the structure can be described by two means.
3.1.1 Inheritance relationship description
This describes and models the classic means of“father and son”representation of the quadtree structure.The MSORQ-Tree structure consists of the neighborhood relations within layers,“father and son”relationship between the layers,and their“inheritance”relationship,in which the main trees is divided into“father”and“son”,overlapping sub-tree as their“property”.With the increase of the map resolution,the family is expanding,and the possession of the“property”of generations and family members gradually becomes uneven.This can be defined as follows:
Definition 1 Each unit that is not in the bottom layer has a group of“sons”,they can be seen as the input of the unit;
Definition 2 Each unit that is not on the top layer has a group of“fathers”;
Definition 3 In the same layer,each unit has a set of“brothers”,also known as neighbors;
Definition 4 Since the expansion of the family,the property originally belonging to“father”is re-classified by a group of his sons.On the other hand,the inherited property of each“son”is part of the division of the father's property;
By the above definition of the division of MSORQ-Tree property,the phenomenon is presented as follows:①Since each“son”in the peer-brothers has different weights,property can not strictly be divided equally;②After several rounds of the distribution of property,property is no longer assigned to some of the“sons”;③ No matter how many rounds of re-distribution of property,the remaining property still belongs to the family,that is,all nodes in possession of the property are the offspring of the property source father.The right of figure 2 expresses MSORQTree with the means of“father and son”and“property”of inheritance,the central biggest region describes the property section enjoyed by the whole family.

Fig.2 MSORQ-Tree structure图2 MSORQ树结构
3.1.2 Graph theory description
Let us describe MSORQ-Tree structure with diagrams.The left of figure 1 shows representation of multiple layers overlapping pyramid.The main tree G=(V,E)consists of the vertex set V and edge set E.Each pair of vertices(v1,v2)∈ V×V,has an edge e∈E to link them.The vertices v1and v2are called the terminal vertex of e.
Overlapping sub-treeⅠ=(U,F)consists of the vertex set U and edge set of F.Each pair of vertices(u1,u2)∈U×U has an edge f∈F to link them.The vertices u1and u2are called the terminal vertex of f.As the vertex set V and U are the abstract representation s of the area region,while the U is the abstractions of non-uniform set,the vertices of U have different weights,and meet U⊆V,F⊆E.
MSORQ-Tree structure can be described with a horizontal and vertical diagrams.
Definition 5 Each horizontal diagram can be described by a neighborhood map.A vertex p∈V,can be defined by the following formula:

The property vertex m∈U occupied by the vertex p can be defined by the following formula:

Definition 6 Describing the vertical map with a bipartite graph.
Order Gi={(Vi∪ Vi+1),Ei}and Ei⊆(Vi× Vi+1),Ⅰi={(Ui∪Ui+1),Fi}and Fi⊆(Ui×Ui+1),for q∈Vi,its property is as follows:

Its son set as follows:

the property set of its sons as follows:

Similarly,for a unit p∈ Vi+1,its property is as follows:

Its father set as follows:

the property set of its father as follows:

The structure of the MSORQ-Tree that has n layers can be described by n neighborhood maps and n-1 vertical diagrams.
The structure of MSORQ-Tree can be evaluated with curtail window,which is the deformation of the quadtree.Curtail window is a n×n square window,contact cell of current layer with a set of cell of sub-level.Curtail window of MSORQ-Tree is(2×2)/4=1.Therefore,in MSORQ-Tree structure,each unit has only a father,and there is no multi-parent inheritance.
4 MSORQ-Tree index culling algorithm
4.1 Implementation
First of all, server-side renders vector data, and then spreads the rendered images in real-time to front-side browsers to display.In this process,the amount of the vector data determines the display speed of the map.We will render tiles with png format pictures of alpha channel,making the rendered tiles data support the overlay layer effect.Then we can ensure picture quality while minimizing the volume of image as much as possible.In MSORQTree data structure,Level0 divides the map into m* n regions,each region of Level0 splits into four sub-trees,and the layer in which the sub-trees are is Level1,then the number of rows and columns in map of Level are as follows:
Number of rows as:m×2Leveln,Leveln≥0
Number of columns as:n×2Leveln,Leveln≥0
Assuming that the extreme values of the map scope are Xmin,Xmax,Ymin,Ymax,X offset is Δx,Y offset is Δy;abscissa difference Δx,vertical difference Δy;the method to calculate the tile position(i,j)by the geographical coordinates(x,y)is as follows:
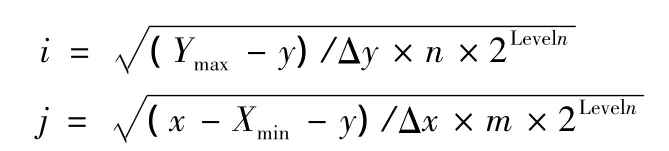
The location of the tile will be calculated via map coordinates of the data moved in the scene,while MSORQ-Tree data zoom,shrink,move,etc.operation.There is no need to generate picture repeatedly but simply download the new tiles into the visual domain to fill the missing region.Consequently,the efficiency of the server rendering and transmission is improved.
In order to display more extensive geographic information in map,we insert 3D landscape map data into a 2D vector map using the main tree index of MSORQ-Tree structure,as an overlay sub-tree layer.Overlay layer structure changes following the move of the main center coordinate of the map to indicate the 3D area in metro map.And the conjunction with Ajax technology[18]makes it possible to view the 3D region in real-time blanking when the map moving,as shown in figure 2,when the map is moving,the tiles of MSORQ-Tree overlay sub-tree are dynamically removed and loaded.
4.2 A practical case
The experimental platform utilize Intel Core2 Duo 2.53 GHz CPU,GeForce 8600 GT graphics card,256 M video memory,and Windows XP operating system.In the experimental platform,Ajax techniques to build separate front and exchange data between front and back.Taking the Shanghai city data as a demo,the performance of the demo has been tested.Shape data is selected as original vector data,the area is 6 000 square kilometers,scale is 1∶10 000,the region of 3D Landscape Map is Fengxian,with an area of 25 square kilometers.Use 3DS Max modeling and render it to the 3D landscape map by a rendering script supported,and then pre-process the data to MSORQ-Tree overlay sub-tree tiles;the data includes 20 pieces of 3D community landscape map.Shanghai 3D WebGIS example[19-20]is shown in figure 4.
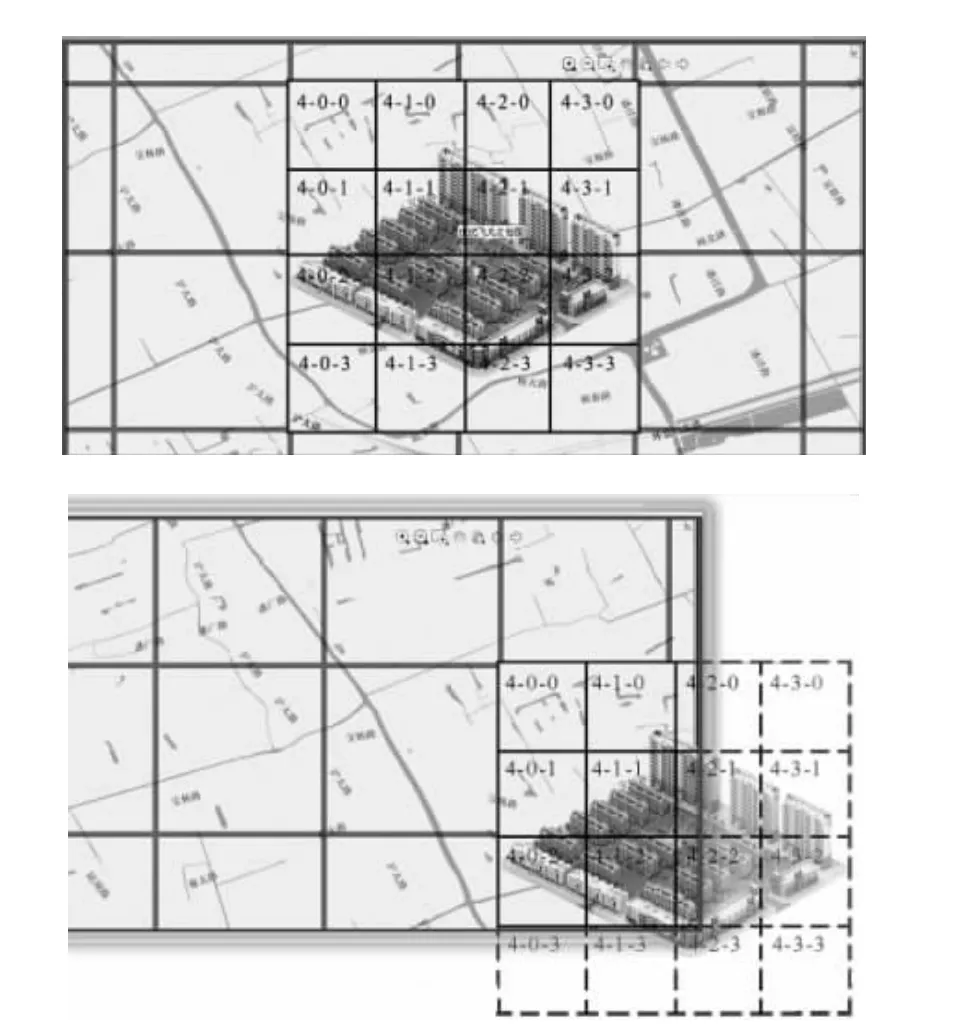
Fig.3 Tiles of MSORQ-Tree overlapping sub-tree are removed dynamically图3 MSORQ树叠加子树的自动删除
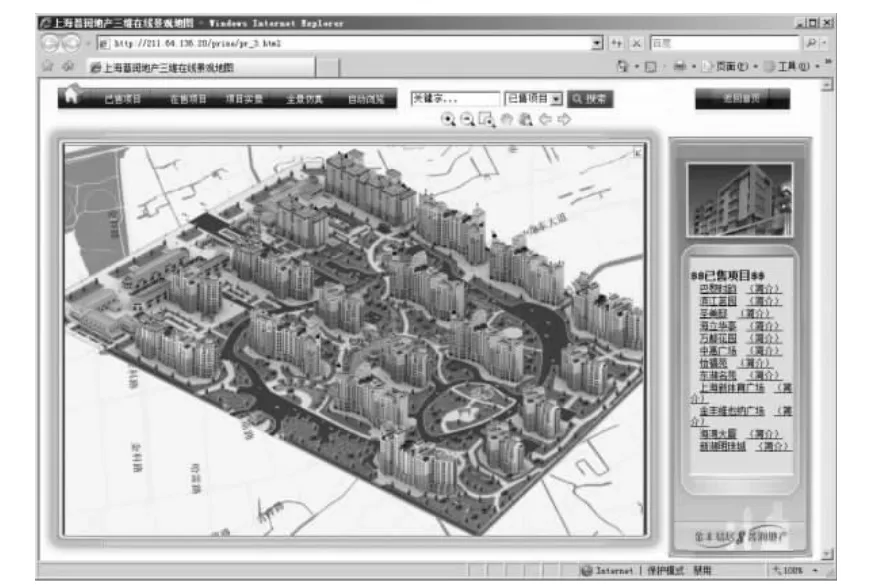
Fig.4 3D landscape on WebGIS of Shanghai city,PRC图4 上海市WEBGIS系统中三维景观地图
4.3 Performance comparison
Based on the data in figure 5,the test compares the two algorithms,layer expression and MSORQ-Tree.The structure of layer representation is a common method,that is using layer structure superpose 2D data on the map in the corresponding location directly.Layer expression can be understood as point of interest(POI)of traditional WebGIS,which is represented by Blend expression.Traditional WebGIS POI is generally a complete object.The approach proposed in this paper splits the POI into multi-level tiles combined with occlusion culling technology to achieve on-demand scheduling.Tile data on the server is directly stored as the image file format in the hard disk,indexed by the file name.2D WebGIS based on Mapserver makes tiles modeling for 2D layer,which can be set to tile hierarchical display,but is not used for the multi-dimensional data.
The landscape map is rendered by the spatial data range from 1∶500 to 1∶2 000 in order.Figure 5 embodies the different display scale,two indexes have different time-consuming.According to figure 5,landscape map index using MSORQ-Tree methods is not more time-consuming due to increased resolution.A lateral reading of the table to compare the results:in the same resolution,the higher the resolution is,the greater the gap of the timeconsuming between MSORQ-Tree index and layer expression.

Fig.5 Comparison of indexes time-consuming(The horizontal axis is scale,the vertical axis is time-consuming)图5 检索耗时对比(横坐标是比例尺,纵坐标是耗时)

Fig.6 3D landmap on Andorid mobile phone图6 安卓手机上的三维景观地图
Conclusions
The experimental results indicate that the MSORQ-Tree not only meets the network landscape map data representation requirements in the display effect but also has greater efficiency compared with the traditional layers representation.
The MSORQ approach is suitable for the situation in which complex representation is needed on the original WebGIS layer,such as multi-dimensional data overlay representation.R-tree is used for the store schedule at the back-end of the database but not the rendering acceleration at the front desk in the mobile phone environment.If the POI layer on the maximum is smaller than the screen and in the center of the screen,the efficiency will be slightly higher than the LAYER expression.The phone's screen is so small that most of the POI layer will be larger than the screen;the demand for display quality is high,the usage is frequent;the computing power is not particularly strong.However,with the help of MSORQ multi-dimensional data rendering can be achieved.
Based on MSORQ,we have completed a mobile phone UI,using an experimental platform with Android 2.2.1 smart phones,memory 200 M,3D Landscape Map of Laoshan Campus of Ocean University of China with an area of 122 hectares.We developed a mobile platform for campus users applying to the carpool services,as in figure 6.Making use of the phone's sensors,mobility,screen,visualization of geographic information,it will provide a possible interface for implementing the gamefication of GIS Big Data combined with cloud computing services.
/References:
[1]Peng Z R,Tspu M H.Internet GIS-Distributed GIServices for the Internet and Wireless Networks[M].John Wiley& Sons Ltd.,2003.
[2]Butler D.Virtual globe:the web-wide world[J].Nature,2006,439(7078):776-778.
[3]Zlatanova S,Prosperi D.Large Scale 3D Data Integration:Challenges and Opportunities[M].Taylor& Francis Group,2006.
[4]Breunig M.,Zlatanova S.3D geo-database research:retrospective and future directions[J].Computers &Geosciences,2011,37(7):791-803.
[5]Dietrich A,Gobbetti E,Yoon S E.Massive-model rendering techniques[J].IEEE Computer Graphics and Applications,2007,27(6):20-34.
[6]Faye Briggs.Talk:large data-great opportunities[Z].IDF2012,Beijing.
[7]Editoral.Big data specials [J].Nature,2008,455(7209):1-136.
[8]Bannai N,Fisher R B,Agathos A.Multiple color texture map fusion for 3D models[J].Pattern Recognition Letters,2007,28(6):748-758.
[9]Beatrix de C.Three-dimensional modelling in a geographical database[C]//Proceeding of the11th International Symposium on Computer-Assisted Cartography.Minneapolis(USA):CiteSeerX,1993:338-347.
[10]Brun L,Kropatsch W.Introduction to Combinatorial Pyramids[M].Berlin:Springer,2001,108-127.
[11]HanJ,Fu Y.Mining multiple-level association rules in large databases[J].IEEE Transactions on Knowledge and Data Engineering,1999,11(5):1-8.
[12]Brakatsoulas S,Pfoser D,Theodorides Y.Revisiting RTree construction principles[R].Greece,Computer Technology Institute,2002.
[13]Vangenot C.Multi-representation inspatial database using the MADS conceptual model[C]//Proceedings of the International Cartographic Association Workshop on Generalization and Multi-Scale Representation.Leicester(England):[s.n.],2004,337-342.
[14]Mark D M,Freksa C,Hirtle S C.Cognitive models of geographical space [J].Geographical Information Science,1999,13(8):747-774.
[15]Peng Hu,Qi Qingwen,Liu Zhaoli.Progress in studies on automated generalization of spatial point cluster[J].IEEE International Geoscience and Remote Sensing Symposium,2004,13(8):2841-2844.
[16]Li Aiqin,Li Deren,Gong Jianya,et al.A knowledge framework for spatial data multi-scale representation and processing[C]//International Conference on Earth Observation Data Processing and Analysis.Wuhan(China):SPIE,2008,7285:72852A-1-72852A-10.
[17]Guttman A.R-tree:A dynamic index structure for spatial search[C]//Proceedings of the 1984 ACM SIGMOD International Conference on Management of data.New York(USA):ACM,1984,14(2):47-57.
[18]Sayar A,Pierce M,Fox G.Integrating AJAX approach into GIS visualization Web services[C]//Advanced International Conference on Telecommunications and International Conference on Internet and Web Applications and Services.Guadeloupe(France):IEEE Computer Society,2006:169-170.
[19]Lv Zhihan,Yin Tengfei,Han Yong,et al.WebVR-web virtual reality engine based on P2P network [J].Journal of Networks,2011,6(7):990-998.
[20]Lv Zhihan,Chen Ge,Zhong Chen,et al.A framework for multi-dimensional WebGIS based interactive online virtual community [J].Advanced Science Letters,2012,7(5):215-219.