Experimental study on durability fracture behavior and vibration modal sweep for vehicle rear axle
2013-11-05MENYuzhuo门玉琢YUHaibo于海波HUONa霍娜
MEN Yu-zhuo(门玉琢), YU Hai-bo(于海波), HUO Na(霍娜)
(1.School of Mechatronics Engineering,Changchun Institute of Technology,Changchun 130012,China;2.China FAW Company Limited R&D Center,Changchun 130011,China)
A moving vehicle is constantly subject to impact loads induced by uneven road surface,most of which are cyclic dynamic random loads,as well as steering lateral force,driving force and braking force that generally change over time.A work load changing over time applied on a system will excite a number of vibration modes of the system,and the system dynamic response of a point far enough away from the loading point is presented as stress-time history that is different from load-time history in amplitude,phase and frequency.Such a stress-time history consists of two aspects,namely,the role of external loads and the dynamic response of a structure to these loads[1-2].In the actual test,we usually cannot observe the external loads directly,but can only measure their response at certain points of the structure.The output response functions measured from a point of the structure are collectively referred to as stress-time history.A moving car is in a complex vibration environment,the parts are usually subjected to stress and strain that change over time,the rear axle always has different vibration response because of external excitations,and repeated vibration loadscan make some structural parts subjected to vibration fatigue crack or fracture[3].
According to the results of the rear axle durability test on the enhancement roads for a Chinamade car,the strain loading spectrum near the fatigue crack is measured,the fatigue damage of the rear axle on the enhancement roads is calcu-lated,and through vibration frequency sweep of the rear axle and car body,the impact of the vibration frequencies and fatigue damage of the rear axle and car body on the fracture is analyzed.
1 Fatigue damage of rear axle
The rear axle durability of the test car is mainly dependent on the fatigue life.Fatigue damage is caused by the fluctuating cycles of strain orstress.The rainflow cycle counting method should be used to obtain stress range and mean in the cycles from the time curves.Each cycle may induce a certain amount of fatigue damage in the components or parts.The total damage caused by the entire time domain load signal may be obtained by adding up the damage caused by each cycle in the histogram[4-5],with the rainflow counting process as shown in Fig.1.
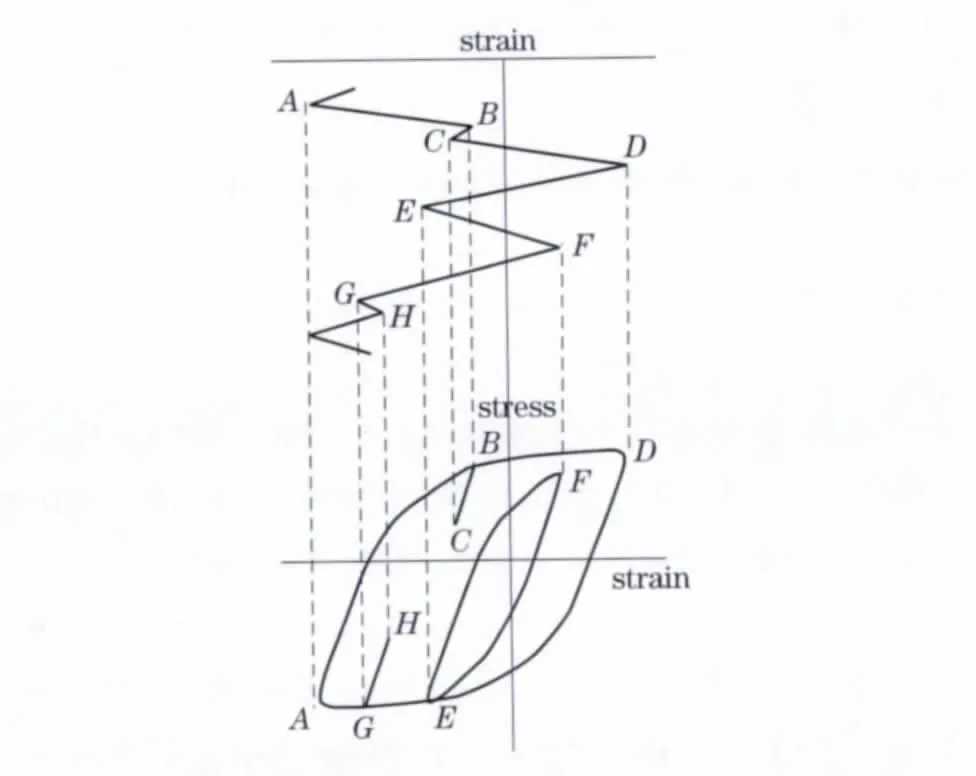
Fig.1 Rainflow counting process of stress-time history
It is difficult to attach strain gauges at the fracture location of the rear axle to measure the local strain,so strain gauges can be only attached near the fracture and thus it is required to estimate the local stress-strain response of the fracture location according to the measurement signal of the strain gauges.During cyclic loading,the modified Neuber equation[6]can be expressed by

where Δσnand Δεnare the local stress and strain range of the notch root respectively;Δσ and Δε are the nominal stress and strain range at the location of the strain gauges respectively;E is the elastic modulus;Kfis the fatigue notch factor.
The calculation equation of the fatigue notch factor Kfin Eq.(1)is
where Ktis the theoretical stress concentration factor;r is the notch root radius;a is the material constant.
The regression of fitting formula via fatigue test on a large number of notch specimens is the general approach to determineKf.Thereare many factors influencing Kfand is difficult to determine its change rule,so it is usually regarded as a constant.Ktmay be used in the absence of the test data of Kf.
According to the hysteresis loop curve equation,the relationship between the local stress and strain range of the fracture Δσnand Δεnis
where K'is the cyclic strength coefficient;n'is the cyclic strain-hardening exponent.
By putting Eq.(1)into Eq.(3),we will get
If the strain history measured by using strain gauges is known,we can calculate the hysteresis loops at the location of the strain gauges and the corresponding stress and strain range.Then put Eq.(3)and Eq.(4)to calculate the vertex coordinates(εn,σn)of the hysteresis loops of the local stress-strain response at the fracture location of the rear axle.
When the rear axle is subject to a dynamic load history,each hysteresis loop in the local stress-strain response of the parts represents a fatigue damage unit.After determining all the hysteresis loops and the structural strain-life curve,we can calculate the fatigue damage caused by each hysteresis loop[7-8].Assuming a load history forms N hysteresis loops and the two vertex coor-dinates of each hysteresis loop are(ε1i,σ1i)and(ε2i,σ2i)respectively,(i=1,2,…,N),the mean stress and vertex coordinates of hysteresis loop are shown in Fig.2.
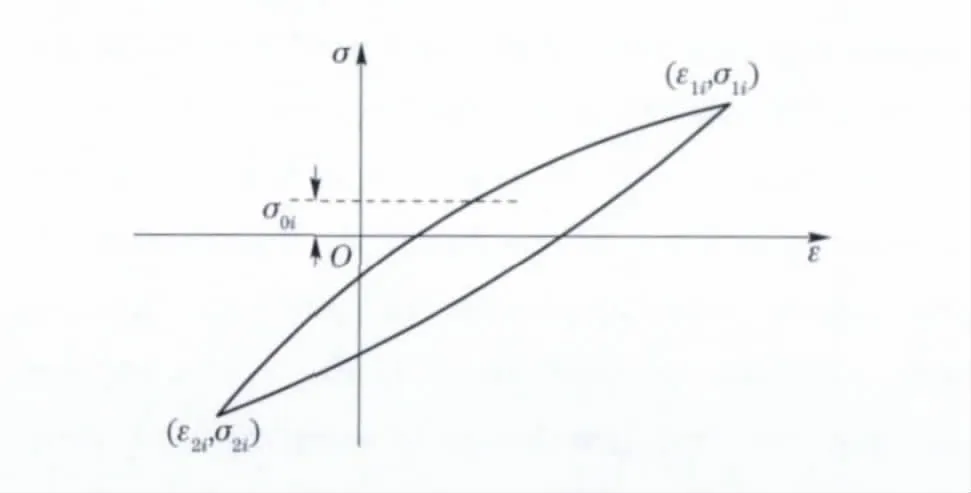
Fig.2 Mean stress and vertex coordinates of hysteresis loop
The strain range Δεiand mean stress σ0iof each hysteresis loop are given by

By putting strain range Δεiand mean stress σ0iinto the Manson-Coffin correction model of mean stress,we will get

where Δεiis the strain range;σ'fis the fatigue strength coefficient;σ0iis the mean stress of hysteresis loops;ε'fis the fatigue ductility coefficient;b is the fatigue strength exponent;c is the fatigue ductility exponent;Nfiis the fatigue life.
Using Eq.(7)to get the fatigue life Nfiwhich corresponds to strain range in each hysteresis loop.Assuming the fatigue damage that the stress hysteresis loop of the ithlevel produces is Di,we have

where niis number of actual cycle at level i.
According to the Minerlinearcumulative damage rule,add up the fatigue damage that each hysteresis loop produces to get the fatigue damage D that the entire load history produces in the structure,that is
where M is the load level.
When D=1,the rear axle is subjected to fatigue fracture.
2 Load measurementand processing
According to the results of the reliability test and finite element analysis,the strain gauges are attached as close as possible to the fracture crack of the rear axle and are shown in Fig.3.
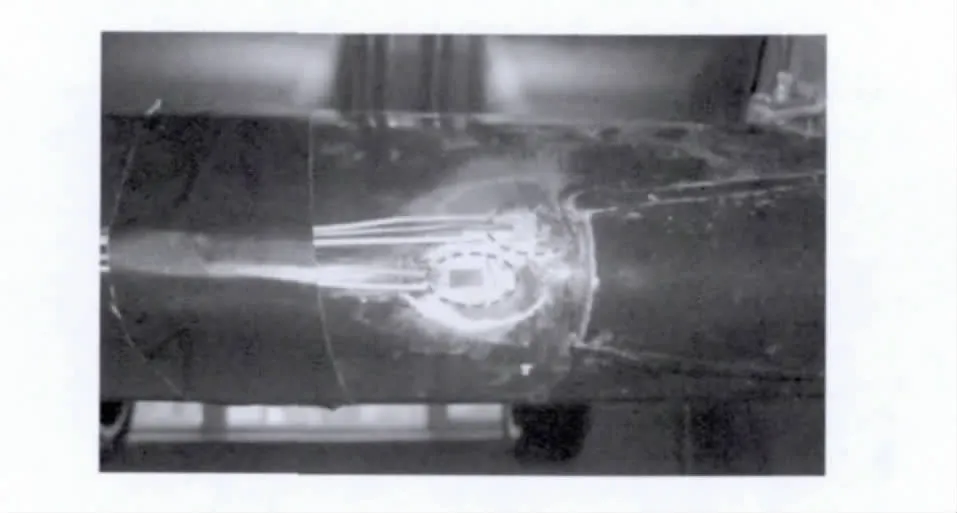
Fig.3 Strain gauges attached near rear axle fracture location
Data acquisition isconducted on theenhancement roads of proving ground.Washboard road is the key examining road in this paper,which consists of a series of bumps and may be used for automotive vibration,reliability and durability fatigue test[9].The washboard road is equally spaced straight road,with bumps of 25 mm high and 360 mm long and 750 mm spaced,and its cross-section shape is shown in Fig.4.

Fig.4 Cross-section diagram of washboard road
Because the bumps of the washboard road are equally spaced,a car will be subjected to forced vibration excited by the bumps when it passes at a certain vehicle speed.The fundamental frequency of forced vibration can be expressed as

A SoMat eDAQ data acquisition instrument is used to record rear axle strain,vehicle speed and other relevant test data throughout the test and the test results are imported into the INFIELD software to write macro programs for processing,the calculation and analysis results are shown in Fig.5 - Fig.8.
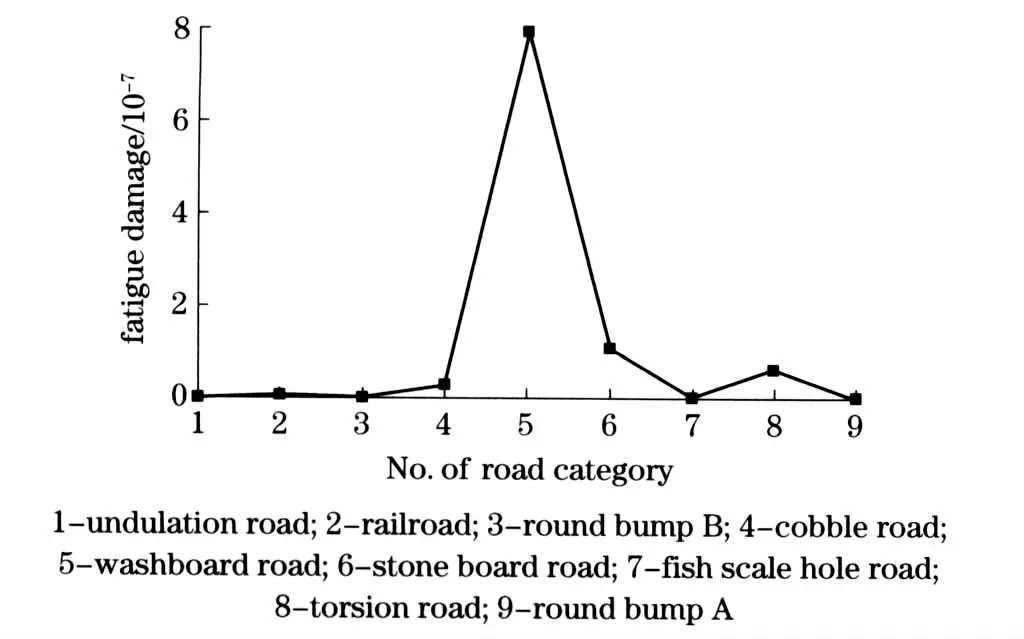
Fig.5 Fatigue damage on enhancement road
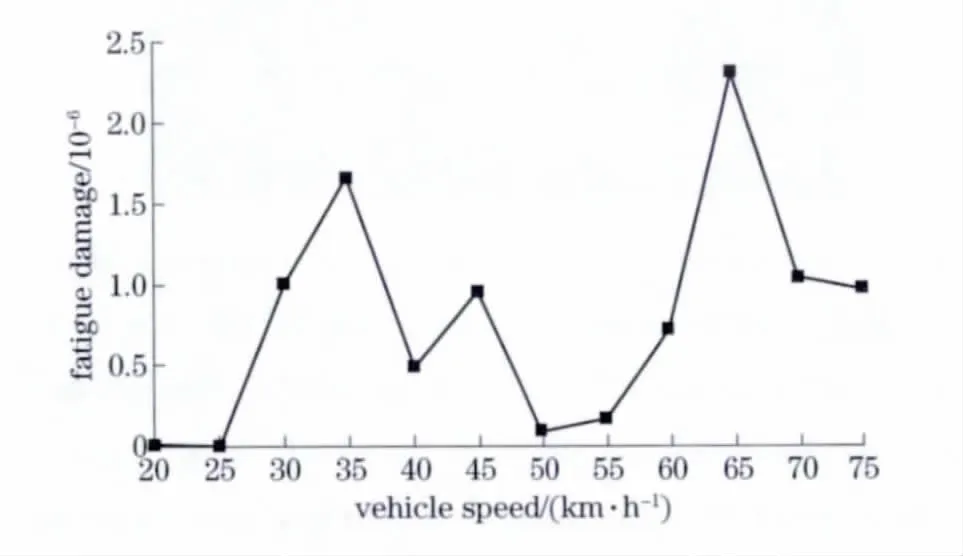
Fig.6 Fatigue damage of various speed on washboard

Fig.7 Power spectral density on enhancement road

Fig.8 Power spectral density on highway
Among all enhancementroadsofproving ground,the fatigue damage at the fracture location of the rear axle is caused by the washboard road accounts for more than 90%.The maximum fatigue damage is 7.553 32 × 10-7,which occurs under the vehicle speed of 65 km/h.The power spectral density(PSD)curves show that the strain work amplitude frequency at the fracture location of the rear axle is 24 Hz,and when the test car passes through the washboard road under the vehicle speed of 65 km/h,the forced vibration excitation frequency of the washboard road calculated according to Eq.(10)is 24.07 Hz that is close to the strain work amplitude frequency of the rear axle,leading to resonance of the rear axle and making the fracture location subjected to large strain and fatigue damage due to high stress concentration under this vehicle speed.
3 Modal parameter identification
Vibration mode is the inherent overall characteristics of elastic structures[10].If we find out the characteristics of the main modes in each order of structures within a vulnerable frequency range through modal analysis methods,we will be able to predict the actual vibration response of structures within this band under the action of various external or internal vibration sources.The objective of modal analysis is to identify the modal parameters of systems to provide a basis for vibration characteristic analysis and vibration fault diagnosisand prediction ofstructuralsystems.Therefore,modal analysis is an important method of structural dynamic design and equipment fault diagnosis.
When testing,lift the test car’s four wheels to a height and fall it on the iron square box,arrange two electromagnetic vibrators at both sides of the rear axle and make them tilt forward for 45°to vibrate the rear axle,and then arrange the two electromagnetic vibrators at the left rear and right front of the body respectively to vibrate straight up and use the vibration acceleration sensor to measure the vertical vibration.The modal transfer function curves of the rear axle and car body are shown in Fig.9 and Fig.10,and modal shapes are shown in Fig.11 - Fig.13.The modal parameters sweep results are shown in Tab.1.
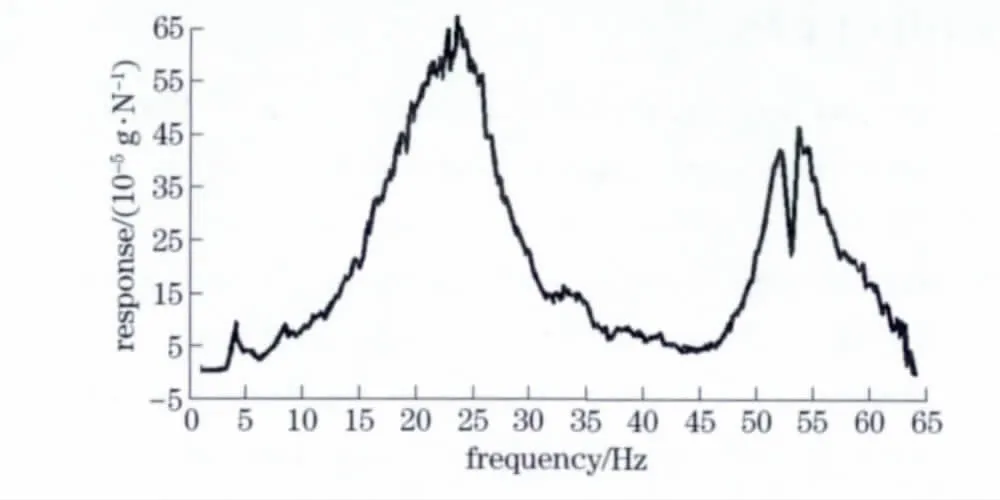
Fig.9 Modal transfer function of rear axle

Fig.10 Modal transfer function of car body

Fig.11 First-order torsional modal shape of car body
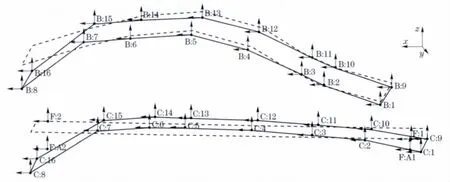
Fig.12 First-order bending modal shape of car body
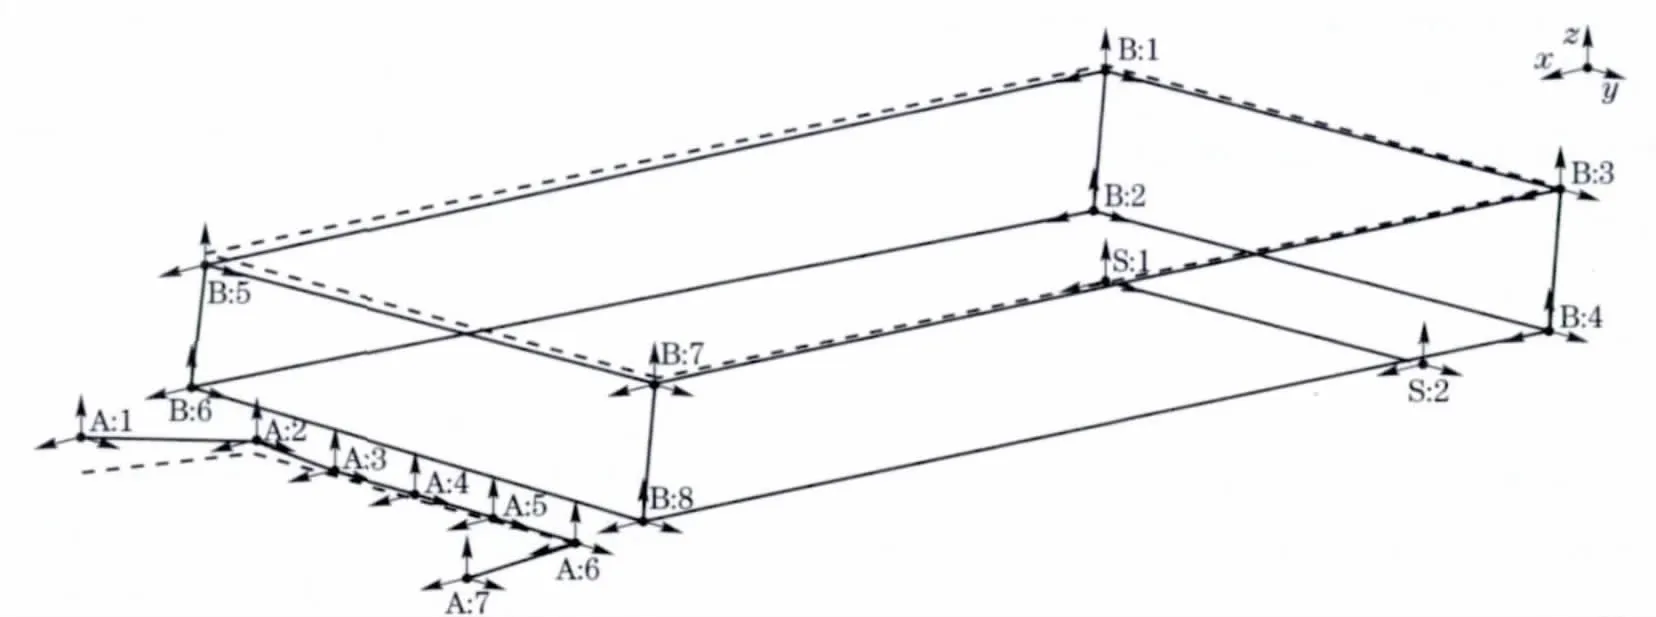
Fig.13 Vertical vibration modal shape of rear axle

Tab.1 Modal sweep results of axle and car body
The modal test results show that the vibration frequency of the rear axle of the test car is 23.53 Hz and the first-order torsional frequency of the car body is 25.25 Hz.In the stress test,the high-stress frequency of the rear axle is 24 Hz that is close both to the vibration frequency of the car body and the torsional frequency of the car body.From the modal transfer function curves of the car body and rear axle,we can see that,because of damping,the natural frequency ranges of the two have superposed area.Therefore,when the test car passes through the washboard road at the vehicle speed of 65 km/h,the high-stress frequency of its rear axle of 24 Hz has something to do with the torsional deformation of the car body.
4 Conclusion
The rear axle fatigue damage of the test car mainly concentrates on the washboard road of proving ground.When the excitation frequency of the road is greater than 20 Hz,the impact of the vehicle speed on the fatigue damage of the rear axle fluctuates greatly.When the vehicle speed on the washboard road is 65 km/h,the forced vibration excitation frequency of the road is 24.07 Hz that is close to the work amplitude frequency and modal vibration frequency(23.53 Hz)of the strain at the fracture location of the rear axle,leading to resonance and causing high stress distribution and then vibration fatigue fracture to the rear axle.The research results of this paper have provided an important basis for the structural and process improvement of the broken rear axle of the test car and the enhancement in the fatigue strength of the rear axle.
[1] Bannantine J A,Comer J J,Handrock J L.Fundamentals of metal fatigue analysis[M].Englewood Cliffs,New Jersey:Prentice Hall,2004:180 -184.
[2] Men Yuzhuo,Li Xiansheng,Yu Haibo.New method for automobile reliability test correlated with customers[J].Chinese Journal of Mechanical Engineering,2008,44(2):226-227.(in Chinese)
[3] Wang Mingzhu,Yao Weixing,Sun Wei.Sample approach for fatigue life prediction of structures under random vibration[J].China Mechanical Engineering,2008,19(8):972-973.
[4] Muddiman M W,Moore G R.Structural correlation of automotive proving ground to China customer field usage[R].Detroit,Michigan,USA:UltiTech Corporation,2003.
[5] Guo Hu,Chen Wenhua,Fan Xiaoyan.Research of enhancement coefficient of automobile reliability enhancement test on proving ground[J].Chinese Journal of Mechanical Engineering,2004,40(10):73-75.(in Chinese)
[6] Wang Xiaofeng.Fundamentals of automotive reliability engineering[M].Beijing:Tsinghua University Press,2007.(in Chinese)
[7] Campean F.Vehicle foresight customer correlation of engine components tests using life prediction modeling[C]∥SAE 2002 World Congress.Michigan:Society of Automotive Engineers,2002:109-111.
[8] Li Xiansheng,Huo Na,Tian Jingshu,et al.Dynamic load simulation and fatigue life calculation of pivotal load carrying structure of air suspension system[J].Journal of Jilin University:Engineering and Technology Edition,2011,41(1):14-15.(in Chinese)
[9] Wang Wenge,Wang Xueyi,Zheng Lianzhu.New method for calculating fatigue strength reliability[J].Journal of Jilin University:Engineering and Technology Edition,2005,35(6):665 -666.(in Chinese)
[10] Zhu Jinsong,Gao Change,Song Yupu.Fatigue behavior and cumulative damage rule of concrete under cyclic compression with constantconfined stress[J].Journal of Harbin Institute of Technology:New Series,2005,12(5):529 -530.
杂志排行

Journal of Beijing Institute of Technology的其它文章
- Temperature field simulation technology for thermostat electromechanical systems
- Weight distribution of sub-munitions fuze design
- Analysis of vehicle powertrain dynamic performance
- Roundness error evaluation by minimum zone circle via microscope inspection
- Strategy to control crawling vehicles with automated mechanical transmission
- Control strategy for hybrid tracked vehicles using fuzzy logic