Three-dimensional Computational Fluid Dynamics Modeling of Two-phase Flow in a Structured Packing Column*
2013-07-31ZHANGXiaobin张小斌YAOLei姚蕾QIULimin邱利民andZHANGXuejun张学军
ZHANG Xiaobin (张小斌), YAO Lei (姚蕾), QIU Limin (邱利民) and ZHANG Xuejun (张学军)**
Institute of Refrigeration and Cryogenics, Zhejiang University, Hanghzou 310027, China
Three-dimensional Computational Fluid Dynamics Modeling of Two-phase Flow in a Structured Packing Column*
ZHANG Xiaobin (张小斌), YAO Lei (姚蕾), QIU Limin (邱利民) and ZHANG Xuejun (张学军)**
Institute of Refrigeration and Cryogenics, Zhejiang University, Hanghzou 310027, China
Characterizing the complex two-phase hydrodynamics in structured packed columns requires a powerful modeling tool. The traditional two-dimensional model exhibits limitations when one attempts to model the detailed two-phase flow inside the columns. The present paper presents a three-dimensional computational fluid dynamics (CFD) model to simulate the two-phase flow in a representative unit of the column. The unit consists of an entire corrugation channel and describes well the real liquid flow conditions. The detailed unsteady two-phase 3D CFD calculations on column packed with Flexipak 1Y were implemented within the volume of fluid (VOF) mathematical framework. The CFD model was validated by comparing the calculated thickness of liquid film with the available experimental data. Special attention was given to quantitative analysis of the effects of gravity on the hydrodynamics. Fluctuations in the liquid mass flow rate and the calculated pressure drop loss were found to be qualitatively in agreement with the experimental observations.
structured packing column, two-phase flow, computational fluid dynamics, three-dimension
1INTRODUCTION
Structured packed columns (SPC) offer enhanced performance for separation operations, both in terms of pressure drop and capacity, as compared with randomly packed columns [1, 2]. However, the benefits associated with the efficiency improvement of structured packings come at the cost of an increased initial investment. It is therefore necessary to further minimize the pressure drop while maintaining high separation efficiency and flooding capacity. These technical indices are all closely related to the two-phase flow process with the liquid holdup as a linking parameter [3, 4]. Regardless of significant efforts over the past 20 years to model the hydrodynamics and mass transfer in structured packings, the design of a structured packed column still primarily relies on empiricism and semi-empirical equations with uncertain limits of application [2, 5, 6]. To our knowledge, the available theoretical models make use of empirical constants to various degree, which are calibrated with limited and case-dependent experimental data. However, it is very difficult to obtain the data with high accuracy mainly because of the complex geometry inside the column. For example, the liquid film thickness or the holdup for the calculation of irrigated pressure drop and flooding point is an approximate parameter obtained from experiments with the assumption that the liquid flow is evenly distributed over the solid surface.
On the other hand, the rapid advances in computational fluid dynamics (CFD) have greatly accelerated the development of distillation equipment [3]. For example the MellapakPlus packings developed by SulzerTM in 1999 with the aid of CFD tools is considered a remarkable advance, because of its greatly reduced pressure drop and increased capacity [3]. A comprehensive review of CFD applications in the design of structured packings can be found in Refs. [1, 7]. Up to now, the volume of fluid (VOF) mathematical framework with its 2D geometrical model has been commonly applied to characterize the two-phase flow inside structured packings [2, 8]. In such an approach, the countercurrent two-phase flow is initially modeled in a simplified 2D geometry. Next, the calculated liquid film thickness and the liquid velocity are used to modify the wall boundary conditions in the subsequent 3D simulations with only the gas as the working media [7]. This approach provides an indirect strategy to obtain the irrigated pressure drop; however, the related mechanisms are not accurately accounted for.
The present study aims to develop a two-phase CFD model for the SPC with a 3D geometrical element. First, the state of the art for two-phase CFD simulations of SPC is reviewed in detail. A preliminary numerical experiment is performed to highlight the limitation of the present two-phase calculations based on a 2D geometrical element. Then, the VOF mathematical framework, the turbulence model, and the surface tension consideration are introduced. Finally, the 3D CFD simulation results of wetted area, liquid mass flow fluctuation at the outlet, spatial liquid film thickness variation and pressure drop are analyzed.
2GEOMETRICAL MODELS
Commercially available SPCs, without exception, are comprised of many identical element of structured packing. An element is made up of an ensemble consisting of a large number of triangular channels havingidentical cross-sections, [see Fig. 1 (a)]. The triangular flow channel is characterized by the dimensions of height (h), side (s), and base (b) [Fig. 1 (b)], as well as the corrugation angle α with respect to the horizontal plane [Fig. 1 (a)]. The two adjacent corrugated sheets are superimposed so that the opposite corrugations form a cross-type pattern with the crests of the corrugations nearly in contact. Such a structure permits a high specific surface with void fractions as high as about 98% [3].

Figure 1Schematic of geometrical model for CFD simulations for structured-packing column
Three-dimensional two-phase CFD calculations for the whole column seem to be presently impossible due to the complexity of structured packing geometry and the limitations of computer resources. A popular way is to model the two-phase flow based on a reduced 2D geometry or a representative unit. Baten and Krishna [9, 10] used a geometry as shown in Fig. 1 (a) to model two-phase mass transfer process within a sheet of Katapak type packing. The most complete configuration of ceramic structured packing was modeled by Fard et al. [11] to calculate the wet pressure drop. The results showed good agreement with the experimental data, at the cost of a higher requirement for computer resources than the aforementioned simplified models. A common 2D structure [Fig. 2 (d)], which is actually a special cross section of the geometry shown in Fig. 1 (a), was first used by Beata et al. [12], and later by Raynal et al. [8], who further improved the structure to take into account the micro- scale texture of the surface [7]. The purpose of the CFD simulations by Raynal et al. based on the 2D geometry was to determine the liquid holdup and the gas/liquid interface velocity, that were used to modify the boundary conditions of subsequent quasi-wetted pressure drop calculations.

Figure 2Side view of gas flow channels in structured packing in different cross sections
In fact, there are two limitations in the present 2D two-phase CFD simulations of structured packing as compared to real flow situations. First, the configuration of the 2D flow channel is actually determined by the cross section position in Fig. 1 (a), and different structures will be formed at different cross section locations in the same structured packing, as shown in Fig. 2. Therefore, the one as shown in Fig. 2 (d) used by Raynal et al. [8] can’t represent the typical flow channel of the liquid and gas inside. Second, all 2D simulations assume that the gas and liquid flow in opposite directions. Strictly speaking, they are not opposite directions, since the corrugation is 45° or 60° inclined with respect to the vertical (gravity) direction. Fig. 3 shows the typical dry gas streamlines within the geometry of Fig. 1 (a) from our preliminary simulations, where a clearance of 1 mm is left between the two adjacent corrugated sheets. The renormalization-group(RNG) k-ε turbulence model is used to obtain the results. The boundary conditions are also shown in Fig. 1 (a). It is observed that most of the gas in the interior of the triangular channel will flow up through the channel until it reaches the column side walls, although part of the gas near the base side of the triangle channel may deviate the route because of intensive collisions. As far as the 3D model used by Fard et al. [11] for two-phase simulations, it requires too many grid cells for the domain. For example, there are over 640000 tetrahedral cells with a cell size of 1 mm for Fig. 1 (a), regardless of the grid resolution used inside the liquid film layer in order to characterize the liquid flow. If the cell size decreases to 0.5 mm as Fard et al. [11] suggested, it is estimated that the cell number will be over two million for the same geometry.

Figure 3Simulated typical gas streamlines within the geometry of Fig. 1 (a)
Recently, Chen et al. [13] developed a complex 3D model for two-phase simulations focused on the hydrodynamics and mass-transfer behavior in a typical representative unit of structured packings. The model consisted of four triangle channels, two of which are reversely positioned with the others, therefore, it is still time-consuming to generate high-quality grid for simulating the liquid and gas flows since the complex geometry. However, if only the liquid film flow conditions are only concerned, the model can be further simplified, as shown in Fig. 1 (d). The geometry with a square cross section was shaped by cutting through the triangular cross section of a single channel at a point along its axial length, and mirroring it relative to the base side of the triangular channel, as shown in Figs. 1 (c) and 1 (d). The purpose of the mirroring step is to provide the water inlet with a width of w through the surface indexed by “4” in Fig. 1 (d) and to obtain a hexahedral structured grid for the entire domain of the calculation. Based on the observations of Fig. 3 that the gas inside the channel is almost unaffected by the sudden collision at the base side, it is reasonable to assume that the collision has a negligible effect on the liquid flow along the corrugation walls. Therefore, any mirrored shape is allowable. The whole model approximates the liquid flow conditions within the original triangular channel. The total axial length of our modeled geometry is 85 mm, and the liquid inlet and outlet boundary occupies 25 mm in the middle of the length, as shown in Fig. 1 (d). The width w of the liquid layer, from a prior estimate, approaches the thickness δ of the liquid film. Velocity inlet and pressure outlet boundary conditions are, respectively, applied to both the gas and liquid inlet and outlet. The gas inlet velocity vgis calculated as

where Ugsis the superficial gas velocity, calculated from the gas flow factorwheregρ is the gas density; e is packi n; α is corrugation angle. The effective velocity of the liquid vlis defined as

where Ulsis superficial liquid velocity, and htis the total holdup. If the entire surface is covered and no suspended liquid exists, then htcan be described in terms of the thickness of the liquid film by

where s is the side length of corrugation.
The entire 3D geometry is made up of 139638 hexahedral structured grid cells, each with a cell size of 1 mm. Additionally, the meshes near the corrugation side walls have a dimension of 0.1 mm in the normal direction to ensure at least 5 cells in the liquid film thickness [7, 8]. The commonly used structured packings Flexipac 1Y, whose detailed geometries are listed in Table 1, is modeled to validate the two-phase calculations. The micro-scale treatment of the corrugation surface is not modeled in the simulations, as treated in Refs. [8-10].
3CFD MATHEMATICAL FRAMEWORK
A variety of researchers have validated the VOF model for gas-liquid CFD simulations of structured packing [7, 8, 14]. In this model, no relative velocity between the phases is considered and all phases share a single set of momentum equations:

where the term Fstaccounts for the surface tension effects. The mixture density ρmand viscosity μmcalculated by the volume-averaged method embodies implicitly the dependence of the momentum equation on the volume fractions of the phases. One limitation of the shared-fields approximation is that the accuracy of the velocities near the interface can be adversely affected if large velocity differences exist. Fortunately this effect is insignificant for packing situations because the shear force imposedby the countercurrent gas flow can be neglected under conditions far awayfrom flooding [15]. The deduction is also validated by the present calculations presented in the forthcoming results. The volume fraction of the second phase at the interface is tracked through the solution of the continuity equation, which has the following form:

Table 1Geometrical and surface characteristics for the simulated structured packing [2]

where αqis volumetric fraction of phase q. The volume fraction equation of the primary phase is computed based on the constraint of αp=1−αq.
The surface tension effects can be ignored if the Weber number We=By substituting the densitylρ≈1000 kg·m−3, characteristic length L≈1 mm (liquid film thickness), liquid film free-stream velocity um≈0.2 m·s−1, and surface tension coefficient σ≈0.072 m·s−1for water, into the definition of the Weber number, one obtains We~0.5. Another factor that impacts the liquid flow is the wettability of the solid packing surface. This is especially true if the contact angle is large enough, and the liquid flows down in forms of drop and rivulet. Such a condition should be avoided because it reduces the two-phase contact time and area, and increases the wet pressure drop. In our simulations, the interface surface tension effects and the contact angle of 70° between water and treated stainless steel wall are considered, and the detailed modeling strategy and mathematical framework are given by Ref. [16].
The k-ε turbulence model and its upgraded model: the realizable k-ε model and the RNG k-ε have been widely used for modeling turbulent flow inside structured packings. Raynal et al. [8] compared the calculations on an elementary crossing geometry [Fig. 1(b)] using these turbulence models together with the standard wall function treatment. They suggested that the RNG model, which combines turbulence modeling for high Reynolds numbers and laminar viscosity considerations for low Reynolds numbers, may be the appropriate model to consider for the whole range of Reynolds numbers. Therefore, the RNG turbulence model was adopted in our simulations. The upstream turbulence was considered to be fully developed, and the turbulence intensity I and length scale λ are specified at the inlet boundary, which are estimated from the following empirical formulas, respectively [16]:
The commercial CFD software package Fluent 6.3 is used to solve the sets of equations. The general computational strategy is as follows: First, by temporarily changing the liquid input boundary condition to the wall boundary condition, while maintaining the other boundary conditions unchanged, the steady gas flow field without the liquid phase is obtained. Restoring the liquid inlet boundary then triggers the unsteady two-phase calculations. The convergence criterion for the continuity equation and the species equation is 10−3on the residual. To ensure convergence at every time step, the time step size is set at 50 μs. The pressure-implicit with splitting of operator (PISO) pressure-velocity coupling algorithm is adopted, and the standard scheme is used for the pressure discretization. A second order upwind scheme is used for the momentum equation, and a modified high resolution interface capturing (HRIC) for the volume fraction equations of species. Parallel computations are performed on a workstation with 8 processors and 8G RAM. It takes over 24 h to calculate a complete case.
4RESULTS AND ANALYSIS
As shown in Table 2, five cases were calculated to validate the geometrical and mathematical model. High liquid flux is chosen to quantitatively compare the calculated values with the limited published data. However, it should be pointed out that the modeled liquid flux here is much higher than the general operation of corrugation packings. The experimental liquid flux is for a tailored structured packing by Sulzer Co. [8]. A more practical liquid flux of 100 m3·m−2·h−1was also calculated to validate the CFD models.

Table 2Boundary conditions for the modeled cases
Figure 4 shows the volumetric liquid fraction distribution on the corrugated walls for Cases 1-4 when quasi-steady state is achieved, where the definition of quasi-steady is explained in the following context. Comparing Case 1 and Case 3, which are far from the flooding point and have the same liquid flux, but differing air flow rates, one finds that the liquid distribution is practically unaffected by the gas flow. Also, by considering total mass conservation, it can be observed that the mean liquid film thickness is not sensitive to the gas flow, as revealed by the experimental observations of counter-current gas-liquid flow in an inclined tube [17, 18]. The liquid spreads more uniformly on the lower corrugation wall than on the upper one, as shown in Fig. 4.

Figure 4Liquid volumetric fraction distribution on wetted corrugation walls when reaches quasi-steady
The reasons can be explained by referring to the gravity component schematic shown in Fig. 5. Here the global reference frame is defined with the z axis vertically up and the x-z plane coinciding with the base area of the triangular channel. Gravity is first decomposed into g1=g sin(α) and g2=g cos(α) on the vertical plane (also x-z plane, dotted line), where g1, g2are parallel and normal to the corrugation edge, respectively. Then g2is further decomposed into g21=g2sin(β)=g cos(α)sin(β) and g22=g2cos(β)= g cos(α)cos(β) on the plane normal to the corrugation wall, where g21is normal to the corrugation wall, g22is on the corrugation wall and normal to the corrugation edge, and β is the acute angle between the long side and short side of the triangle section, see Fig. 5. So the total gravity component on the corrugation wallwith angle relative to the corrugation edge tg(γ)=g22/g1=ctg(α)cos(β). The angle φ between g1,22and the projection of the vertical line on the corrugation wall is calculated as

φ represents the general direction of gravity acting on the fluid with respect to the projection of the vertical line on the corrugation wall. Ideally for a column, the liquid flows downward along the gravity projected direction on the wall to avoid the liquid possibly accumulating, therefore, φ=0 is expected. Fig. 6 depicts the curves described by Eq. (8), and it is found that φ reaches the maximum as α approaches 40° regardless of the value of β. In addition, φ increases with β if α is fixed. When α=β=45°, g22/g=0.866, γ= arctan[cos(β)]~35° and φ~10°, which indicates that other forces, such as the inertial force, the drag force from the gas flow and the frictional force from the wall, balance the gravitational effects, otherwise the liquid would accumulate downstream.
As pointed out in the above analyses, the gravitational component g21pulls the liquid off the upper wall, leading to an increased thickness of liquid film δ; While, g21pressing the liquid onto the lower wall, leading to a decreased δ. For one-dimensional laminar thin liquid film along an inclined surface due to gravity,the liquid velocity profile is [19]:

Figure 5Schematic of gravity components in the reference frame of corrugation channel

Figure 6Variation of ϕ and g21/g as function of α and β

In Eq. (9), the interfacial shear stress due to the gas flow is ignored, and y is the normal distance to the surface. It is found that the magnitude of velocity near the interface (y≈δ) is proportional to δ, therefore, the liquid on the upper wall accumulates more obviously than that on the lower wall along the general direction of gravity ϕ. As the liquid flux increases, the residence time of a liquid element on the wall is shortened because the increased inlet velocity, the accumulation on the upper wall becomes not obvious, as shown in Fig. 4 (c).

Figure 7Liquid mass flow rate at outlet vs. time when reaches quasi-steady
Zabaras and Dukler defined flooding as the phenomenon observed when the liquid film becomes very wavy and a mass of liquid is carried by the gas flow upwards and away from the channel [18]. Therefore, one of the ways to judge whether flooding occurs is to observe the transient mass flow rate fluctuations at the liquid outlet, as shown in Fig. 7 for Cases 1 to 4 when the quasi-steady state is achieved. Here quasi-steadiness means the time-averaged mass flow does not vary with time over several cycles. Both the fluctuating amplitude and frequency are observed to increase with the gas flow rate, implying that the disturbance at the surface becomes more intense. Such behavior agrees with the experimental observation regarding the incipience of flooding for inclined pipes by Pantzali et al [17]. They also found that the fluctuating frequency up to flooding conditions is less than 10 Hz, as is shown in Fig. 7. The time-averaged mass flow rate at the liquid outlet for Case 4 is about 18.45 g·s−1, very close to the exact value 18.5 g·s−1at the inlet calculated by Eq. (2). The observations of simulated frequency and mass flow rate imply that all the flows are still far away from a flooding condition. Fig. 7 also reveals that mean mass flow rate remains practically unaffected by the gas flow before flooding [17, 18, 20].
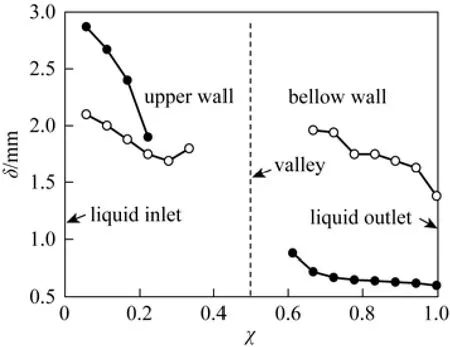
Figure 8Mean liquid film thickness δ on corrugation walls [χ is dimensionless distance, χ=d/(2s)]
It is difficult to exactly define the mean liquid film thickness when quasi-steady state is reached because of the spatially uneven liquid distribution on the walls, as shown in Fig. 4. A straightforward way is to calculate the average values on the plane normal to the flow direction (also normal to the corrugation walls). On every plane, the thickness values are estimated by counting the structured cell number in the normal direction, and the results are shown in Fig. 8. The values near the corrugation valley are not given because all the sampled planes are submersed in the liquid film. Although Case 3 has a smaller liquid flow rate than Case 2, the film thickness on the upper wall for the former is larger than the latter also because of the liquid accumulation. As a whole, the mean liquid film thickness on the upper corrugation wall is larger than that on the lower one. Raynal et al [8] experimentally measured the thickness of the liquid film in the structured packing with the same geometrical dimensions as those of Flexipac 1Y shown in Table 1. In their experiments, the water and air flowed co-currently and the liquid holdup across the packing was measured using an original high-resolution gamma ray topographic system. The liquid film thickness was then deduced based on the assumption that the walls were totally wetted. In view of the fact that the mean liquid film thickness is almost unaffected by the gas flow before flooding [17, 18], it makes sense to compare our calculations with the experimental data, as shown in Table 3, where the 2D numerical results by the same authors using the VOF model are also present. Our results appear to be closer to the experimental data than the 2D-CFD results.

Table 3Comparison of liquid film thickness before flooding between experiments, 2D-CFD and 3D-CFD
The wetted pressure drop is another crucial index for the operation of the SPC. An approximate CFD approach to calculate the wetted pressure drop has been recently proposed by Raynal et al [8]. They substituted the real gas velocity into the dry pressure drop calculations, and considered the flow space reduction as a result of liquid holdup in their 2D CFD simulations with a VOF model [8]. The separate two-step strategy is a feasible, though an approximate approach and it cannot reveal the real interactive process between the phases within the packings. Fig. 9 shows the pressure profiles along the axial midlines on the corrugation walls. It is found that the pressure drop loss occurring in the two-phase zone is much larger than in the dry gas flow zone. Another interesting phenomenon is that the maximum pressure drop on the lower wall occurs at the rear of the gas-liquid interaction zone, while on the upper surface it occurs at the front end. In the two-phase zone, the pressure on the lower wall is larger than that on the upper wall because of gravity.

Figure 9Pressure profiles for Case 2 midline on below corrugation surface; ■ valley; ○ midline on upper corrugation surface
5CONCLUSIONS
This study proposes a 3D geometrical element for two-phase CFD simulations of structured packed columns. The 3D model is comprised of a triangular channel, more closely approaches the real conditions of liquid flows than the 2D calculations, and provides features of acceptable geometrical complexity and computer resource requirements. The VOF formulation, together with the RNG turbulence model, has been used to characterize the unsteady two-phase hydrodynamics of columns Flexipak 1Y with high liquid flow rates. The general results obtained, such as the surface wetted area, transient liquid mass flow rate at the outlet, and the wetted pressure drop were analyzed and qualitatively agree with previous experimental observations. The simulated liquid film thickness was found to more closely represent the experiment measurements than that obtained from a 2D geometry.
Other conclusions include: (1) Gravity components on the two corrugation walls are quantitatively calculated as a function of corrugation angle and interior angle of the channel triangle section. Gravity causes the liquid to accumulate more on the upper corrugation wall than on the lower wall. (2) The transient liquid mass flow rate at the outlet was characterized, and its frequency behavior can be used as an index for determining the incipience of flooding. (3) The contribution of the two-phase flow zone to the pressure drop loss dominated that from the dry gas flow.
In summary, the 3D CFD simulation is a more powerful tool to gain insight into the two-phase flow characteristics within a structured packed column.
NOMENCLATURE
a bed specific surface area, m2·m−3
b channel base, m
e packing void fraction, m3·m−3
Fsgas flow factor, kg1/2·m−1/2·s−1
g gravitational acceleration, m·s−2
h channel height, m
I turbulent intensity
L liquid film characteristic length, m
p pressure, Pa
Qlliquid flow rate, m3·h−1
Re Reynolds number ( =ρνs/μ)
s corrugation side, m
t time, s
Ugssuperficial gas velocity, m·s−1
Ulssuperficial liquid velocity, m·s−1
ummean liquid film velocity, m·s−1
vgeffective gas velocity, m·s−1
vleffective liquid velocity, m·s−1
vmmixture velocity vector, m·s−1
We Weber number ( =ρlLum2/σ)
w liquid inlet boundary width, m
α corrugation angle, (°)
β angle between long side and short side of the triangle from channel section, (°)
γ angle of gravitational component on corrugation wall and corrugation edge, (°)
λ turbulent length scale, m
μmmixture viscosity, Pa·m
ρmmixture density, kg·m−3
ρqq phase density, kg·m−3
σ surface tension coefficient, m·s−1
ϕ angle of gravitational component on corrugation wall and frontal projection of gravity on corrugation wall, (°)
REFERENCES
1 Spieel, L., Meier, W., “Distillation columns with structured packings in the next decade”, Trans. IChemE,81, Part A, 39-47 (2003).
2 Petre, C.F., Larachi, F., Iliuta, I., Grandjean, B.P.A., “Pressure drop through structured packings: Breakdown into the contributing mechanisms by CFD modeling”, Chem. Eng. Sci.,58, 163-177 (2003).
3 Zhang, Y.L., Zhu, H.M., Yin, Q.X., “Experimental Study on local mass transfer of structured packing with the method of flow visualization”, Chin. J. Chem. Eng.,19, 870-875 (2011).
4 Gualito, J.J., Cerino, F.J., Cardenas, J.C., Rocha, J.A., “Design method for distillation columns filled with metallic, ceramic or plastic structured packings”, Ind. Eng. Chem. Res.,36, 1747-1757 (1997).
5 Rocha, J.A., Bravo, J.L., James, R.F., “Distillation columns containing structured packings: A comprehensive model for their performance. 1. Hydraulic models”, Ind. En g. Chem. Res.,32, 641-651 (1993).
6 Rocha, J.A., Bravo, J.L., James, R.F., “Distillation columns containing structured packings: A comprehensive model for their performance. 2. Mass-transfer model”, Ind. Eng. Chem. Res.,35, 1660-1667 (1996).
7 Raynal, L., Lebeaud, A.R., “A multi-scale approach for CFD calculations of gas-liquid flow within large size column equipped with structured packing”, Chem. Eng. Sci.,62, 7196-7204 (2007).
8 Raynal, L., Boyer, C., Ballaguet, J.P., “Liquid holdup and pressure drop determination in structured packing with CFD simulations”, Can. J. Chem. Eng.,82, 871-879 (2004).
9 Baten, J.M.V., Krishna, R., “Liquid-phase mass transfer within KATAPAK-S®structures studied using computational fluid dynamics simulations”, Catal. Today,69, 371-377 (2001).
10 Baten, J.M.V., Krishna, R., “Gas and liquid phase mass transfer within KATAPAK-S®structures studied using CFD simulations”, Chem. Eng. Sci.,57, 1531-1536 (2002).
11 Fard, M.H., Zivdar, M., Rahimi, R., Esfahany, M.N., Afacan, A., Nandakumar, K., Chuang, K.T., “CFD simulation of mass transfer efficiency and pressure drop in a structured packed distillation column”, Chem. Eng. Technol.,30(7), 854-861 (2007).
12 Beata, S., Ireneusz, Z., Andrzej, G., “Liquid flow on structured packing: CFD simulation and experimental study”, Chem. Eng. Technol.,26(5), 580-584 (2003).
13 Chen, J.B., Liu, C.J., Yuan, X.G., Yu, G.Z., “CFD simulation of flow and mass transfer in structured packing distillation columns”, Chin. J. Chem. En g.,17(3), 381-388 (2009).
14 Raynal, L., Harter, I., “Studies of gas-liquid flow through reactors internals using VOF simulations”, Chem. En g. Sci.,56, 6385-6391 (2001).
15 Bontozoglou,V., Papapolymerou, G., “Laminar film flow down a wavy incline”, Int. J. Multiphase flow.,23(1), 69-79 (1997).
16 Fluent, Help Document, Ansys Cooperation (2006).
17 Pantzali, M.N., Mouza, A.A., Paras, S.V., “Counter-current gas-liquid flow and incipient flooding in inclined small diameter tubes”, Chem. Eng. Sci.,63, 3966-3978 (2008).
18 Zabaras, G.J., Dukler, A.E., “Countercurrent gas-liquid annular flow, including the flooding state”, AIChE J.,34, 389-396 (1988).
19 Van, P.C., Liquid-vapor Phase-change Phenomena, Hemisphere Publishing Corporation, USA, 105-110 (1992).
20 Zapke, A., KroÈger, D.G., “Countercurrent gas-liquid flow in inclined and vertical ducts (I) Flow patterns, pressure drop characteristics and flooding”, Int. J. Multiphase flow,26, 1439-1455 (2000).
10.1016/S1004-9541(13)60576-5
2012-06-18, accepted 2013-06-06.
* Supported by the Major State Basic Research Development Program of China (2011CB706501) and the National Natural Science Foundation of China (51276157).
** To whom correspondence should be addressed. E-mail: xuejzhang@zju.edu.cn
猜你喜欢
杂志排行

Chinese Journal of Chemical Engineering的其它文章
- Halloysite Nanotube Composited Thermo-responsive Hydrogel System for Controlled-release*
- Experimental and Theoretical Studies of CO2Absorption Enhancement by Nano-Al2O3and Carbon Nanotube Particles
- A Novel γ-Alumina Supported Fe-Mo Bimetallic Catalyst for Reverse Water Gas Shift Reaction*
- Recent Advances in Separation of Bioactive Natural Products*
- Volumetric and Transport Properties of Aqueous NaB(OH)4Solutions*
- A New Tuning Method for Two-Degree-of-Freedom Internal Model Control under Parametric Uncertainty*