DOING META-ANALYSIS IN SLA: PRACTICES, CHOICES, ANDSTANDARDS
2012-12-04SHAOFENGLINATSUKOSHINTANIandRODELLIS
SHAOFENG LI, NATSUKO SHINTANI, and ROD ELLIS
1University of Auckland, 2Nanyang Technological University
Meta-analysis is a statistical method used to synthesize the cumulative effect of an interventional treatment or a certain relationship that has been subjected to empirical investigation. Notwithstanding the increasing popularity of meta-analysis in second language acquisition (SLA) research, there is considerable methodological inconsistency in the 22 SLA meta-analyses published to date. Also, given the highly technical nature of some aspects of this statistical procedure and the specialized knowledge associated with it, it is a daunting task to conduct a meta-analysis and understand or interpret meta-analytic results. This paper seeks to solve the conundrum surrounding meta-analysis by explicating its basic procedure and technical aspects in an accessible manner. Utilizing SLA meta-analyses as examples, it discusses the methodological options of each stage of a meta-analysis, makes recommendations about how to handle some key issues, and points out the pitfalls that might undermine the robustness and credibility of meta-analytic findings.
INTRODUCTION
Meta-analysis refers to a set of statistical procedures used to quantitatively synthesize the results of empirical studies relating to a certain topic. There has been a steady growth in the number of meta-analyses in the field of second language acquisition (SLA) since Norris and Ortega’s (2000) seminal synthetic review of form-focused instruction research. In comparison with other methods of research synthesis, the superiority of meta-analysis lies in its objectivity, systematic methodology, transparent reporting, ability to identify moderator variables, and usefulness in guiding the decisions of practitioners and policy makers.
Despite its increasing popularity in the field of SLA, conducting or even understanding the results of a meta-analysis can be challenging because of the sophisticated technical aspects and of the many methodological choices and judgment calls each stage of the process involves. The available choices and judgment calls have led to inconsistency and variability with regard to practice and reporting (Aguinisetal. 2011; Dieckmannetal. 2009); the situation is worse in SLA despite the fact that meta-analysis was introduced into this research domain more than a decade ago. This is ironic because inconsistent or insufficient reporting is what many meta-analysts often criticize primary-level studies for. More importantly, the choices and judgment calls may have substantial impact on the results of a meta-analysis, which can mislead or misguide consumers of meta-analytic reviews.
This article seeks to achieve three goals. First, it provides some basic guidelines about how to conduct a meta-analysis. Second, it presents the methodological choices and judgment calls at each stage of the meta-analytic process, discusses the most common practice, and makes recommendations based on previous meta-analyses as well as expert opinions from specialists of meta-analysis (e.g. Borensteinetal. 2009; Hunter and Schmidt 2004; Lipsey and Wilson 2001). Third, it discusses how SLA meta-analyses have been executed, points out their strengths and limitations, and alerts future meta-analysts to issues that may threaten the methodological rigor of meta-analysis. To achieve these goals, this article starts with an overview of meta-analysis as a tool of research synthesis, focusing on its epistemic aspects. The second part deals with the technical aspects and elaborates on the practice, choices, and standards that each step entails. The paper is concluded by summarizing the strengths and weaknesses of meta-analysis and some major issues in need of immediate attention from SLA meta-analysts.
UNDERSTANDING META-ANALYSIS
As a snapshot of meta-analysis, Field and Gillett’s definition constitutes a good point of departure: “Meta-analysis is a statistical tool for estimating the mean and variance of underlying population effects from a collection of empirical studies addressing ostensibly the same research question” (2010: 665). This statement crystallizes some central concepts about meta-analysis. First, meta-analysis is used to synthesize quantitative studies, and therefore it is generally not applicable to studies with other research designs such as ethno-graphy. Second, meta-analysis is used to (1) estimate the magnitude of an overall effect or relationship among the population based on the cumulative evidence contributed by a collection of sample studies, and (2) identify the factors accounting for the variability of the computed estimates. Third, a crucial assumption for the meta-analyzed studies is that they investigate the same construct. However, in reality there are often nuanced differences across studies in operationalizing the same construct.
An easy way to understand the concept, procedure, implementation, and reporting of a meta-analysis is to conceive it as an empirical study, as it has all the components and follows the same procedure as the latter. To conduct a meta-analysis, the researcher must (a) formulate a research question, (b) collect, code and analyze the data, and (c) write a research report. The meta-analytic report follows a similar format to that of an empirical study (although there are special requirements as what to report in a meta-analysis): an introduction that expounds the research constructs and contextualizes the research question(s), a method section that shows how the synthesis is carried out, a results section that reports the findings, and a discussion section that interprets the findings (Cooper 2010). In meta-analysis, the “participants” are the empirical studies and the data for analysis are the effect sizes calculated using the quantitative data (e.g. means and standard deviations) contributed by the included studies (which are called primary studies in meta-analysis to distinguish them from the synthesis proper). The analysis involves aggregating the effect sizes to obtain a mean effect size, followed by moderator analysis that identifies variables mediating the effects or relationships. The building block of meta-analysis is therefore the effect size, a standardized numeric index that makes the results of primary studies comparable irrespective of their idiosyncratic methodological characteristics.
Glass coined the term “meta-analysis” in 1976 and conducted the first official meta-analysis with Smith in the following year on the effects of psychotherapy (1977). Subsequently a series of texts were published that have developed meta-analysis into a distinct, full-fledged subdivision within the field of statistics (Borensteinetal. 2009; Cooperetal. 2009; Hedges and Olkin 1985; Hunter and Schmidt 2004; Lipsey and Wilson 2001; Rosenthal 1984). Numerous journal articles have also appeared on how to fine-tune the technical aspects to obtain more robust results and on the norms of meta-analytic practice for conducting the analysis and reporting and interpreting the results (e.g. Aguinisetal. 2011; Kisamore and Brannick 2008; Oswald and Johnson 1998; Schmidtetal. 2009). Furthermore, statistical packages have been developed exclusively for meta-analysis (e.g. Borensteinetal. 2006). Meta-analysis has become a widely accepted method of research synthesis that generates reliable state-of-the-art information about a certain topic that has been empirically investigated (Aguinisetal. 2011; Hufetal. 2011).
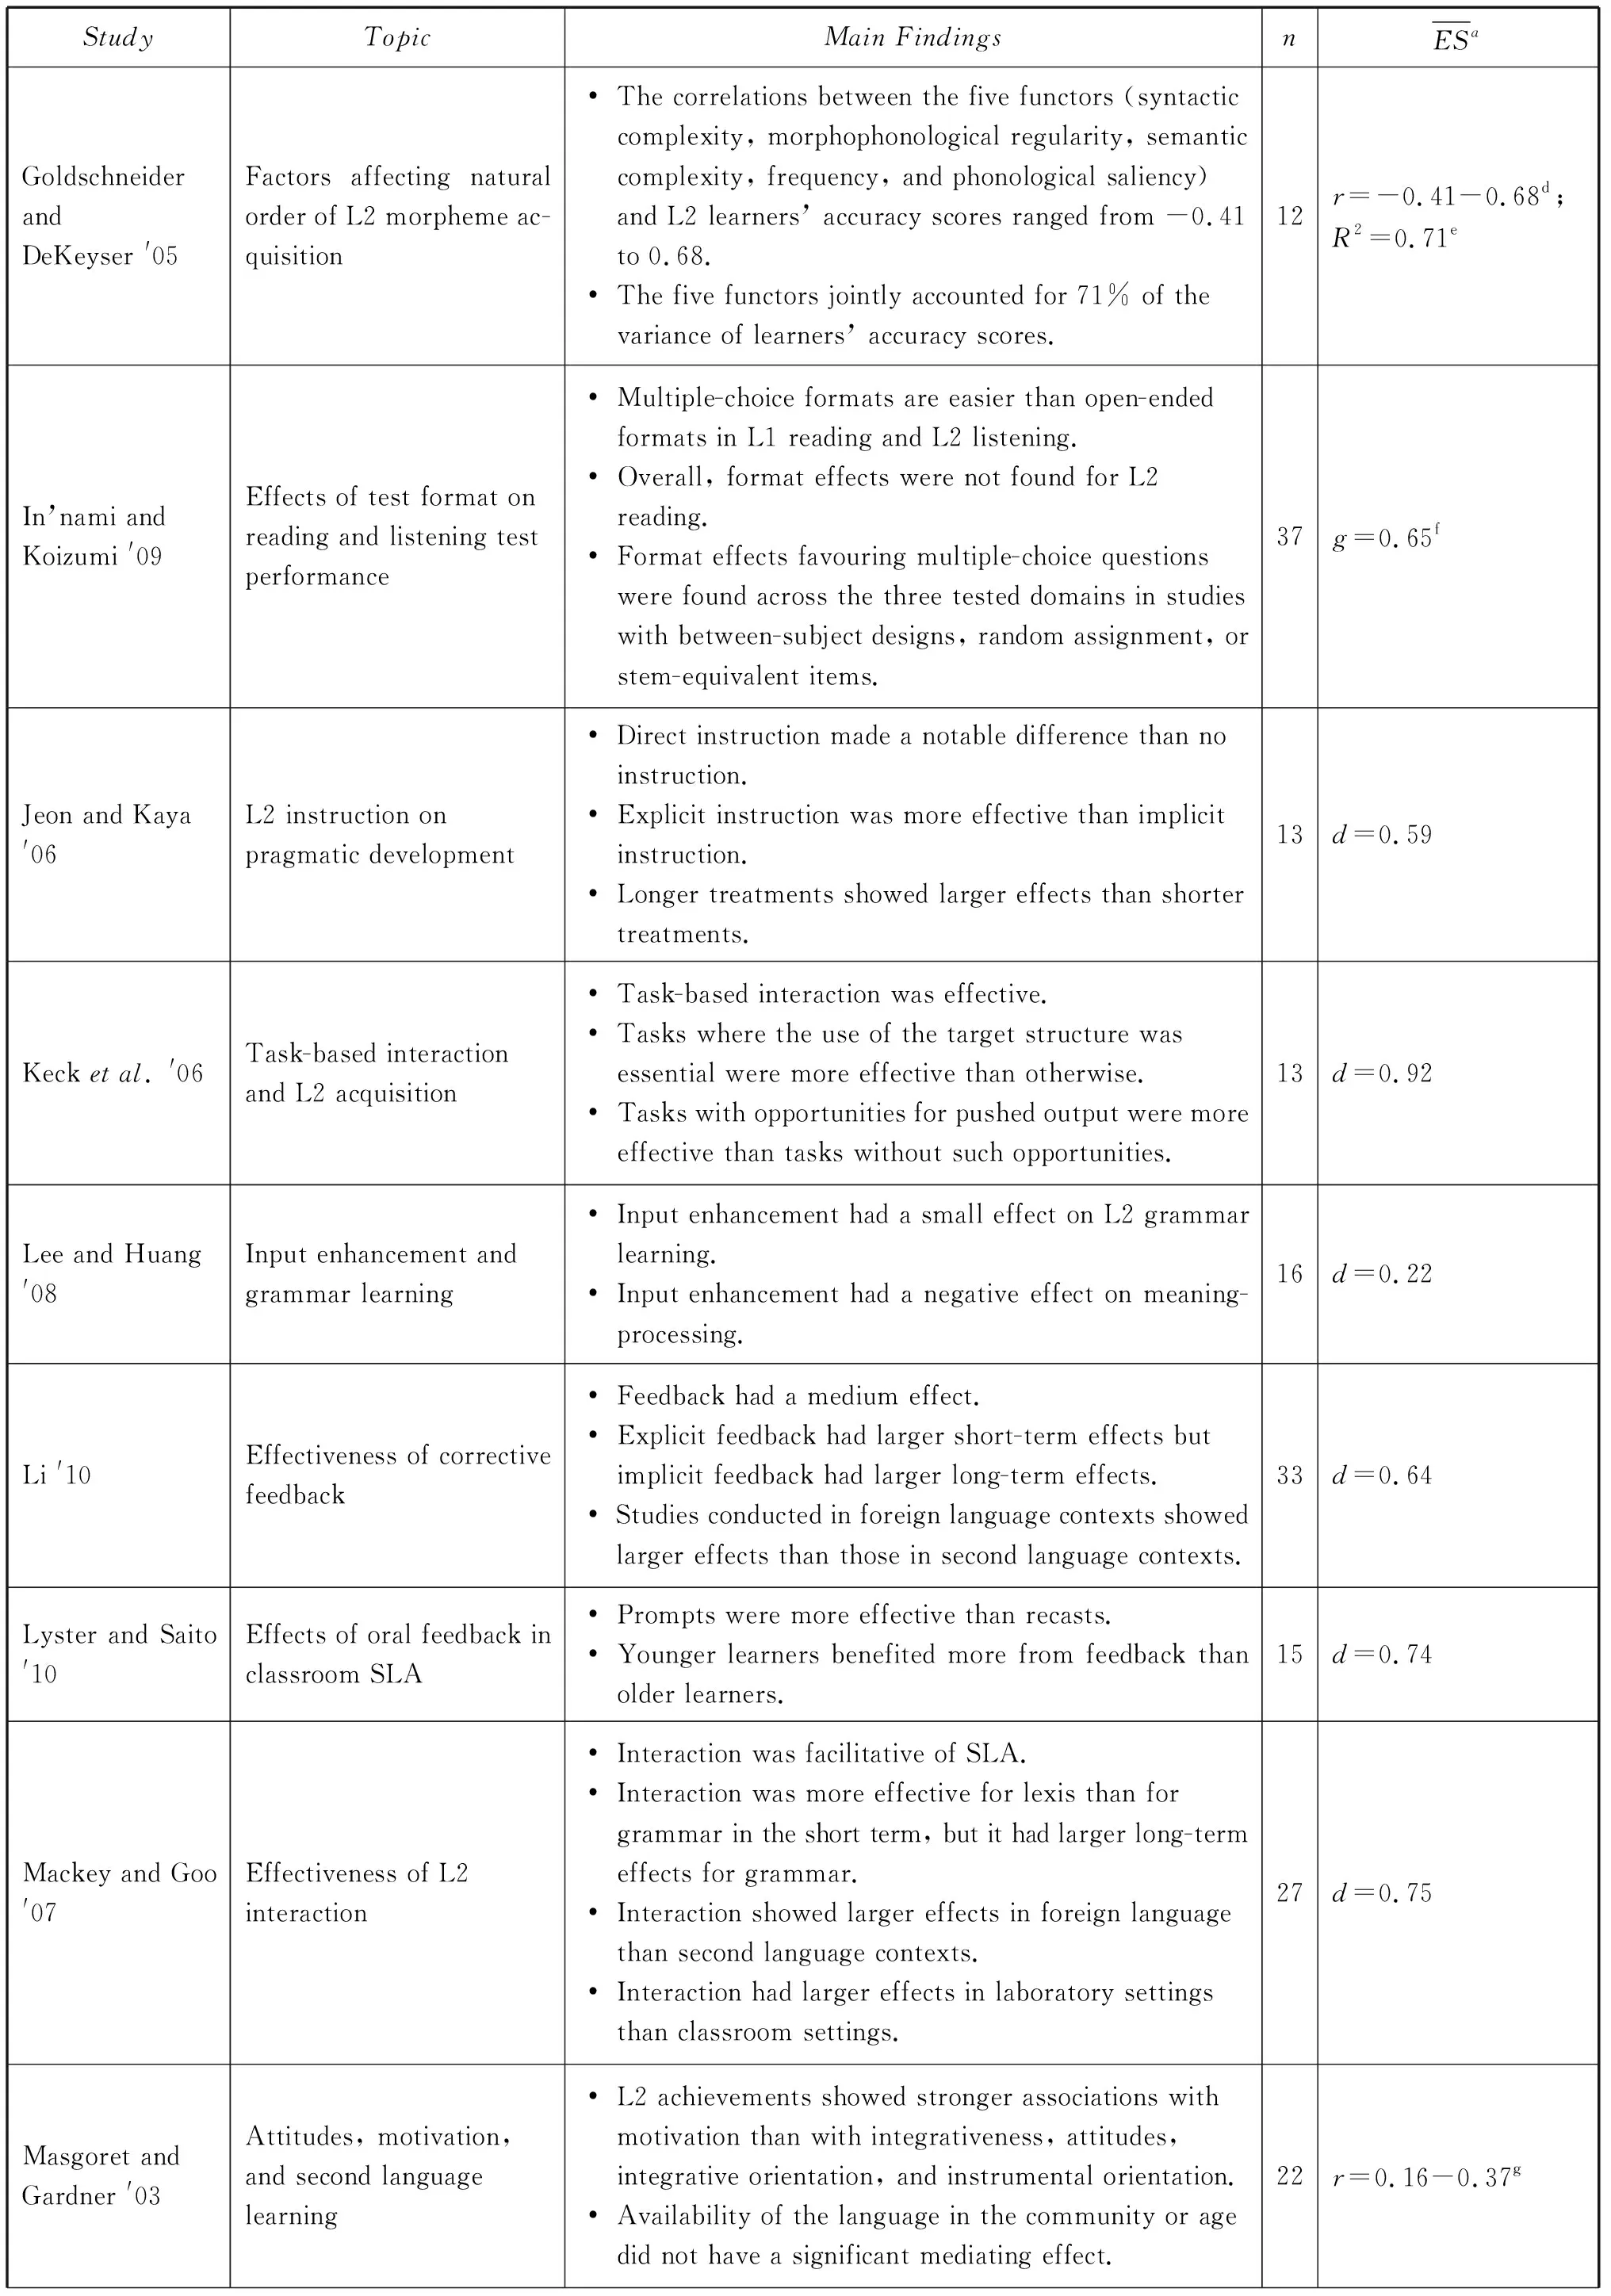
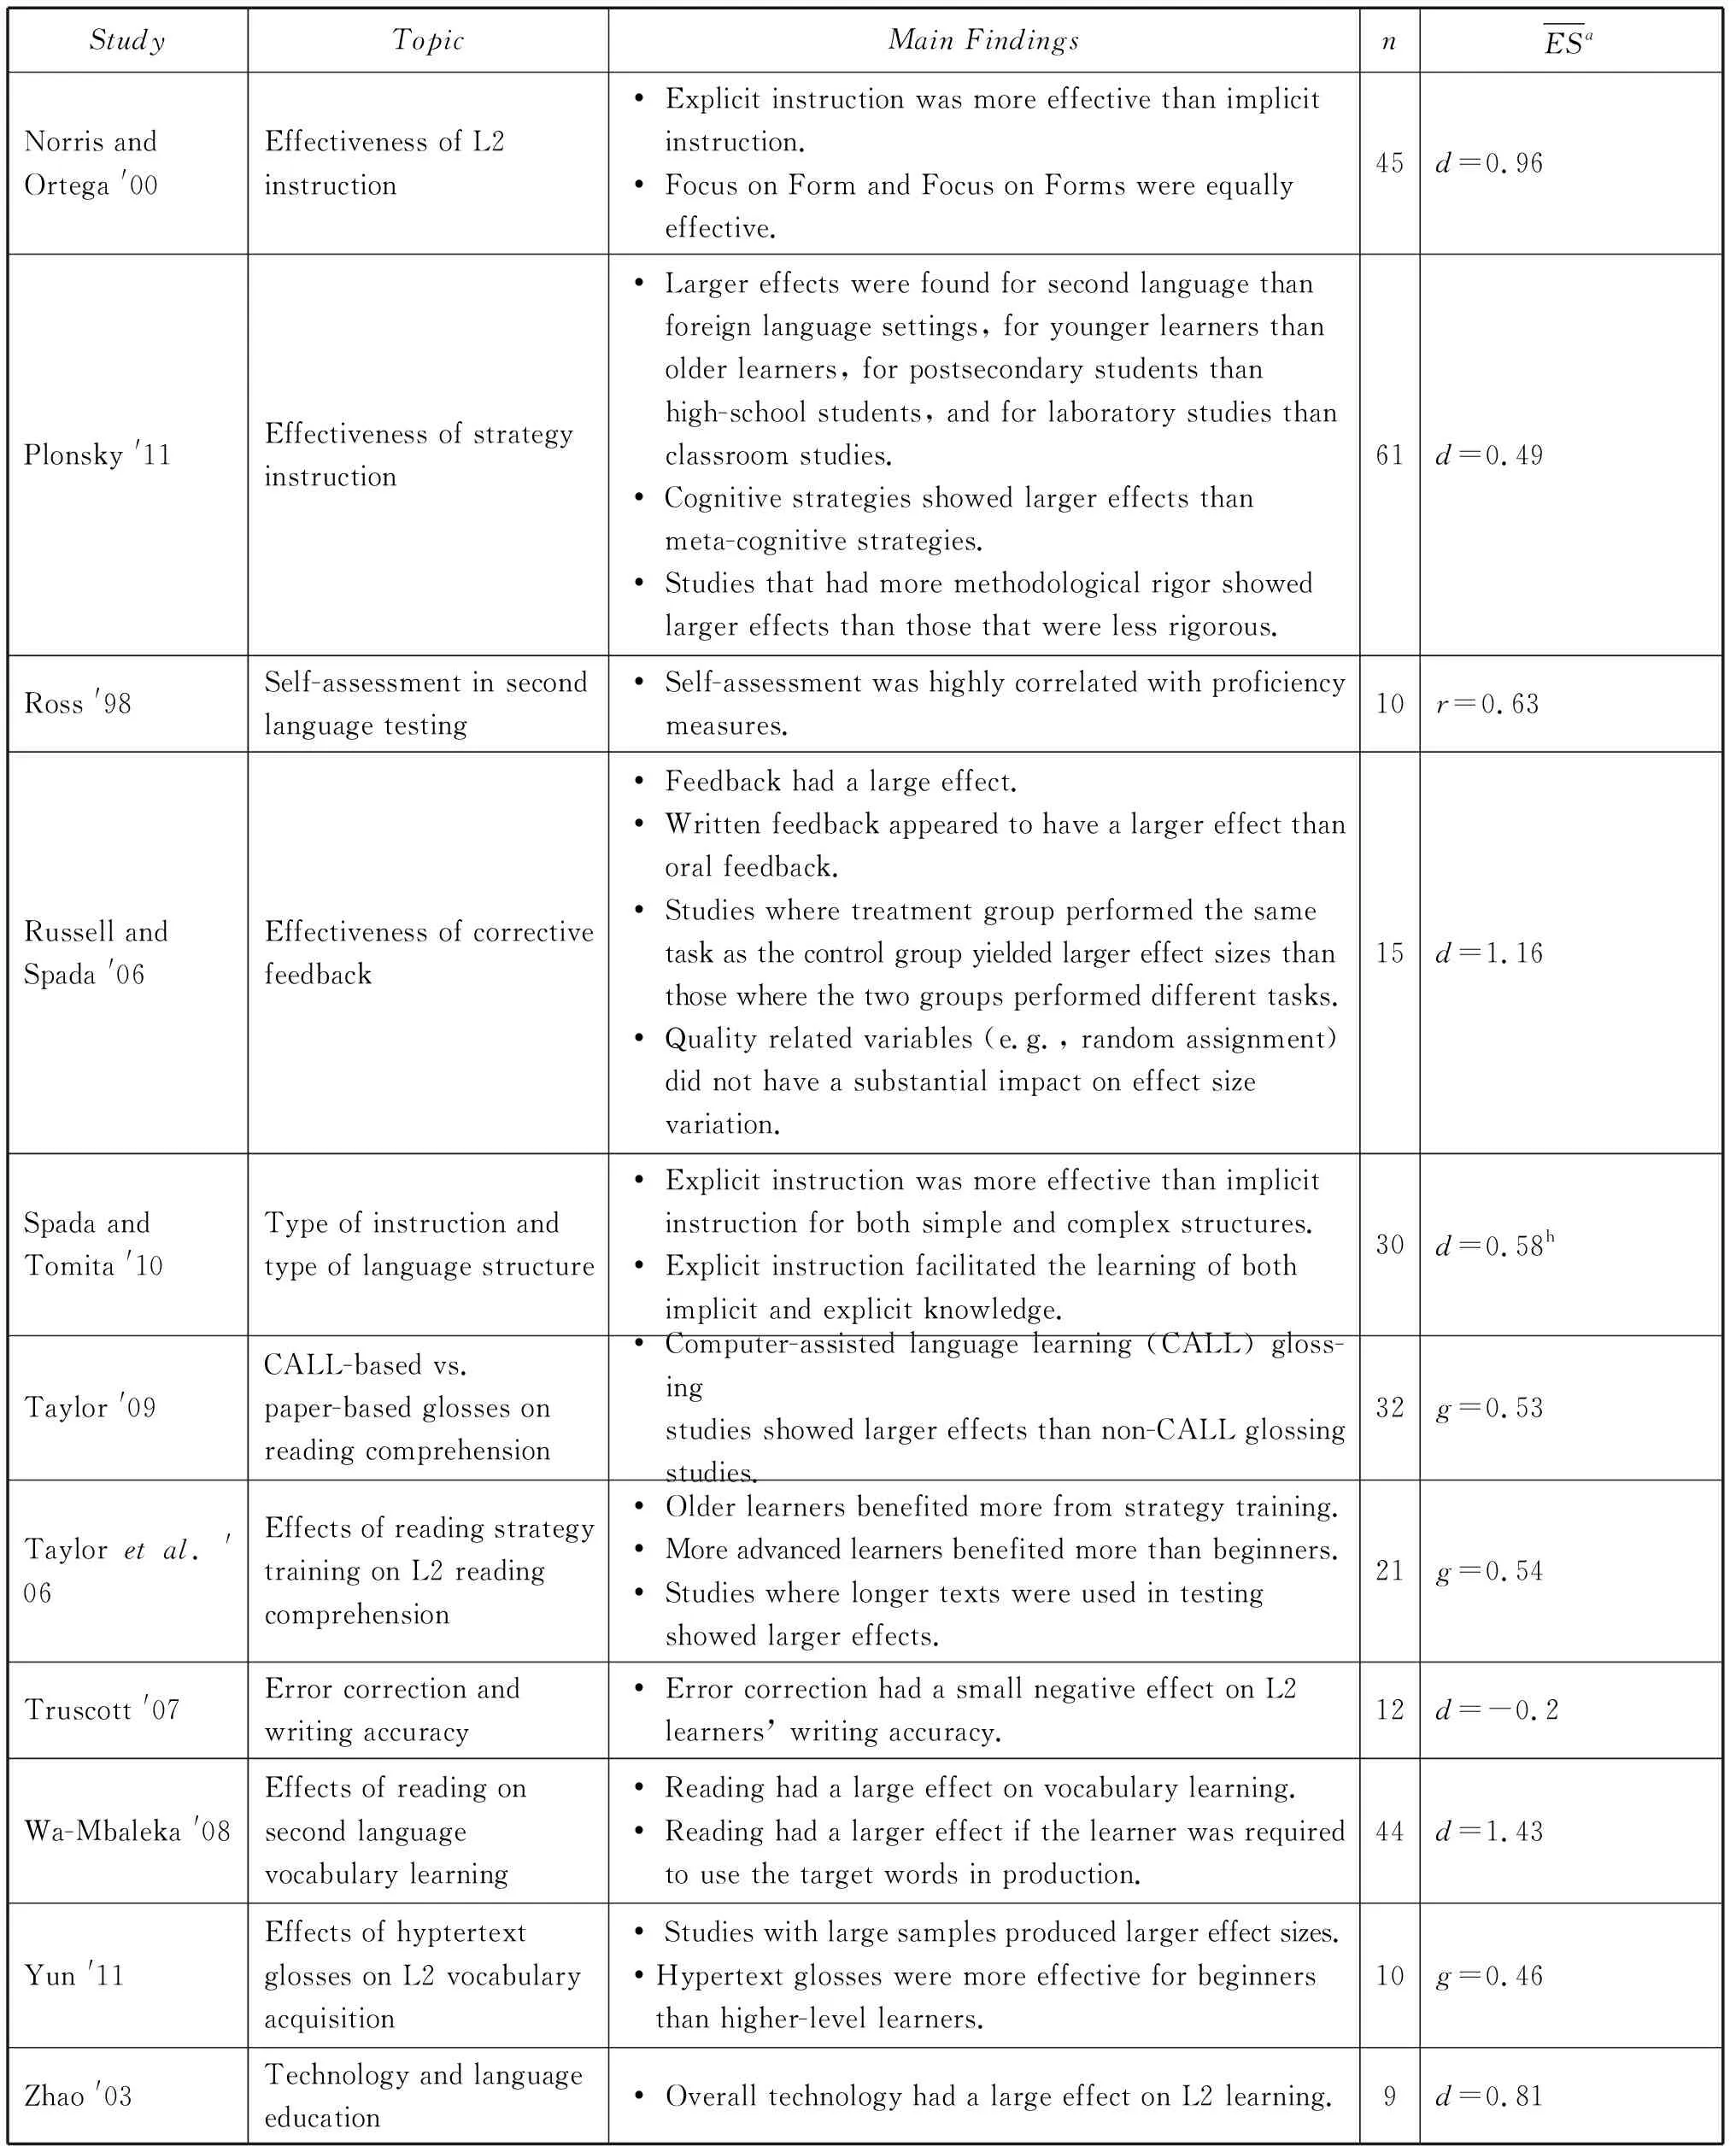
The history of meta-analysis in SLA can be traced to Ross (1998), who aggregated 60 correlation coefficients generated by 10 studies on the relationships between measures of self-assessment and other measures of proficiency. However, it is Norris and Ortega’s (2000) comprehensive synthesis of the research on L2 instruction that sparked a sweeping interest in meta-analysis in the field. This milestone article provided detailed, systematic information on meta-analysis and to some extent set the standards for subsequent meta-analyses. In 2006, the two authors edited a volume of synthetic reviews including five meta-analyses, which generated more momentum for the growth of meta-analytic reviews. To date, 22 meta-analyses have been published in SLA, out of which nine relate to different aspects of form-focused instruction (Kecketal. 2006; Lee and Huang 2008; Li 2010; Lyster and Saito 2010; Mackey and Goo 2007; Norris and Ortega 2000; Russell and Spada 2006; Spada and Tomita 2010; Truscott 2007), four concern computer-assisted language learning (Abraham 2008; Taylor 2009; Yun 2011; Zhao 2003), two pertain to strategy training (Plonsky 2011; Tayloretal. 2006), two have to do with testing (Ross 1998; In’nami and Koizumi 2009), and the rest investigated other aspects of L2 learning. (See Appendix for a list of SLA meta-analyses, the topic of each synthesis, the main findings, the sample size, and the type and magnitude of the overall mean effect size).
DOING META-ANALYSIS
As stated previously, similar to an empirical study, a meta-analysis entails formulating a research problem, collecting and analyzing the data, and reporting and interpreting the results. Despite the fact that meta-analysts in general comply with recommended norms and standards, there exists a high degree of methodological inconsistency among them (Dieckmannetal. 2009; Shercliffeetal. 2009). Methodological issues related to meta-analysis are more disconcerting than those of primary research because of its potentially larger impact on researchers, practitioners, and policy makers. In the following section, choices at each step of meta-analysis will be explicated, and related issues will be spelt out and discussed. SLA meta-analyses will be used for purposes of illustration and exemplification.
Formulating the research problem
As with primary research, the first step of a meta-analysis involves identifying a problem of interest and defining the research domain. Cooper (2007) suggested that at this stage the meta-analyst should (1) provide a clear conceptual and operational definition for the variables under investigation, (2) state the type of relationship, and (3) contextualize the problem theoretically, practically, and historically. A conceptual definition concerns the construct that underlies the collection of empirical studies and that draws the boundary between relevant and irrelevant events. For instance, a meta-analysis on the effectiveness of corrective feedback necessitates a definition of “corrective feedback” and “effectiveness”. Defining corrective feedback as responses to L2 learners’ erroneous production precludes positive feedback and comprehension errors; defining effectiveness as learners’ interlanguage development necessarily obviates other measures of instructional success such as learners’ responses to a questionnaire or impressionistic observations such as learners’ engagement in classroom discourse. In addition to a conceptual definition, an operational definition is necessary that provides a description of the characteristics of observable events that represent the construct such as the different types of corrective feedback that occur in L2 classrooms.
The second and third points are equally important. The relationship of interest has to do with the research design of the studies to be synthesized, that is, whether it is causal, correlational, or probabilistic. For instance, Lee and Huang’s meta-analysis (2008) addressed a causal relationship in that it investigated how input enhancement affected L2 grammar learning. Masgoret and Gardner’s meta-analysis (2003) is correlational in nature because it is a synthesis of research investigating the relationships between motivation/attitudes and L2 learning. The third point concerns the contextualization of a research problem, which according to Cooper (2007), serves two purposes: justifying the need for the synthesis and the search for moderating variables. An illustrative example is Shintani, Li, and Ellis’s meta-analysis of the comparative effectiveness of comprehension-based instruction and production-based instruction (2013), where the researchers provided a succinct account of the theoretical and practical issues relating to the topic which led to the formulation of the research questions and justified the choice of the moderator variables.
While meta-analysis has mostly been utilized to answer research questions and variables that were directly investigated in the primary studies, an innovative way to take advantage of this synthetic approach is to examine variables that relate to methodological features that are characteristic of primary studies but that primary researchers did not investigate as independent variables. Two examples of such meta-analyses are Spada and Tomita (2010), who looked at the interactions between instruction type and structural complexity, and Goldschneider and DeKeyser (2005), who investigated the factors contributing to the natural order of morpheme acquisition. Spada and Tomita coded the instructional treatments as implicit and explicit and the grammatical features as simple and complex by applying a set of criteria they developed. Similarly, Goldschneider and DeKeyser created a coding scheme to describe a list of grammatical functors on five dimensions which served as predictors in a multiple regression analysis for the L2 learners’ accuracy in using the functors. However, the research questions in both meta-analyses were not what the primary researchers sought to answer. As will be pointed out later, this type of so-called synthesis-generated evidence should be interpreted with caution.
One criticism levelled at meta-analysis is the tendency to aggregate results relating to conceptually different constructs; this is the classic “apples and oranges” problem (e.g. Littelletal. 2008; Norris and Ortega 2006). A counter argument from meta-analysts is that construct validity is not violated if one is interested in “fruit”, not apples or oranges separately. In other words, conceptual comparability is better taken as relative rather than absolute. However, to build on this argument, a salutary perspective is that construct validity does pose a problem if one looks at apples or oranges but makes claims about fruit. What this boils down to in meta-analytic practice is that it is important to (1) clearly define the construct and delineate the scope of interest, and (2) avoid generalizing the findings beyond the defined scope of the meta-analysis. For instance, it would be inappropriate to make claims about the effectiveness of corrective feedback (oral and written) in general if only oral feedback is investigated unless there is theoretical justification for claiming that the working mechanisms of the two types of feedback are identical.
Finding and selecting studies
After deciding on a research domain, the next step is to locate the studies to be synthesized. Common strategies of literature search include ancestry chasing (tracing the references in primary research), computer search (using electronic databases, academic journals, and search engines such as Google), browsing (books and journals on library shelves), consultation (communication with experts in the field), and correspondence (e.g. emailing authors to retrieve unpublished studies). In SLA meta-analyses, the most frequently searched databases are ERIC and LLBA, and the journals that meta-analysts consulted the most includeLanguageLearning,StudiesinSecondLanguageAcquisition,TESOLQuarterly,AppliedLinguistics,TheModernLanguageJournal, andSecondLanguageResearch. Furthermore, general textbooks (e.g. Ellis 2008; Gass and Mackey 2012; Hinkel 2011; Doughty and Long 2003) and review articles (narrative reviews as well as meta-analyses) are also valuable sources of reference.

Table 1: Some inclusion/exclusion criteria in SLA meta-analyses
When conducting literature search, the meta-analyst must have clear inclusion/exclusion criteria, which may relate to relevance, participants (e.g. young or adult learners), time frame, research design (e.g. whether to include studies without control groups), language of publication, outcome measure, availability of data for effect size calculation, and source (e.g. published or unpublished; journal articles or book chapters). There are no universal guidelines as to what to include or exclude, but it is a must to unequivocally state the criteria and to justify them where necessary. Some examples of inclusion/exclusion criteria in SLA meta-analyses appear in Table 1.
There are two controversial issues relating to study selection. One concerns whether to include unpublished studies, and another is whether to exclude poorly conducted studies. Many meta-analysts argued that excluding unpublished research would lead to publication bias, which refers to the tendency to publish (or submit for publication) studies that report statistically significant results; studies that failed to obtain significant results are perhaps tucked away in researchers’ file cabinets, hence the so-called “file-drawer” problem (Field and Gillett 2010; Hunter and Schmidt 2004; Rosenthal 1984). Coursol and Wagner (1986) reported that studies with positive results were seven times more likely to be published than studies with non-significant results. Lipsey and Wilson (1993) found that in 92 synthetic reviews, effect sizes extracted from unpublished studies were one-third smaller than those from published studies. Nevertheless, many meta-analysts have been inclined not to include unpublished studies, and the commonly used criteria to exclude them include retrieval difficulties, inconsistent findings, different foci, and low quality (Shercliffeetal. 2009). Among the 22 published SLA meta-analyses, seven included unpublished studies. Among those which did not include unpublished studies, three explained the rationale behind their decision (Kecketal. 2006; Russell and Spada 2006; Wa-Mbaleka 2008). Kecketal.(2006) explained that unpublished studies were excluded to make it easier to compare their meta-analytic results with those of narrative reviews, which also did not include unpublished studies; Russell and Spada stated that including unpublished studies would make it difficult to replicate their meta-analysis; Wa-Mbaleka expressed a concern about the quality of unpublished studies such as dissertations.
Several strategies have been proposed to address publication bias (Boreinsteinetal. 2009). One is to create a funnel plot that visually displays the distribution of effect sizes against a measure of precision (sample size, standard error, or inverse of the standard error). In the absence of publication bias, the effect sizes would be evenly distributed around the mean effect size, with small-sample studies (which provide less precise estimates of the population effect) at the bottom and large-sample studies at the apex. The resulting shape resembles an inverted funnel, hence the term funnel plot. If availability bias is present, small-sample studies are concentrated on the right side of the mean, which indicate that small-scale studies with greater sampling error and smaller effect sizes are underrepresented in the dataset. Figure 1 displays a funnel plot from Li (2010), which shows a slight publication bias because at the bottom of the plot, there are more data points on the right side of the mean effect size than on the left. A second strategy, which is complementary to the first, is to perform a trim-and-fill analysis where imaginary data points are created on the left side of the mean that mirror the extreme values on the right. An adjusted mean effect size is then calculated to show how the estimated population effect would change if the missing values are added. A third way to deal with publication bias is to calculate a fail-safe N statistic that represents the number of unpublished studies with statistically non-significant effects required to nullify the mean effect size. A large fail-safe N suggests a robust study in that a large number of non-significant studies are needed to invalidate the current results. Among the 22 published SLA meta-analyses, only four dealt with publication bias using at least one of the three methods.
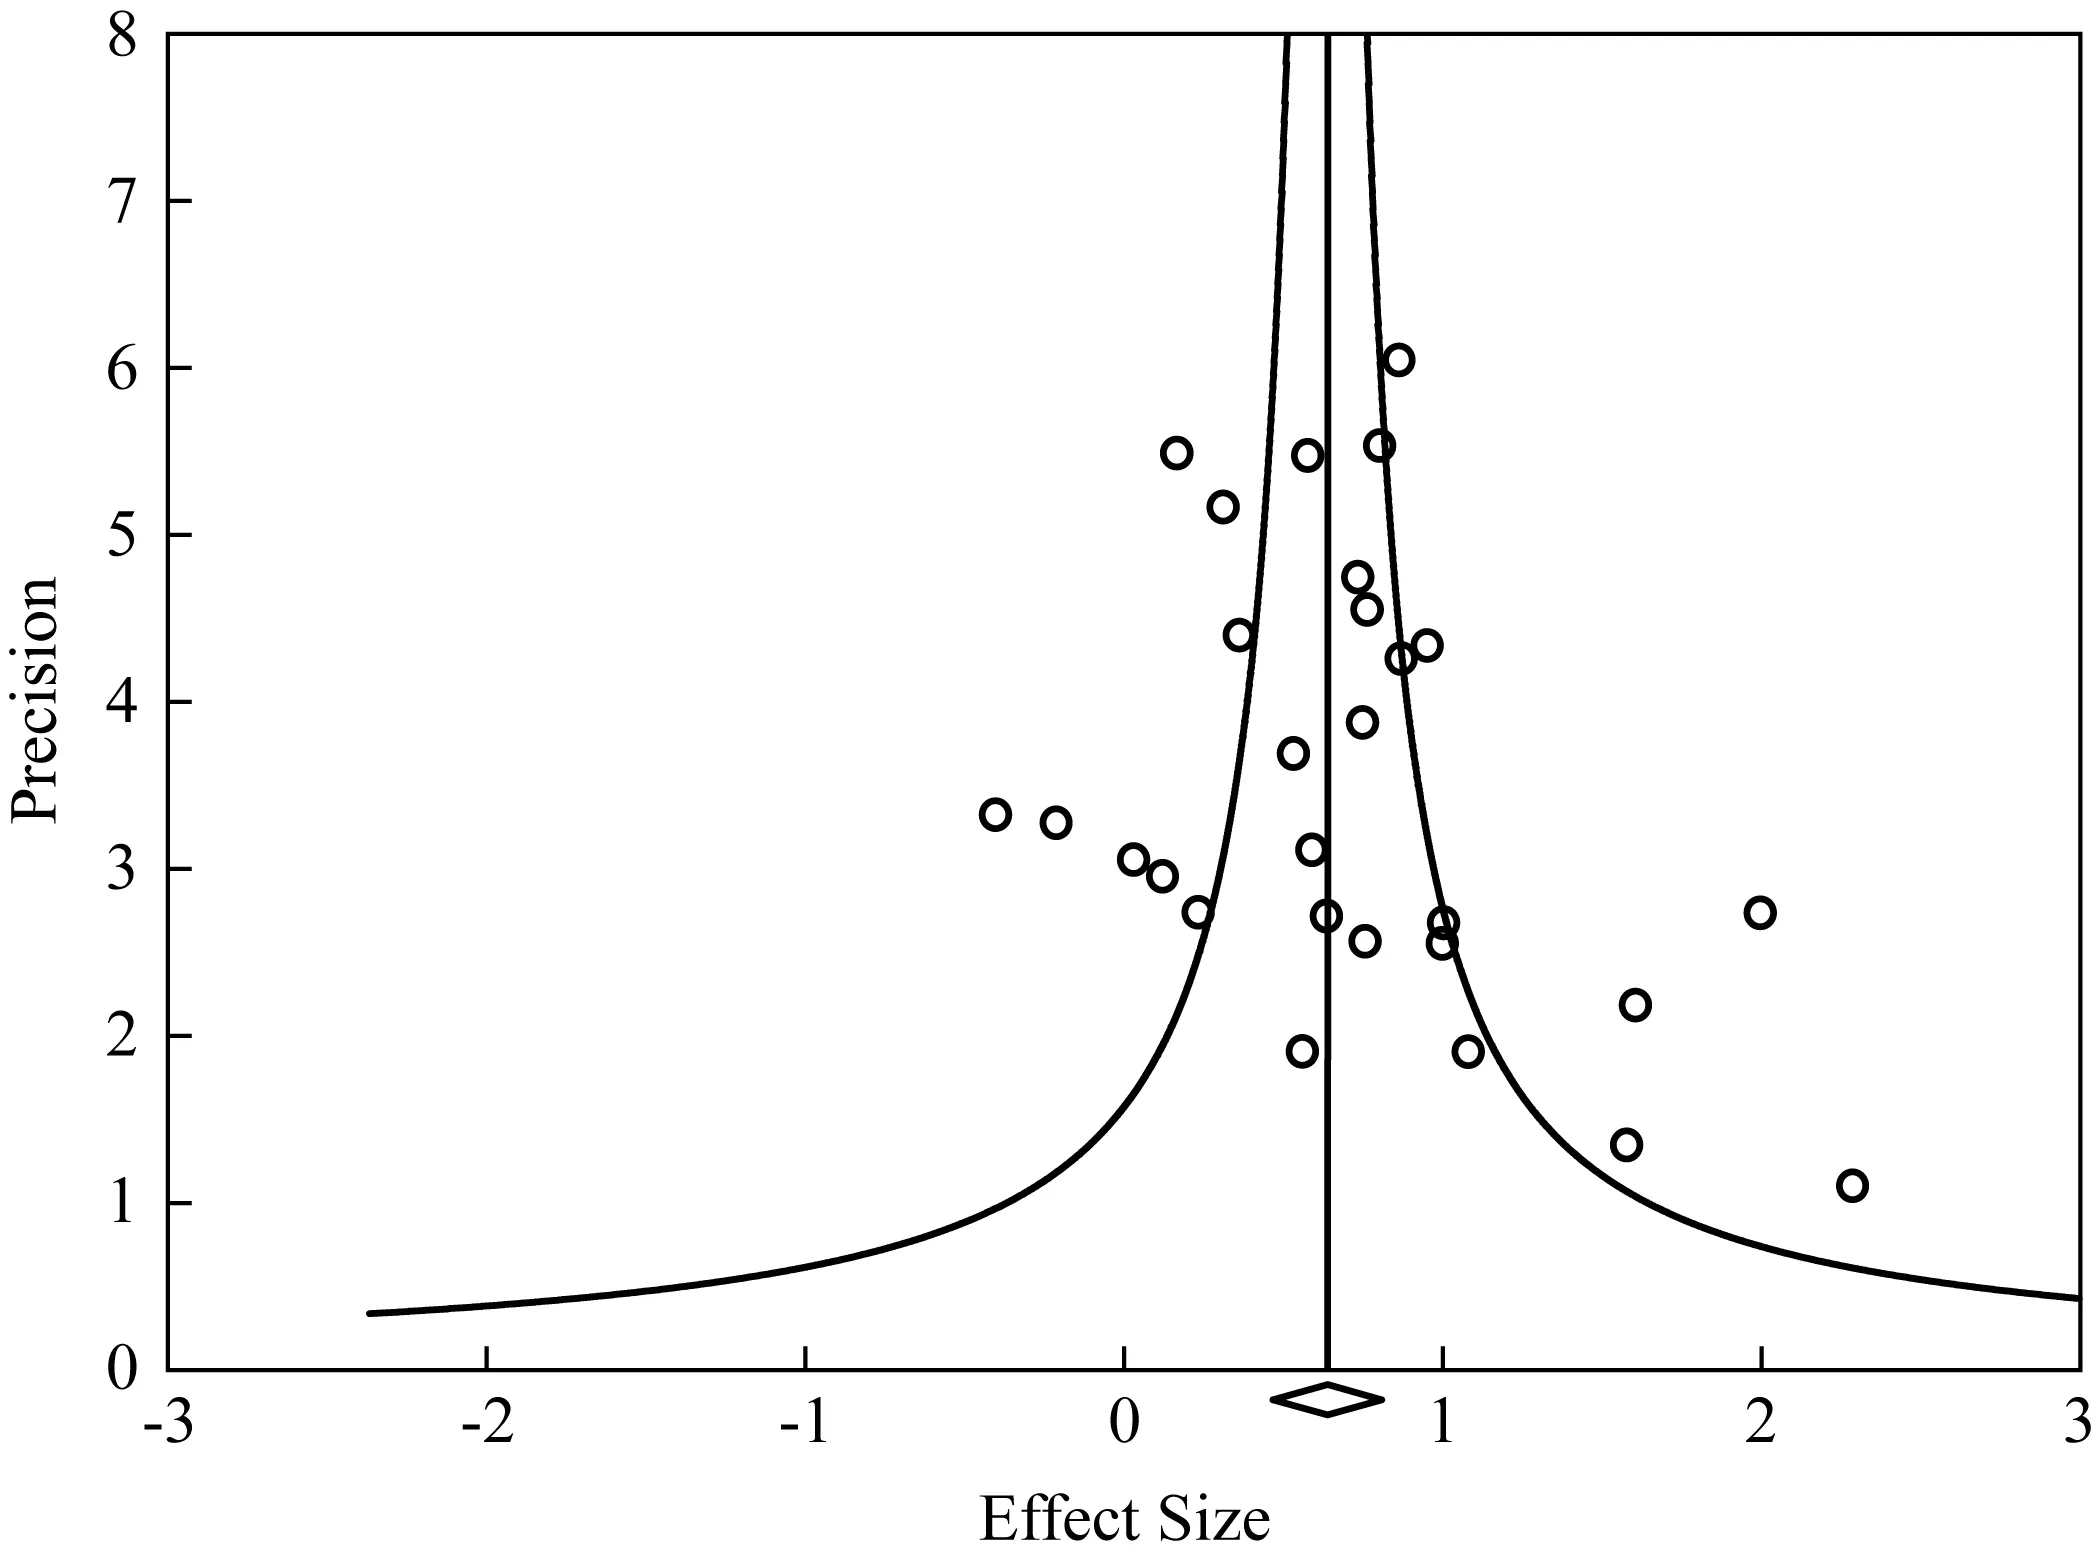
Figure 1: A funnel plot
Another controversial issue is whether to screen studies based on their methodological rigor. It is argued that results based on poorly designed studies are unreliable and should therefore be excluded; this is often described metaphorically as the “garbage in, garbage out” problem. Plonsky (2011) found that study quality did contribute to effect size variation: Studies that reported random group assignment, pretesting, and reliability showed larger effect sizes than those that did not. In a similar vein, Russell and Spada (2006) considered the impact of some methodological features such as prior equivalence of treatment groups (pretesting), random group assignment, and reliability and validity of outcome measures. They found that the studies that reported reliability and validity showed more modest effects than those that did not (or those that were less stringent)—a pattern that is different from Plonsky’s finding; other features did not have a substantial impact.
The above two studies have the following implications. First, one way to address study quality, instead of filtering out “poor quality” studies, is to show whether certain study characteristics cause effect size variation. Second, study quality may not be as straightforward as it appears. As Lipsey and Wilson pointed out, except for “a few agreed upon cannons (such as valid measures, random assignment, etc.)” (2001: 22), there is no consensus as to how to accurately measure study quality. Some experts of meta-analysis even argued that instead of yielding more robust results, including a quality component may add bias (Ahn and Becker 2011). Thus, to take study quality into consideration, a meta-analyst would need to adopt a reliable appraisal scheme or employ empirically and/or theoretically justified evaluation criteria (Petticrew and Roberts 2006; Valentine and Cooper 2008).
Coding the data
The coding stage starts with the extracting of effect sizes from the included studies. As a basic unit of analysis, an effect size is a standardized numeric index of the magnitude of an effect or relationship. Since it is standardized, results from different primary studies become comparable regardless of the variation in how their data were analyzed and presented. There are three basic types of effect size:d,r, andOR(odds ratio).dis an index representing standardized mean difference such as that between an experimental group and a control group,ris simply a correlation coefficient, and odds ratio signifies the probability of the occurrence of an event in one condition as compared with another (such as the probability of the occurrence of uptake after recasts vs. prompts). Meta-analytic procedures are yet to be developed for results pertaining to multiple regression, factor analysis, and structural equation modelling analysis (Littelletal. 2008), although it would seem likely to convert the regression coefficient tod(and tor) as statistically the regression coefficient is equivalent to mean difference in ANOVA (Field 2005). Effect sizes such as correlation coefficients are available in included studies, and if they are not, as is often the case withd, the raw data (means and standard deviations) provided in the primary research should be used to calculate effect sizes.
In SLA, 19 of the 22 published meta-analyses were based ondand three usedr(Goldschneider and DeKeyser’s meta-analysis was based on bothrandR2). The pattern is in stark contrast with the predominant use ofrin meta-analytic studies in the fields of psychology and management (90% usedrand only 10% usedd; reported in Aguinisetal. 2011). The preponderance ofdin SLA meta-analyses reflects the current trend in this research domain: gleaning evidence for causal relationships between constructs or the effectiveness of instructional intervention; correlational designs that are favoured in psychological research are not the norm in SLA research, althoughris statistically more robust thand(Rosenthal 1991).
Given the prevalence ofdin SLA meta-analyses, it would seem necessary to provide further explanation about how it is calculated. As previously explained,drepresents the standardized mean difference between two groups and is typically derived from experimental studies that involve variable manipulation and that investigate causal relationships. It is based on the following formula:
where mean difference refers to the difference between the mean of the experiment group and that of the control or comparison group in independent-sample designs (where there are no pretest scores), or between the mean change score of the experiment group and that of the control/comparison group (in cases where pre-post/within-group changes are also measured). The pooled standard deviation is calculated based on the standard deviations of the experimental and control/comparison means or the standard deviations of the posttest scores of the two groups. The pooled standard deviation (Sp) is given as:
whereneandncare the sample sizes of the two groups (experiment and control), andseandscare the standard deviations. Handbooks of meta-analyses (e.g. Borensteinetal. 2009; Cooper 2010; Lipsey and Wilson 2001) are available for further information on effect size calculation including obtaining advalue based ontorFvalues and formulas pertaining to the conversion betweendandr. (Useful information and tools for effect size calculation are available at http:∥mason.gmu.edu/~dwilsonb/ma.html).
Evidently, advalue, which represents a standardized mean difference, is calculated based on data relating to two groups, an experimental (or treatment) group and a comparison or control group that provides baseline data. While it is crucial to ensure consistency in the implementation of the experimental treatment across primary studies, of equal importance is selecting the appropriate comparison group that is operationalized similarly in the included studies. If the basis for comparison varies, the generated effect sizes and aggregated results cannot be interpreted meaningfully. By way of illustration, Shintanietal. (2013) meta-analyzed studies that investigated the effectiveness of comprehension-based and production-based instruction. They only included studies that included both instruction types and excluded those that examined either instruction type separately because the comparison groups in them were hardly comparable. Therefore the meta-analysts only calculated comparative effect sizes, which reflect the effects of the two types of instruction in relation to each other. Consequently, not only could the results be meaningfully interpreted, but also there was less statistical error in comparison with results based on two separate sets of effect sizes associated with each instruction type and their respective comparison groups.
While the coding of the dependent variable, which is invariably the effect size, is relatively straightforward, many judgment calls are involved in coding independent variables. First, it is important to distinguish between independent and moderator variables. Independent variables are examined in primary studies and should be coded intact, such as recasts, metalinguistic feedback, etc. in a meta-analysis of corrective feedback studies (Li 2010). Further independent variables can be generated by recoding the study-contributed variables to test theories of interest (e.g. coding different types of instruction into implicit and explicit to investigate their comparative effectiveness (Norris and Ortega 2000). However, caution must be exercised when categorizing primary studies given the typical heterogeneity observed in SLA research in construct operationalization. For instance, an instruction type can be quite explicit in certain studies even though it is claimed or intended to be implicit. While there is no remedy for methodological inconsistency in primary research, it is crucial for meta-analysts to clearly state their coding criteria and justify their decisions.
Moderator variables are methodological features or what Lipsey and Wilson (2001) called study descriptors that potentially mediate effect size variation such as participant characteristics, outcome measure, study quality, year of publication, etc. However, methodological features are not necessarily moderators, and the meta-analyst would need to explicate the rationale for examining the impact of certain features as mediating variables. In SLA, the most commonly investigated moderators include learners’ individual differences in age and proficiency, test format, nature of the linguistic target (grammar vs. lexis), treatment length, durability of effects (immediate and delayed), research setting (laboratory vs. classroom), research context (foreign language vs. second language), and factors affecting study quality (sample size, random group assignment, and test validity and reliability). These factors are believed to affect L2 learners’ interlanguage development or the effect of instructional treatments.
However, as Cooper (2010) rightly pointed out, a distinction must be made between study-generated results, which relate to the independent variables manipulated in individual studies, and synthesis-generated results, which are based on methodological features that are not investigated as independent variables in primary studies. Causal relationships cannot be claimed for moderating variables because other variables are not controlled. Synthesis-generated evidence should be taken as an indication that effect size variation is associated with the variables in question, and it can also be used to identify areas in need of further investigation. Thus, for instance, Lyster and Saito’s finding (2010) that younger learners benefited more from corrective feedback than older learners should not be taken as a conclusive claim for a significant age effect. To verify such a claim, studies are needed where learners in two treatment conditions differ only in age and all other variables (type of feedback provided, proficiency, target structure, instructor, etc.) are held constant. To date, no such studies have been conducted.
Given the onerous, complicated nature of meta-analysis, it is important to ensure coding reliability. One type of coding reliability concerns the consistency and accuracy of a single coder, which may be called intra-coder reliability. This is achieved by performing multiple rounds of coding. Another type of coding reliability is called inter-coder reliability, which involves two or more coders and which is indexed by agreement rate or Cohen’s kappa. Agreement rate is calculated by dividing the number of codes the two coders agree on by the total number of codes; agreement rate can be accompanied by Cohen’s kappa, which is statistically more robust because it takes into account chance agreement. Discrepancies should be resolved through discussions between the two coders. Finally, special attention should be given to the coding of high-inference variables that involve interpreting and decision-making on the coder’s part. Among the 22 published SLA meta-analyses, 12 reported at least one type of inter-coder reliability. As Oswald and Plonsky (2010) also noted, there is a clear need for future meta-analysts to use multiple coders and report inter-coder reliability.
Analyzing the data
Most meta-analyses follow a two-step procedure: effect size aggregation—averaging the whole set of effect sizes to provide a holistic view of the overall effect or relationship, followed by moderator analysis to detect mediating variables. Prior to aggregating the results, effect sizes should be weighted such that studies with larger sample sizes, because they are more precise estimates of the population effect, carry more weight. A study weight is the inverse of its variance:
wherevstands for the variance of the estimate and is calculated as follows (Hedges and Olkin 1985):
wheren1andn2are group sizes anddis the effect size. The weighted mean effect size is calculated as follows (Shadish and Haddock 1994):
which is the sum of each effect size multiplied by its weight divided by the sum of the weights. Dieckmannetal. (2009) reported that 71 out of the 100 meta-analyses they assessed did some weighting, and a few used study quality scores as weights, which, as discussed earlier, may incur additional concerns. In SLA, 14 out of the 22 published meta-analyses used weighted effect sizes.
To test the statistical significance of the mean effect size, a z test can be conducted as (Borensteinetal. 2009):
wheredmis the weighted mean effect size andSEmis the standard error of the mean effect size. The standard error is given as:
which is the square root of the inverse of the sum of the weights of individual studies. The obtainedzcan then be compared with criticalzvalues to determine the statistical significance of the mean effect size. Thus, if the z value exceeds 1.96 (absolute value, be it positive or negative), the mean effect size is statistically significant at α= 0.05; if it is beyond 2.58, it is significant at α=0.01.
Another important statistic in meta-analysis, which complementspvalues (or significance/ztests) but has a slightly different focus, is the confidence interval (CI). The confidence interval provides information about the precision of an estimate by delineating a scope in which the population effect may vary. For example, a 95% confidence interval of 0.23 and 0.45 indicates that there is a 95% probability that the true effect is between the two values, or that the probability that the effect is outside this range is less than 5%. A narrow interval indicates a robust finding, and an interval that crosses zero means that the population effect could be zero, or that the null hypothesis that there is no effect in the population cannot be rejected. If a confidence interval includes zero, the correspondingpvalue for the z test is necessarily above 0.05 (or 0.01, depending on the alpha level). The 95% confidence interval for a mean effect size, which has an upper and lower limit, is calculated as:
wheredmis the mean effect size andSEmis the standard error of the mean effect size (formula provided above).
One issue facing meta-analysts is how to deal with more than one effect size from one study. Effect sizes from the same study are based on the same sample and are therefore related to each other. Allowing individual studies to contribute more than one effect size would lead to an inflated sample size, nonindependence of data points, and distortion of standard error estimates, which “can render the statistical results highly suspect” (Lipsey and Wilson 2001:105). The suggested solution is usually to randomly pick one or take the average, but both have its limitations. Where more than one effect size is available, it is difficult to determine which is more representative of the construct under investigation; between-group differences would be lost if they are simply averaged. A compromise, which can minimize sample size inflation but at the same time retain as much data as possible for analysis, involves a “shifting unit of analysis” (Cooper 2010). In this method, effect sizes from each individual study are averaged during the aggregation stage where the purpose is to investigate the overall effect or relationship. However, when moderator analysis is performed, only effect sizes within each category of a moderator are averaged. For instance, in Li’s meta-analysis of corrective feedback studies, Ellisetal.’s study (2006) contributed several effect sizes relating to different feedback types (implicit and explicit feedback) and outcome measures (implicit and explicit knowledge). The effect sizes were averaged when the overall effect of feedback was calculated. However, in the subsequent moderator analysis on the differential effects of implicit and explicit feedback, the effect sizes were averaged for the two types of feedback separately so that the study contributed one effect size in each of the two categories of the moderator. In the case of SLA meta-analyses, only half mentioned how non-independence of data points was addressed although it is a source of statistical error.
Another pitfall in meta-analysis is the presence of outliers, which are extreme values that are “unrepsentative of the results...and possibly even spurious” (Lipsey and Wilson 2001: 107). For example, Li (2010) found that the overall mean effect size for corrective feedback was reduced by over 0.2 standard deviation units after outliers were removed. To detect outliers, one may convert the set of effect sizes in question tozscores (standardized scores with a mean of 0 and standard deviation 1; a z score is calculated by subtracting each value from the mean divided by the standard deviation of all scores), and any absolute score over 2 (or 3 depending on how conservative one intends to be) is considered an outlier. Alternatively, one can perform a sensitivity analysis to determine the impact of each value on the overall estimate. Furthermore, it is always helpful to have a visual display of the set of values such as by creating a scatter plot to identify values that are discrepant from the rest of the data. Once detected, an outlier can be removed or adjusted by recoding it into the next closest value, and this method is called Winsorizing. Winsorizing can be repeated until no outliers remain. One point to recognize is that outliers are contingent, that is, outliers in one set of effect sizes may not be extreme values in another set. It is therefore necessary to search for outliers in each analysis, be it effect size aggregation or moderator analysis. Despite the obvious influence of outliers, only in four SLA meta-analyses was the issue addressed or mentioned in discussing the results.
Given the typical methodological heterogeneity of primary research in social studies, it is important to examine the variability of effect size distribution. In addition to reporting at least one descriptive measure of dispersion such as standard error or standard deviation, a standard procedure is to conduct a homogeneity test, which is calledQtest (referred to asQwwhere the subscript stands for “within-group”), to determine if the included studies share a common population effect or whether effect size variation is only caused by sampling error. A significantQwvalue (p<.05) means that the null hypothesis that the distribution of the effect sizes around the mean is caused by sampling error alone is rejected; simply put, it means that the effect sizes are not homogeneous.Qwis calculated as follows (Lipsey and Wilson 2001: 115):
which is the sum of the product of each effect size weight and the difference between the effect size and the mean effect size. If theQvalue is larger than the critical value (a chi-square table is available in Lipsey and Wilson (2001) or other standard statistics books) for a chi-square withk-1 degrees of freedom (krepresents the number of effect sizes), then the distribution is heterogeneous.
The results of homogeneity tests relate to model selection in meta-analysis. There are two models of meta-analysis—fixed-effects and random-effects models. Fixed-effects models are based on the assumption that the included studies estimate a common population effect and any between-study variability is attributable to sampling errors. Random-effects models assume that the population mean varies from study to study, and that there are two sources of error: within-study and between-study variability. Experts of meta-analysis (e.g. Borensteinetal. 2009; Hufetal. 2011; Hunter and Schmidt 2004) have argued that random-effects models are more appropriate in most situations because (1) there is always some substantive and/or methodological variation between primary studies, and (2) fixed-effects models generate misleading narrow confidence intervals and cause inflated Type I errors (Field and Gillett 2010; Schmidtetal. 2009). Fixed-effects models are appropriate if (1) the included studies are identical, and (2) if the purpose is to calculate the effect relating to a particular population, not to generalize to other populations (Berkeljon and Baldwin 2009). However, primary studies are often not identical and most meta-analysts are not content with confining their results to the included samples.
Model selection can be based on the results of homogeneity tests, that is, a random-effects model can be used in the case of a significantQw. However, it has been argued that the statistical power of homogeneity tests is low (that is, failing to detect heterogeneity when it is actually present), especially when the sample size is small (e.g. Hufetal. 2011). Therefore, a model should be selected a priori based on the meta-analyst’s understanding about the data and knowledge about the related research. Aguinisetal. (2011) synthesized 196 meta-analyses in psychology and management and found that the majority (87.5%) used random-effects models and only a small percentage used fixed-effects models (7.3%). With regard to SLA meta-analyses, three used random-effects model, one reported results based on both models, and the remaining 18 did not mention which model was followed. However, Oswald and Plonsky (2010) contended that the choice of model was not an important issue as it does not cause substantial changes in the results.
SometimesQwis also used to determine whether to perform a moderator analysis. The rationale is that in the case of a heterogeneous distribution, there are likely underlying variables such as methodological variation leading to systematic variability of the effect sizes, hence a need to identify the moderators. However, it has been argued that significantQwstatistics should not be considered prerequisites for subsequent moderator analysis because of its low statistical power (Dieckmannetal. 2009; Oswald and Plonsky 2010). Rather, as with model selection, it should be based on a priori assumptions and observations about the data. Therefore, the recommendation is that moderator analysis be performed regardless of whether theQwvalue is statistically significant (Crossetal. 2011; Rosenthal and DiMatteo 2001).
Moderator analysis is conducted by means of analog to ANOVA (Lipsey and Wilson 2001) if the variable is categorical, such as linguistic target (grammar vs. lexis in Kecketal. 2006), research context (lab vs. classroom in Mackey and Goo 2007), interlocutor type (computer vs. native speaker vs. teacher in Li 2010); continuous moderators can be subjected to meta-regression analysis (which is similar to multiple regression analysis). The analog to ANOVA is conducted and interpreted similarly to a one-way ANOVA and the calculated between-groupQstatistic (Qb, with b in the subscript representing “between-group”), which is similar to F in ANOVA, is used to determine if there exist significant group differences. A significantQbindicates that the moderator has a significant impact on the variation of the set of effect sizes in question. Post hoc pair-wiseQbtests (similar tottests) can be conducted in the case of a moderator analysis that involves more than two groups. The calculation ofQbis based on the following formula (Lipsey and Wilson 2001: 121):
wherewgis the sum of the weights within each group anddmis the mean effect size of each group.
In SLA meta-analyses, confidence intervals have also been used for moderator analysis. However, while it is true that the absence of an overlap between the confidence intervals of two mean effect sizes indicates a significant between-group difference, the reverse is not true, that is, the presence of an overlap does not suggest a lack of significant difference (Cumming 2012; Oswald and Plonsky 2010). The confidence interval is an index of the precision of estimation and is not intended as an inferential statistic for significance testing. Cumming provided some useful rules of thumb with regard to the relationships between confidence intervals and null hypothesis significance testing using thepvalue:
(1) If there is no overlap between two confidence intervals, thenp<0.01;
(2) If two intervals barely touch end-to-end but do not overlap, then p≈0.01;
(3) If there is a moderate overlap, which is about half of the average of the overlapping arms, then p≈0.05.
Althoughpvalues and confidence intervals perform different functions, it is always informative to report both together with effect sizes.
Reporting and interpreting the results
In principle, a meta-analytic report resembles the standard report of a primary study, although what is included in each section of a meta-analytic report is unique to this particular academic genre. However, as with the inconsistency in conducting a meta-analysis because of the different methodological decisions, meta-analyses also suffer from inconsistent and insufficient reporting (Dieckmannetal. 2009). Although what is reported is partly constrained by methodological decisions, it is transparent reporting that methodologists attach importance to. In other words, if it is premature for meta-analysts to follow identical procedures, some of which are still under controversy (e.g. how to calculate quality scores), it is important to explicitly report “what was done” and explain why a decision deviated from common practice or expert recommendations.
A meta-analytic report starts with an introduction that contextualizes the study by explaining the theoretical and practical significance of the research topic, defining the construct and scope, identifying the controversies surrounding the topic, and discussing the rationale for the independent and moderating variables to be investigated (see the section “Formulating the research problem” for further information in this regard). The introduction should be distinguished from the literature review section of a primary study because a meta-analysis is a synthesis of previous literature in its own right. However, this is not to dismiss the importance of detailed accounts of individual studies; rather, methodological details and findings of included studies are to be presented as results and integrated in subsequent sections.
The next two sections are the method and result sections, where transparent reporting is of particular relevance. The method section provides details about how the meta-analysis is carried out and should address questions relating to the following aspects (Cooper 2010; Dieckmannetal. 2009):
• Literature search—search strategies, method of retrieval, etc.
• Inclusion/exclusion criteria—whether unpublished studies are included, etc.
• Coding procedures—number of coders, coding reliability, and coding protocol
• Statistical procedures—model selection (fixed-effects vs. random-effects), weighting, non-independence of data points, dealing with outliers, etc.
The results section should include at least the following: (1) a detailed list of the included studies including their methodological information and effect sizes, (2)CI,p, standard error/standard deviation for all effect sizes and analyses, (3) results of publication bias analysis, (4) a measure of homogeneity (e.g.,Qw), and (5) results pertaining to overall effects/relationships and moderator analysis (Qb).
Isomorphic with a primary study, in the discussion section a meta-analyst seeks to interpret the results in relation to theories, the methodological features of primary studies, and findings of other syntheses or narrative reviews. Also, given the synthetic nature of meta-analysis, the meta-analyst may provide a comprehensive, retrospective appraisal of the status quo of the research domain in relation to the methodological strengths and weaknesses of the extant studies, which in turn serves the function of formulating hypotheses to be tested and gaps to be filled in future empirical investigation.
Finally, an explanation of the benchmarks used to interpret the magnitude of an effect size is in order. Cohen (1988) provided a set of standards for the three most common effect size typesd,r, and odds ratio (Table 2), which have been widely used in social sciences. However, it has been argued that Cohen’s reference criteria are somewhat arbitrary and the magnitude of an effect size should be contextualized in the specific research domain where the meta-analysis is carried out (Field and Gillett 2010; Littelletal. 2008). Oswald and Plonsky (2010: 99) found that the average of the mean effect sizes of SLA meta-analyses was 0.68 (CI=0.53, 0.83) for experiment-control comparisons and 1.95 (CI=0.65, 1.25) for pretest-posttest gains. Based on this, the authors recommended as a set of “SLA standards for effect sizes” that 0.4 be considered a small effect, 0.7 medium, and 1.0 a large effect. Nevertheless, the authors warned that these were not intended to be a set of “golden” rules; rather it was hoped that the recommended standards would prompt further discussion and thoughts on what constitutes appropriate norms in this field.

Table 2: Cohen’s benchmarks for ef fect size interpretation
CONCLUSION
Since its inception in the 1970s, meta-analysis has gained wide recognition in different disciplines including SLA. The popularity of meta-analysis is testified by the fact that meta-analytic studies are among the most cited in their respective fields (Hufetal. 2011; Aguinisetal. 2011). In comparison with other methods of synthesis such as narrative review, vote-counting (counting the number of significant and non-significant findings), and the cumulation ofpvalue method (averaging thepvalues reported in primary research), meta-analysis has the following strengths. First, it follows a set of well-developed, systematic statistical procedures and therefore adds scientific rigor to research synthesis. The narrative review method, in contrast, relies heavily on the authoritative expertise of the synthesizer, which is “always vested and hence vulnerable to the charge of bias” (Norris and Ortega 2007: 806). Furthermore, whereas meta-analysis can handle a large amount of data, narrative reviews typically synthesize a small number of studies because of the heavy “information-processing burden” they impose on reviewers (Hunter and Schmidt 2004: 463). Second, using a standardized numeric index of effect size, meta-analysis can demonstrate the magnitude of an effect or relationship, thus overcoming the dichotomizingpvalue in null hypothesis significance testing, which is essential in the vote-counting and cumulation ofpvalue methods. Significance testing is sensitive to sample size—while a significantpvalue may represent a large effect, it may also indicate a small effect based on a large sample; by the same token, a non-significantpmay reflect a small effect but it may also reflect a large effect based on a small sample (Borensteinetal. 2009). Third, meta-analysis can not only be used to synthesize previous research findings, it can also generate new knowledge by testing theories using data contributed by primary research as in Goldschneidar and DeKeyser (2005) and Spada and Tomita (2010). Fourth, because of the robustness of meta-analytic findings, they can be relied on in guiding the decisions of policy makers and practioners.
Meta-analysis has also been criticized on a number of grounds such as the tendency to synthesize results relating to conceptually different constructs (“comparing oranges and apples”), the likelihood of generalizing misleading results based on poorly conducted studies (“garbage in, garbage out”), methodological uncertainty and inconsistency resulting from the availability of multiple options at each step, and the technical skills and expertise required to conduct a meta-analysis. Also, Norris and Ortega (2006) pointed out that premature meta-analysis based on insufficient primary research may yield misleading findings. This is especially worrying in SLA because of the typical small sample size of the meta-analyses in our field, the average number of included studies being 22.9, which contrasts starkly with the average sample size (n=118.5) of the meta-analyses in psychology and management synthesized in Dieckmannetal. (2009). Insufficient primary studies also severely undermine the credibility of the results of moderator analysis. Littelletal. (2008) recommended that at least 10 studies should be included in a moderator analysis using theQbtest, but some SLA meta-analyses have failed to meet this criterion.
This introductory paper has provided a succinct account of the basic steps of a meta-analysis as well as the choices, standards, and norms at each step. Where relevant, SLA meta-analyses were used to illustrate the principles and procedures, and discrepancies between SLA meta-analyses and common practice were spelt out. The contribution of SLA meta-analyses to the field is beyond question, but future meta-analysts should strive for more methodological rigor, be more aligned with the norms and recommended procedures, and justify and report their methodological choices. It is also hoped that consumers of meta-analysis in this field such as L2 researchers and educators can benefit from this paper in arriving at more precise understanding of meta-analytic results.
APPENDIX: LIST OF META-ANALYTIC STUDIES IN SLA
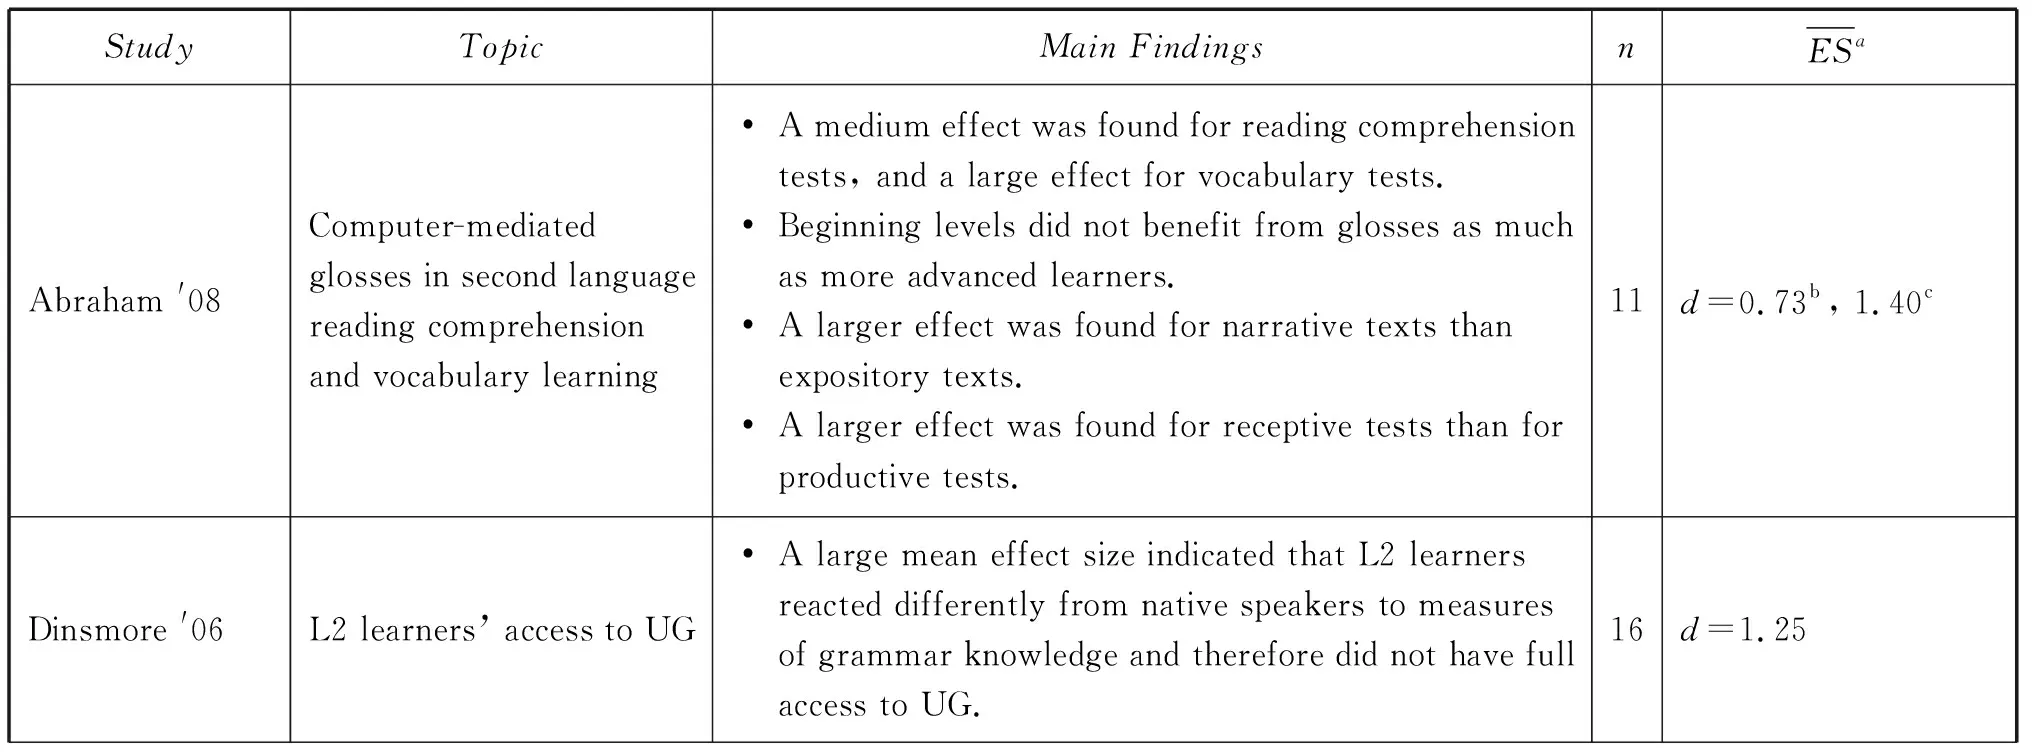
StudyTopicMain FindingsnESaAbraham '08Computer-mediatedglosses in second languagereading comprehensionand vocabulary learning• A medium effect was found for reading comprehensiontests, and a large effect for vocabulary tests.• Beginning levels did not benefit from glosses as muchas more advanced learners.• A larger effect was found for narrative texts thanexpository texts.• A larger effect was found for receptive tests than forproductive tests.11d=0.73b, 1.40cDinsmore '06L2 learners’ access to UG• A large mean effect size indicated that L2 learnersreacted differently from native speakers to measuresof grammar knowledge and therefore did not have fullaccess to UG.16d=1.25
(Continued)
(Continued)
Notes:

b. Effect size for reading comprehension measures
c. Effect size for vocabulary measures
d. Range of correlation coefficients for the relationships between the functors and accuracy scores
e. Percentage of variance explained by the five functors
f. Hedges’s g, which is similar to Cohen’s d, estimate of standardized mean differences
g. Range of coefficients for the relationships between motivation and attitudes and measures of L2 achievements
h. Mean effect size for all instructions types
REFERENCES
Abraham, L. B. 2008. ‘Computer-mediated glosses in second language reading comprehension and vocabulary learning: A meta-analysis,’ComputerAssistedLanguageLearning21: 199-226.
Aguinis, H., D. Dalton, F. Bosco, C. Pierce, and C. Dalton. 2011. ‘Meta-analytic choices and judgment calls: implications for theory building and tesing, obtained effect sizes, and scholarly impact,’JournalofManagement37: 5-38.
Ahn, S. and B. Becker. 2011. ‘Incorporating quality scores in meta-analysis,’JournalofEducationalandBehavioralStatistics36: 555-85.
Berkeljon, A. and S. Baldwin. 2009. ‘An introduction to meta-analysis for psychotherapy outcome research,’PsychotherapyResearchMethods19: 511-18.
Borenstein, M., L. V. Hedges, J. P. T. Higgins, and H. R. Rothstein. 2006.ComprehensiveMeta-Analysis(Version 2.2.027) [Computer software]. Englewood, NJ: Biostat.
Borenstein, M., L. V. Hedges, J. P. T. Higgins, and H. R. Rothstein. 2009.IntroductiontoMeta-Analysis. Chichester, UK: John Wiley & Sons.
Cohen, J. 1988.StatisticalPowerAnalysisfortheBehavioralSciences(2nd edn). Hillsdale, NJ: Lawrence Erlbaum.
Cooper, H. 2007. ‘Evaluating and inerpreting research synthesis in adult larning and literacy,’ NCSALL Occasional Paper.
Cooper, H. 2010.ResearchSynthesisandMeta-Analysis:AStep-by-StepApproach. Los Angeles: Sage.
Cooper, H., L. Hedges, and J. Valentine. 2009.TheHandbookofResearchSynthesisandMeta-Analysis(2nd edn). New York: Russell Sage Foundation.
Coursol, A. and E. Wagner. 1986. ‘Effect of positive findings on submission and acceptance rates: A note on meta-analysis bias,’ProfessionalPsychology17: 136-37.
Cross, C., L. Copping, and A. Campbell. 2011. ‘Sex differences in impulsivity: A meta-analysis,’PsychologicalBulletin137: 97-130.
Cumming, G. 2012.UnderstandingtheNewStatistics:EffectSizes,ConfidenceIntervals,andMeta-Analysis. New York: Routledge.
Dieckmann, N., B. Malle, and T. Bodner. 2009. ‘An empirical assessment of meta-analytic practice,’ReviewofGeneralPsychology13: 101-15.
Dinsmore, T. 2006. ‘Principles, parameters, and SLA: A retrospective meta-analytic investigation into adult L2 Learners’ access to Universal Grammar’ in J. Norris and L. Ortega (eds):SynthesizingResearchonLanguageLearningandTeaching. Philadelphia: John Benjiamins, pp. 53-90.
Doughty, C. and M. Long (eds). 2003.HandbookofSecondLanguageAcquisition. Malden: Blackwell.
Ellis, R. 2008.TheStudyofSecondLanguageAcquisition. Oxford: Oxford University Press.
Ellis, R., S. Loewen, and R. Erlam. 2006. ‘Implicit and explicit corrective feedback and the acquisition of L2 grammar,’StudiesinSecondLanguageAcquisition28: 339-68.
Field, A. 2005.DiscoveringStatisticsUsingSPSS. London: Sage.
Field, A. and R. Gillett. 2010. ‘How to do a meta-analysis,’BritishJournalofMathematicalandStatisticalPsychology63: 665-94.
Gass, S. and A. Mackey (eds). 2012.HandbookofSecondLanguageAcquisition. London: Routledge.
Glass, G. 1976. ‘Primary, secondary, and meta-analysis of research,’EducationResearcher5: 3-8.
Goldschneider, J. and R. DeKeyser. 2005. ‘Explaining the “natural order of L2 morpheme acquisition” in English: A meta-analysis of multiple determinants,’LanguageLearning55 (suppl.): 27-77.
Hedges, L. and I. Olkin. 1985.StatisticalMethodsforMeta-Analysis. Orlando: Academic Press.
Hinkel, E. (ed.). 2011.HandbookofResearchinSecondLanguageTeachingandLearning. London: Routledge.
Huf, W., K. Kalcher, G. Pail, M. Friedrich, P. Filzmoser, and S. Kasper. 2011. ‘Meta-analysis: Fact or fiction? How to interpret meta-analyses,’TheWorldJournalofBiologicalPsychiatry12: 188-200.
Hunter, J. and F. Schmidt. 2004.MethodsofMeta-Analysis. London: Sage.
In’nami, Y. and R. Koizumi. 2009. ‘A meta-analysis of test format effects on reading and listening test performance: Focus on multiple-choice and open-ended formats,’LanguageTesting26: 219-44.
Jeon, E. and T. Kaya. 2006. ‘Effects of L2 instruction on interlanguage pragmatic development: A meta-analysis’ in J. Norris and L. Ortega (eds):SynthesizingResearchonLanguageLearningandTeaching. Amsterdam: Benjamins, pp. 165- 211.
Keck, C., G. Iberri-Shea, N. Tracy-Ventura, and S. Wa-Mbaleka. 2006. ‘Investigating the empirical link between task-based interaction and acquisition’ in J. Norris and L. Ortega (eds):SynthesizingResearchonLanguageLearningandTeaching. Amsterdam: Benjamins, pp. 91- 131.
Kisamore, J. and M. Brannick. 2008. ‘An illustration of hte consequencdes of meta-analysis model choice,’OrganizationalResearchMethods11: 35-53.
Lee, S.-K. and H. Huang. 2008. ‘Visual input enhancement and grammar learning: A meta-analytic review,’StudiesinSecondLanguageAcquisition30: 307-31.
Li, S. 2010. ‘The effectiveness of corrective feedback in SLA: A meta-analysis,’LanguageLearning60: 309-65.
Lipsey, M. and D. Wilson. 1993. ‘The efficacy of psychological, educational, and behavioral treatment: Confirmation from meta-analysis,’AmericanPsychologist48: 1181-209.
Lipsey, M. and D. Wilson. 2001.PracticalMeta-Analysis. Thousand Oaks, CA: Sage.
Littell, J. H., J. Corcoran, and V. Pillai. 2008.SystematicReviewsandMeta-analysis. New York: OUP.
Lyster, R. and K. Saito. 2010. ‘Oral feedback in classroom SLA: A meta-analysis,’StudiesinSecondLanguageAcquisition32: 265-302.
Mackey, A. and J. Goo. 2007. ‘Interaction research in SLA: A meta-analysis and research synthesis’ in A. Mackey (ed.):ConversationalInteractioninSLA:ACollectionofEmpiricalStudies. New York: Oxford University Press, pp. 408-52.
Masgoret, A.-M. and R. C. Gardner. 2003. ‘Attitudes, motivation, and second languag learning: A meta-analysis of studies conducted by Gardner and associates,’LanguageLearning53: 123-63.
Norris, J. M. and L. Ortega. 2000. ‘Effectiveness of L2 instruction: A research synthesis and quantitative meta-analysis,’LanguageLearning50: 417-528.
Norris, J. and L. Ortega (eds). 2006.SynthesizingResearchonLanguageLearningandTeaching. Amsterdam: Benjamins.
Norris, J. and L. Drtega. 2007. ‘The future of research synthesis in applied linguistics: Beyond art or science,’TESOLQuarterly41: 805-15.
Oswald, R. and J. Johnson. 1998. ‘On the robustness, bias, and stability of statistics from meta-analysis of correlation coefficients: Some initial Monte Carlo findings,’JournalofAppliedPsychology83: 164-78.
Oswald, F. and L. Plonsky. 2010. ‘Meta-analysis in second language research: Choices and challenges,’AnnualReviewofAppliedLinguistics30: 85-110.
Plonsky, L. 2011. ‘The effectiveness of second language strategy instruction: A meta-analysis,’LanguageLearning61: 993-1038.
Rosenthal, R. 1984.Meta-AnalyticProceduresforSocialResearch. Newbury Park, CA: Sage.
Roberts, H. and M. Petticrew. 2006.SystematicReviewsintheSocialSciences,APracticalGuide. Oxford: Blackwell.
Rosenthal, R. 1991.Meta-analyticProceduresforSocialResearch(2nd edn). Newbury Park, CA: Sage.
Rosenthal, R. and M. R. DiMatteo. 2001. ‘Meta-analysis: Recent developments in quantitative methods for literature reviews,’AnnualReviewofPsychology52: 59-82.
Ross, S. 1998. ‘Self-assessment in second language testing: A meta-analysis and analysis of experiential factors,’LanguageTesting15: 1-20.
Russell, J. and N. Spada. 2006. ‘The effectiveness of corrective feedback for second language acquisition: A meta-analysis of the research’ in J. Norris and L. Ortega (eds):SynthesizingResearchonLanguageLearningandTeaching. Amsterdam: Benjamins, pp. 131-64.
Schmidt, F., I. Oh, and T. Hayes. 2009. ‘Fixed-versus random-effects models in meta-analysis: model properties and an empirical comparison of differences in results,’BritishJournalofMathematicalandStatisticalPsychology62: 97-128.
Shadish, W. and C. Haddock. 1994. ‘Combining estimates of effect size’ in H. Cooper and L. Hedges (eds):TheHandbookofResearchSynthesis. New York: Russell Sage Foundation, pp. 261-81.
Shercliffe, R., W. Stahl, and M. Tuttle. 2009. ‘The use of meta-analysis in psychology: A superior vintage or the casting of old wine in new bottles?’Theory&Psychology19: 413-30.
Shintani, N., Li, S., and R. Ellis. 2003. ‘Comprehension-based versus production-based instruction: A meta-analysis of comparative studies,’LanguageLearning63/2.
Smith, M. and G. Glass. 1977. ‘Meta-analysis of psychotherapy outcome studies,’AmericanPsychologist32: 752-60.
Spada, N. and Y. Tomita. 2010. ‘Interactions between type of instruction and type of language feature: A meta-analysis,’LanguageLearning60: 263-308.
Taylor, A. M. 2009. ‘The effects of CALL versus traditional L1 glosses on L2 reading comprehension,’CALICOJournal23: 309-18.
Taylor, A., J. Stevens, and J. Asher. 2006. ‘The effects of explicit reading strategy training on L2 reading comprehension: A meta-analysis’ in J. Norris and L. Ortega (eds):SynthesizingResearchonLanguageLearningandTeaching. Amsterdam: Benjamins, pp. 213-44.
Truscott, J. 2007. ‘The effect of error correction on learners’ ability to write accurately,’JournalofSecondLanguageWriting16: 255-72.
Valentine, J. and H. Copper. 2008. ‘A systematic and transparent approach for assessing the methodological quality of intervention effectiveness resasrch: The study design and implementation assessment device (Study DIAD),’PsychologicalMethods13: 130-49.
Wa-Mbaleka, S. 2008.AMeta-AnalysisInvestigatingtheEffectsofReadingonSecondLanguageVocabularyLearning. Saarbrücken, Germany: VDM.
Yun, J. 2011. ‘The effects of hypertext glosses on L2 vocabulary acquisition: A meta-analysis,’ComputerAssistedLanguageLearning24: 39-58.
Zhao, Y. 2003. ‘Recent developments in technology and language learning: A literature review and meta-analysis,’CALICOJournal21: 7-27.
杂志排行

当代外语研究的其它文章
- AUTOMATICITY IN A SECOND LANGUAGE: DEFINITION, IMPORTANCE,AND ASSESSMENT
- SOURCES OF FOREIGN LANGUAGE ANXIETY: TOWARDS AFOUR-DIMENSION MODEL
- PHONOLOGICAL PERCEPTION AND PROCESSING IN A SECONDLANGUAGE
- INVESTIGATING ACCEPTABILITY OF CHINESE ENGLISH IN ACADEMICWRITING
- COMBINING COGNITIVE AND CORPUS LINGUISTIC APPROACHES IN LANGUAGE RESEARCH AND TEACHING:THEORETICAL GROUNDING,PRACTICES,AND CHALLENGES
- ON PSYCHOLINGUISTIC AND ACQUISITION STUDIES OF RELATIVE CLAUSES:AN INTERDISCIPLINARY AND CROSS-LINGUISTIC PERSPECTIVE