GRA BASED ANALYSISON FACTORSINFLUENCING CO2 EMISSIONSIN CHINA
2012-10-08DongFengLiXiaohui
Dong Feng,Li Xiaohui
(1.College of Management,China University of Mining and Technology,Xuzhou,221116,P.R.China;2.Foreign Languages College,Yantai University,Yantai,246005,P.R.China)
INTRODUCTION
In the climate congress organized by the United Nations in Copenhagen at the end of 2009,Chinese government made a solemn promise that the CO2 emissions per unit gross domestic product(GDP)in 2020 would be declined by 40%- 45% compared with that in 2005.In fact,China′s GDP has increased from 1.514 54× 1012RMB in 1980 to 2.431 617×1013RMB in 2009(converted to the price in 2000),with an average annual growth rate of 10.05%. Meanwhile,China′s CO2 emissions have jumped from 1 448.5 Mt in 1980 to 7 706.8 Mt in 2009,with an average annual growth rate of 5.93%.To accomplish the emission reduction plan,theoretical research should emphasize on how some factors influence China′s CO2 emissions.A number of academic papers have been published specifically dealing with the factors that have impacted on CO2 emissions.For instance,Ang,et al decomposed CO2 emissions generated by China′s industrial sectors into economic growth effect,produced mix effect and energy efficiency effect based on logarithmic mean Divisia index(LMDI)method[1].Cole,et al suggested that the resources could be utilized mainly in the highproduc tivity countries while environmental pollution was generally produced in the lowproductivity countries, thus total-factorproductivity growth rate was recognized as an essential factor to inhibit CO2 emissions[2].Chunbo and David analyzed the carbons intensity of China from 1980 to 2003 using LMDI model,and pointed out that the technological progress was the most important factor for carbon intensity reduction[3].Song and Lu decomposed the total CO2 emissions in China using LMDI two-stage decomposition method,and found out that the total economic output and energy efficiency were the key factors of the increase and the decrease of CO2emissions,respectively[4].Zhu,et al decomposed China′s carbon emissions(CNEs)from 1980 to 2007 using Kaya approach and drew the conclusion that the primary driving force of improving carbon emissions resulted from economic expansion[5]. Ferda and Abdul,et al suggested the factors that impacted on carbon emissions mainly involved economic output and energy consumption direction[6-7]. Zhang,et al analyzed the factors influencing carbon emission intensity in China during 1991 to 2006 by applying complete decomposition method and eventually concluded that economic growth was the most important factor determining to talcarbon-emission growth,and that the influential degree deriving from economic structure was limited in some sense[8].Li,et al focused on CNE change from 1953 to 2007,and believed it would be the only way for China to transform the present industrial structure to reduce carbon emissions in the future[9]. Gustavo studied the relationship between total carbon emissions and economic growth using 24 European countries′data from 1990 to 2006 by dynamic panel data model[10].Zhao and Long combined endogenous growth theory and carbon emission analysis to establish the influential factor model of carbon emissions.In addition,they made quantitative analysis on the factors influencing CNEs including energy consumption,total factor productivity[11].The theoretical and empirical analysis of the IPAT equation made by Chen,et al showed that driven by technological advances,the evolution of CO2 emissions over time followed the law of three ″inverted U″ curve in order, and technological advances played a fundamental role in carbon reduction[12]. Using input-output analysis, Su, et al studied the impact of international trade on energy carbon emissions by consulting data of 40 industrial sectors in China and Singapore[13].Niu,et al studied the causal relationship of carbon emissions, energy consumption and economic growth in eight Asia-Pacific countries and revealed that these variables had long-term equilibrium relationships[14].Zhang studied the impact of financial development on carbon emissions using co-integration theory,causality tests and variance decomposition method,and concluded that financial development was the main driving force to increase carbon emissions[15].Using sequence data,Song and Yi found out that foreign direct investment(FDI)had negative impact on China′s carbon dioxide emissions, which resulted from technology spillover effect of FDI[16].
In the reviewed papers, the factors influencing CO2 emissions mainly cover energy consumption, scale economy, industrial structure,FDI and total factor productivity.And most of the models primarily focused on factor decomposition and hierarchical regression,which are either limited in some sense or even likely to cause spurious regression without considering stationarity of the variables.Therefore,a grey relational analysis(GRA)method is applied for screening the most relevant variables of total CO2 emissions and then analysis on the factors influencing China′s CO2 emissions is developed.
1 VARIABLE SELECTION
1.1 Grey relational analysis method
Traditionally, statistical analysis is performed in such ways as principal component analysis,factor analysis,and variance analysis.They have the following deficiencies.(1)They areall in bad need for largeamounts of data and it is difficult to find statistical law if less or no data is available.(2)The samples must comply with the requirements of a fixed probability distribution,meanwhile the involved independent variables and dependent variable should have linear correlation, although the independent variables show no linear correlation.(3)The results of the quantitative analysis and qualitative analysis are likely to be inconsistent with each other, which leads to distortion of the relationship and even the system law.GRA can effectively make up these deficiencies,and it is widely applicable,regardless of whether the number of samples is large enough,whether the sample is regular,or whether the results of quantitative analysis and qualitative analysis match.The calculation method has absolute grey correlation, relative grey correlation and comprehensive grey correlation. The associated relationship between China′s CO2 emissions and each influential variable is calculated by means of comprehensive grey correlation.
The steps of conducting comprehensive grey correlation method are as follows.
(1)Determine the behavior sequence of the system characteristics and the sequence of the related factors.
In current studies,the system sequence is a dependent variable,China′s CO2 emissions.And the sequence of related factors is the independent variables related to China′s CO2 emissions,according to domestic and foreign research.The system sequence and the sequence of related factors are expressed as

(2)Set
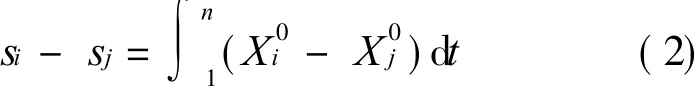
(3)Calculate the absolute grey correlation of X0and Xi

(4)Set sequences X 0 and Xi the same length.The initial value is not equal to zero.X′0 and X′i are the initial value images of X 0 and Xi,respectively.The absolute grey correlation of X′0and X′i is called the relative grey correlation of X 0 and Xi and denoted by r 0i.
(5) Set sequences X0and Xithe same length.The initial value is not equal to zero.X0i and r0i are respectively the absolute grey correlation and the relative grey correlation of X0and Xi,then
d 0i= θX0i+ (1-θ)r0i θ∈ [0,1](4)where d 0i is the comprehensive grey correlation of X 0 and Xi.
1.2 Comprehensive grey correlation
According to current researches, CO2emissions are probably associated with energy consumption(EC), GDP, per-capita GDP,proportion of the secondary industry(PSI)in GDP,proportion of tertiary industry(PTI)in GDP,and degree of dependence on foreign trade(shown as FTD).Since no more variables are available in co-integration test,those influencing CO2emissions mostly are selected by means of GRA. Using grey system modeling software designed and developed by Liu Sifeng,et al in VB 6.0[17],the comprehensive grey correlation of China′s CO2 emissions and the variables in question are calculated.The data of CO2emissions are derived from official website of IEA,and others from the China′s statistical yearbooks. In addition, all data are converted into the price of 2000 and the time span is from 1980 to 2009.The calculation results are shown in Table 1.
In the co-integration test,the dependent variable refers to China′s CO2 emissions,and in-dependent variables refer to EC,PTIand FTD.

Table 1 Results of comprehensive grey correlation
2 CO-INTEGRATION TEST AND ERROR CORRECTION MODEL
2.1 Unit root test
The reason why the data concerning time sequence are not stationary lies in that China′s economy has grown rapidly and China′s energy consumption has increased dramatically.In this sense,the traditional estimation method(OLS)seems obsolete and unfit for long-term models.In order to examine characteristics of time sequence,four variables are chosen,that is CNE,EC,PTI and FTD. The unit root test of augmented Dickey-Fuller(ADF)is made on the base of the following regression equation

where T is the period,Z are the four variables,i.e.,CNE,EC,PTI and FTD.
The equation of ADF test is the restriction equation,which has no constant term and time trend term.In the ADF and co-integration tests together,the included lags are determined by Schwarz criterion(SC)order selection criteria.
In Section 2,all tests are made by means of Eviews 6.0 and the results of unit root test are illustrated in Table 2.
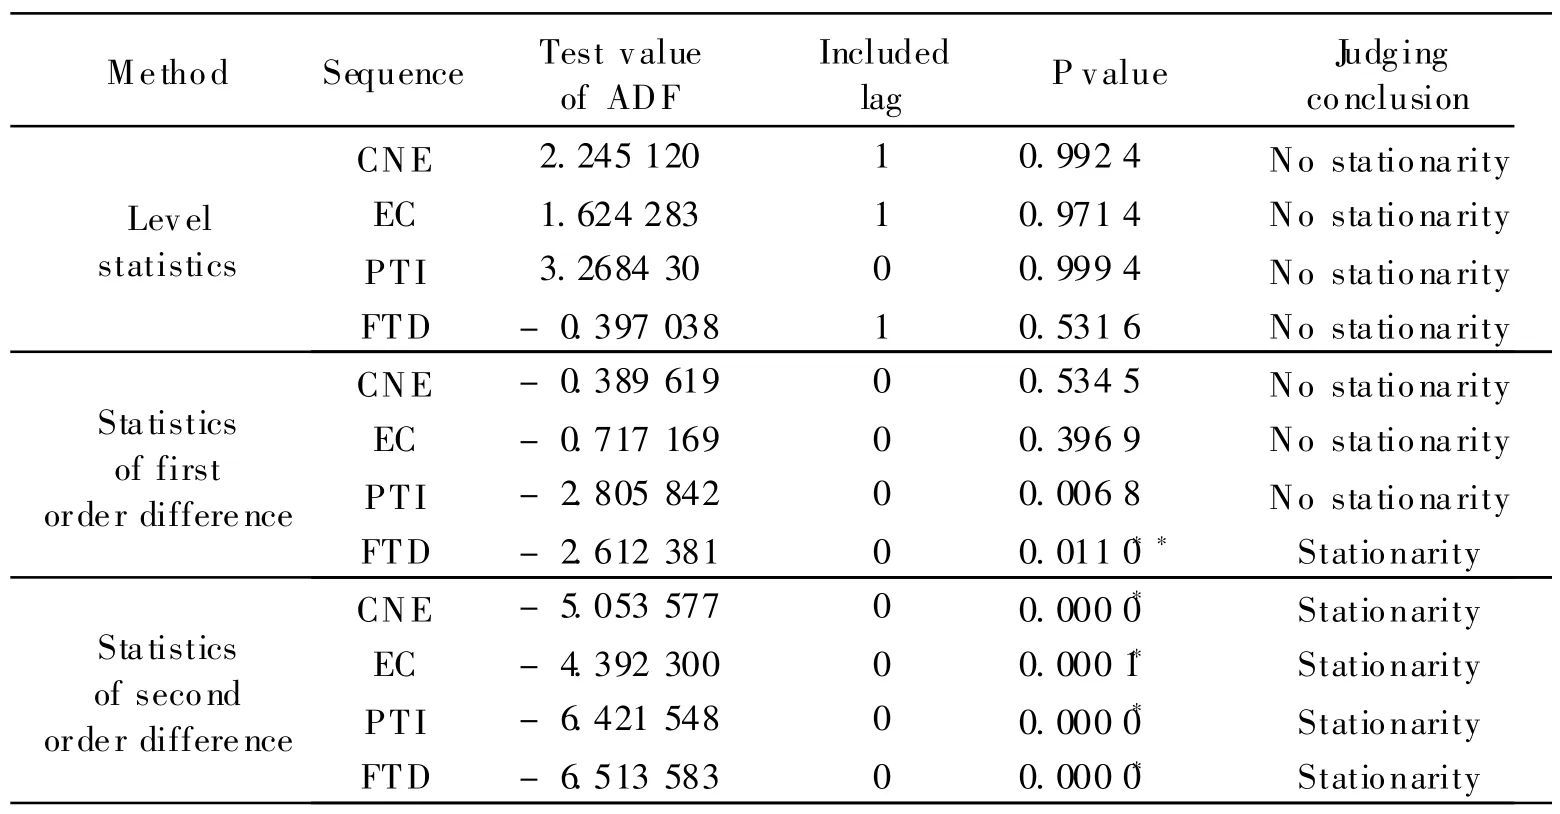
Table 2 Results of unit root test
Based on the results of the unit root test,the four variables of CNE,EC,PTI and FTD turn out to be stationary under second order difference.
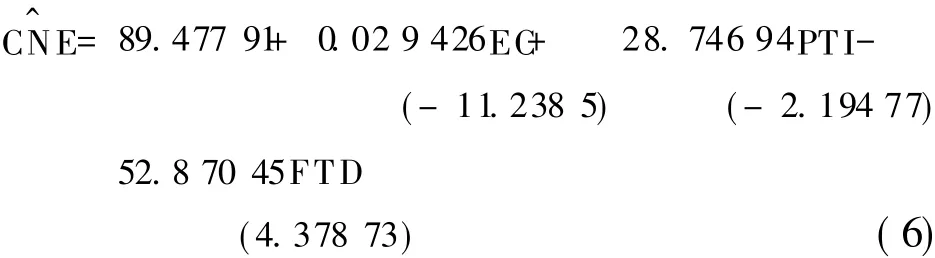
2.2 Co-integration test
Since Johasen approach is better than two step method of Engle-Granger(E-G)in terms of the co-integration test of multi-variable equation,Johasen co-integration test is selected and the lag length of vector autoregressi on model(VAR)is determined via SC information standard criteria.Accordingly,the lag length is 1 and the results of co-integration test are shown in Table 3 with time span: 1980- 2009, trend assumption:linear deterministic trend,sequence:CNE,EC,PTI,FTD,lag interval: from 1 to 1,unrestricted coin tegrati on rank test(Trace). Trace test indicates one co-integrating equation(CE)at 0.01 level.

Table 3 Results of co-integration test
Table 3 shows that the above variables have a long-term co-integration relationship in the sample ranging from 1980 to 2009. The estimation coefficient of co-integrationv ariables is
2.3 Granger causality test
Following Granger causality analysis,analytical models are established covering CNE and EC,CNE and PTI,CNE and FTD.Only the first model was seen in current study.


The null hypothesis,U i(i=1,2,…,m)=0 and U j(j=1,2,…,m)=0,is tested.The included lags are made by the SC order selection criteria.The results of Granger causality test are shown in Table 4.
The test results imply that EC is the unidi-rectional Granger causality of CNE and CNE is the unidirectional Granger causality of FTD.Besides, PTI and CNE have no Granger causality.

Table 4 Results of Granger causality test
2.4 Error correction model
The error correction model(ECM) is established in accordance with representation theorem of E-G for explaining short-term action of China′s CO2 emissions.

where ΔCNE, ΔEC, ΔPTI, ΔFTD are respectively the first order differential of CNE,EC,PTI,FTD.
The concrete result of error correction model is shown as
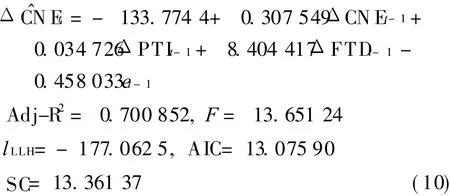
where Adj-R2is the adjusted determination coefficient, defined as the quotient of the regression sum of squares and total sum of squares,which expresses the fitting degree of regression independent variables on dependent variables,F the significance test of the regression equation to decide whether the linear relationship between dependent variables and independent variables is overall significant in the model,l LLH the value of the holistic logarithmic likelihood function.
As shown in ECM test,the value of the holistic logarithmic likelihood function is large enough as-177.062 5,and the values of AIC and SC are as small as 13.075 90 and 13.361 37 respectively.The holistic explanatory ability of this model is relatively strong.
Furthermore,four statistics are involved to verify the prediction effect of Eq.(10)including root mean squared error(RMSE),mean absolute error(M AE), mean absolute percent error(M APE),and The il inequality coefficient(TIC).
Assume the prediction samples as t=s,s+1,…,s+ h,the true value of CNE is yt,the predic tive value of CNEis,with the time span from 1982 to 2009.The error statistics can be performed in the following equations

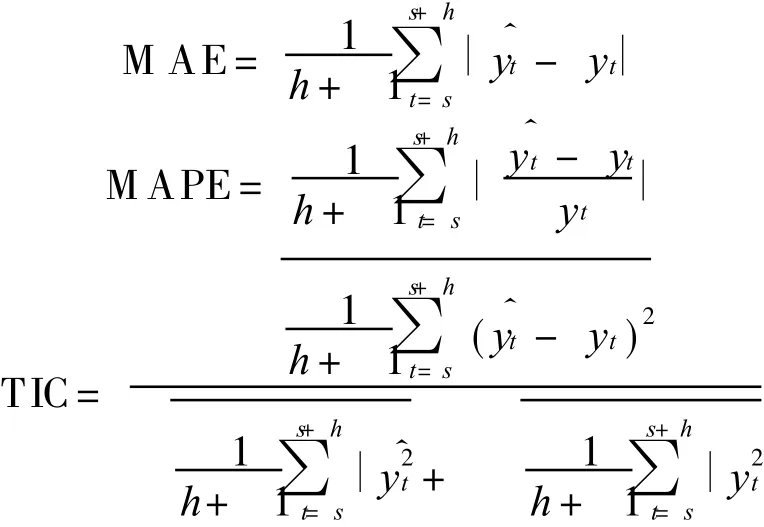
RMSEand MAEare determined by the value range of dependent variables and can be used to compare the prediction effect.The smaller the error is,the better the prediction ability is.Moreover,MAPE and TIC are the fixed values.TIC is between zero and one,and when it equals zero yt and y^tare most close to each other.The calculation shows that RMSE of the model is 134.925 59,MAEis 107.023 85,MAPEis 0.003 17,and TIC 0.018 22.Since these values are in a good range,Eq.(10)is proven to have very strong prediction ability.
According to the prediction value from the error correction model,China′s CO2 emissions from 1982 to 2009 can be obtained. The prediction value and the actual value are compared in Fig.1.
Fig.1 indicates that the prediction accuracy of the error correction model for China′s CO2 emissions is pretty satisfactory. In particular,from 2007 to 2009,the absolute errors of the prediction value and the actual value in the years are 1.40%, 2.34% and 0.39%,respectively.The error correction model helps to predict China′s CO2 emissions in the future based on variables change,such as EC and industry structure.
3 CONCLUSION
To achieve CO2 emissions reduction objective sooner is a key issue for China′s commitment to sustainable development.In this research field,factor analysis has played an important role.Based on GRA method,influential factors are determined including thee nergy consumption,the proportion of tertiary industry in GDP,and the degree of dependence on foreign trade,due to their greater grey relational degree with China′s CO2 emissions.As proved by the co-integration test,there exists a long-term co-integration relationship between China′s CO2 emissions and the three variables in question.Furthermore,the co-integration equation shows that when China′s energy consumption increases by 1 Mt standard coal,the total CO2 emissions will grow by 2.94 Mt, thus when the proportion of tertiary industry in GDP increases by 1%,the total CO2 emissions will soar by 28.75 Mt,and thus when the degree of dependence on foreign trade increases by 1%,the total CO2 emissions will reduce by 52.87 Mt.Moreover,the comparison between the forecast value and the actual value of China′s CO2emissions delivered by error correction model and the relevant statistics tests indicate that the proposed model has better explanation capabilities and credibility.
[1] Ang B W,Zhang F Q,Choi K H.Factorizing changes in energy and environmental indicators through decomposition[J].Energy,1998,23(6):489-495.
[2] Cole M A,Elliott R J R,Shimamoto K.Industrial characteristics,environmental regulation and air pollution: An analysis of the UK manufacturing sector[J]. Journal of Environment Economics and Management,2005,50(1):363-383.
[3] Ma Chunbo,Stern D I. China′s changing energy intensity trend: A decomposition analysis[J].Energy Economics,2008,30(3):1037-1053.
[4] Song Deyong, Lu Zhongbao. The factor decomposition and periodic fluctuations of carbon emission in China[J].China Population,Resources and Environment,2009,19(3):18-24.(in Chinese)
[5] Zhu Qin,Peng Xizhe,Lu Zhiming,et al.Factors decomposition and empirical analysis of variations in energy carbon emission in China[J]. Resources Science,2009,31(12):2072-2079.(in Chinese)
[6] Ferda H.An econometric study of CO2 emission,energy consumption,income and foreign trade in Turkey[J].Energy Policy,2009,37(3):1156-1164.
[7] Abdul J,Syed F M.Environment Kuznets curvefor CO2emission:A cointegration analysis for China[J].Energy Policy,2009,37(12):5167-5172.
[8] Zhang Ming,Mu Hailin,Ning Yadong.Accounting for energy-related CO2emission in China,1991—2006[J].Energy Policy,2009,37(3):767-773.
[9] Li Yanmei, Zhang Lei, Cheng Xiaoling. A decomposition model and reduction approaches for carbon dioxide emission in China[J]. Resources Science,2010,32(2):218-222.(in Chinese)
[10]Gustavo A M.Greenhouse gases emission,growth and the energy mix in Europe[J]. Energy Economics,2010,32(6):1356-1363.
[11]Zhao Xin, Long Ruyin. The status and decomposition model of carbon emissions for Jiangsu province[J]. China Population, Resources and Environment,2010,20(7):25-30.(in Chinese)
[12]Chen Shaofeng,Liu Yang,Zou Xiuping,et al.A theoretical and empirical study on driving forces of carbon dioxide emissions evolution[J].Scientific Management Research,2010,28(1): 43-48.(in Chinese)
[13]Su B,Huang H C,Ang B W,et al.Input-output analysis of CO2 emissions embodied in trade:The effects of sector aggregation[J].Energy Economics,2010,32(1):166-175.
[14]Niu S W,Ding Y X,Niu Y Z,et al.Economic growth, energy conservation and emission reduction: A comparative analysis based on panel data for 8 Asian-Pacific countries[J]. Energy Policy,2010,38(4):2121-2131.
[15]Zhang Y J.The impact of financial development on carbon emissions: An empirical analysis in China[J].Energy Policy,2011,39(4):2197-2203.
[16]Song Deyong,Yi Yanchun.FDI and China′s carbon emissions[J].China Population, Resources and Environment,2011,21(1):49-52.(in Chinese)
[17]Liu Sifeng,Dang Yaoguo,Fang Zhigeng.Grey system theory and its application[M]. Beijing:Science Press,2004.(in Chinese)
杂志排行
Transactions of Nanjing University of Aeronautics and Astronautics的其它文章
- PROGRESSOF GREY SYSTEM MODELS
- NOVEL GREY DECISION MAKING MODEL AND ITSNUMERICAL SIMULATION
- MULTIVARIATE ABSOLUTE DEGREE OF GREY INCIDENCE BASED ON DISTRIBUTION CHARACTERISTICSOF POINTS
- DELAY-TIME MODEL BASED ON IMPERFECT INSPECTION OF AIRCRAFT STRUCTURE WITHIN FINITE TIME SPAN
- TASK EFFECTIVENESS EVALUATION ON ANTI-SHIP ATTACK OF FIGHTER AIRCRAFT
- GRADE-LIFE PROGNOSTIC MODEL OF AIRCRAFT ENGINE BEARING