氧化钛-氧化石墨插层结构及其光催化性能
2010-03-06贺蕴秋陈小刚胡栋虎李林江季伶俐
张 琼 贺蕴秋 陈小刚 胡栋虎 李林江 尹 婷 季伶俐
(同济大学材料科学与工程学院,上海 200092)
Titanium dioxide(TiO2)has attracted great attention as an ideal photocatalyst,due to its many merits such as high efficiency,low cost,safety,chemical stability and friendly to environment[1-3],which has been widely used in the purification of environmental air and water samples,deodorization,and antibatcterial and self-cleaning coatings[4-6].The photocatalytic activity of TiO2depends on its crystal phase,crystallite size and crystallinity.It is known that anatase-form of TiO2crystallite with small crystallite size and high crystallinity exhibits better photocatalytic property[7].The overall efficiency of photon utilization by TiO2is however limited by electron-hole recombination,photon scattering and so on[8].
In recent years,great efforts have been made to develop carbon nanotubes(CNTs)/TiO2or C60/TiO2nanocomposite[9-13].The coupling of TiO2with CNTs or C60has been shown to provide a synergistic effect which can enhance the overall efficiency of a photocatalytic process.Gao et al.[10]prepared CNTs/TiO2nanocomposite by a surfactant wrapping sol-gel method,and evaluated its activity towards the photocatalytic degradation of a model organic substance(methylene blue)in aqueous suspensions.Results show that CNTs/TiO2nanocomposite owns a twice rate enhancement with respect to TiO2alone.Oh et al.[11]synthesized two kinds of nanocarbon/TiO2composite photocatalysts,employing CNTs and C60as nanocarbon sources and titanium(IV) n-butoxide(TNB)as titanium dioxide source.CNTs/TiO2nanocomposite owns much better efficiency,because it showed homogenous distributions with only individual CNTs,covered with TiO2and without any aggregates between each other.Gao summarized several reasons for the superior photocatalytic properties of nanocarbon/TiO2composite:(I)the higher surface area of the composite providing a higher adsorption capacity of reactive species;(II)the formation of nanocarbon/TiO2heterojunctions could reduce the recombination rate of photoinduced electrons and holes;(III)the possible shift of the apparent Fermi level to more positive values of the nanocarbon/TiO2nanocomposite as compared to pure TiO2,therefore allowing the utilization of longer wavelength photons;(IV)the absorption of photons by the bare nanocarbon surface injecting electrons into the TiO2conduction band and triggering the for-mation of reacting radicals(superoxide and hydroxyl radicals).
Graphite oxide(GO)is a non-stoichiometric material in which the lamellar structure of graphite is conserved[14].It is obtained through the reaction of graphite with strong oxidants such as potassium permanganate in concentrated sulfuric acid[15].The process of strong oxidation makes many oxygen-containing groups such as carboxyl(C=O),hydroxyl(C—OH),epoxide(C—O—C) covalently attached to its layers[16].In addition,the spatial distribution of functional groups on the carbon skeleton is also different.The epoxide and hydroxyl groups are near each other, and the carboxyl is more likely to be located at the edges of graphite oxide.These oxygen-containing groups embedded in carbon sheets in GO lamellae make the interlayer distance increase from 0.335 nm of the starting graphite to 0.7-1.0 nm[17]and also enable it to exhibit rich intercalation chemistry[18].
Much interest has been focused on nano-scale materials based on layered GO and conducting polymers[19-23]since the resulting nanocomposite could possess physical properties derived synergistically from both components,such as enhancement in electrical conductivity and mechanical strength[15].Higashika et al.[22]firstly prepared aniline-GO composite,and polyaniline-GO composite was successfully synthesized by using an in-situ polymerization method.However,Bissessur et al.[15]demonstrated that polyanilines could be directly inserted into GO without preparation of precursor intercalation compounds.Thesynthetic methodology for the insertion could be extended to other conductive polymers such as polypyrrole[23].
In this study,TiO2-graphite oxide(TiO2-GO)composite has been successfully prepared at low temperature(80℃)with graphite oxide(GO)and titanium sulfate(Ti(SO4)2)as initial reactants. Plenty of oxygen-containing groups located in the interlayer of GO were consumed during the nucleation and growth of TiO2crystallites,which means GO has been partly reduced.In addition,the activity of TiO2-GO towards the photocatalytic degradation of methyl orange in aqueous suspensions is much more efficient than that of Degussa P25 powder.In the end,we also discuss the synthesis mechanism and the main reasons responsible for the superior photocatalytic properties of TiO2-GO.
1 Experimental
1.1 Materials
Reagents included concentrated sulfuric acid,lithium hydroxide,sodium hydroxide,potassium hydroxide were of analytic purity except titanium sulfate(chemical pure),purchased from Sinopharm Chemical Reagent Co.,Ltd.(SCRC)and without further purification before utilization.High purity deionized water made ourselves was used as solvent.GO was prepared by modified Hummer method,the previous work carried out by our group[24].P25 powders were purchased from Evonik Degussa.
1.2 Preparation of TiO2-GO
4.8 g Ti(SO4)2was added into 180 mL of 1.25 mol·L-1H2SO4solution to reach a Ti(SO4)2acid solution.
GO was exfoliated by two methods.First one,exfoliating GO by H2O,a colloidal solution of GO was obtained by mixing 10 mL GO with 10 mL H2O and sonicating for 30 min.Second one was specialized by exfoliating GO by different alkalies. Like-wise,a colloidal solution GO was obtained by neutralizing 10 mL of GO with 10 mL of 0.2 mol·L-1alkaline solution (KOH,NaOH and LiOH)and sonicating for 30 min.
Exfoliated GO solution was added immediately into Ti(SO4)2acid solution which was preheated to 80℃in hot water bath. The resulting solution was stirred at 80℃for 2 h,and the dark precipitate of TiO2-GO was filtered out,washed with deionized water repeatedly and dried at 80℃for 12 h.
1.3 Photocatalytic experiments
The photocatalytic activity of the as-prepared samples was characterized under UV light irradiation using methyl orange (MO)as a target.The process was as following:50 mg of sample was dispersed in 50 mL of aqueous MO solution with concentration of 20 mg·L-1.Fresh air was bubbled for the purpose of stirring and oxygen supply.High pressure Hg lamp(250 W, λ≥365 nm)was used as a UV source.Suspensions were collected every 15 min to monitor the degradation of MO.The transmittance(Ti)of the centrifuged suspensions was measured at 483 nm.Absorbance(Ai)was obtained by Lambert-Beer law (Ai=2-lgTi).And then photocatalytic rate(Di)was available according the following equation:

where A0is the absorbance of MO solution at 483 nm before exposing under UV light.
1.4 Characterization
Powder X-ray diffraction(XRD)patterns were recorded on a Rigaku D/Max-rB12KW X-ray diffractometer in the diffraction angle range(2θ)from 5°to 60°at a rate of5(°)·min-1using Cu Kαradiation(λ=0.15418 nm).Fourier transform infrared(FT-IR) spectroscopy was recorded on a Bruker VECTOR22 FTIR spectrometer using KBr pellets.Chemical bonding between the functional groups and carbon atoms was confirmed by X-ray photoelectron spectroscopy(XPS,PHI 5000C ESCA System).The room temperature photoluminescence(PL)was measured by a 970CRT-luminescence spectrophotometer,using the 338 nm excitation line of a Xe lamp.The morphology of the as-prepared samples was observed using a field emission scanning electron microscope(FE-SEM,Quanta 200 FEG).
2 Results and discussion
2.1 XRD analysis
Fig.1(a-d)shows XRD data of TiO2-GO nanocomposite,in which GO as an intercalation matrix is exfoliated by different alkali or H2O.TiO2crystallites in the intercalated structure consist of mixed anatase and rutile phase,in which anatase phase shows more content.In this figure,(101),(004),(200)crystal surface diffraction peaks that marked with a square shape are assigned to anatase,and the other four characteristic diffraction peaks of (110),(101),(111),(211)which marked with a round shape are assigned to rutile phase.The average crystal size of TiO2in TiO2-GO under different conditions is about 9 nm,in which there is no recognizable difference,as shown in Table 1.Furthermore,a very slight diffraction peak at 2θ=11°belongs to (002)crystal of GO.Compared to(002)diffraction peak of GO in Fig.2(e),the diffraction peak intensity of TiO2-GO at 2θ=11° is obviously reduced,and the X ray diffraction peak of GO(100) crystal at 2θ=42°is totally disappeared.The faint diffraction peak of GO which still existed in the XRD pattern shows that asmall quantity of GO was not exfoliated thoroughly,which may not play a part in the intercalating process of TiO2-GO.Finally, compared with the products that GO exfoliated by H2O and by different alkalies,the diffraction peak of GO(002)in the former situation is much more apparent,which indicates that alkali has an ability to exfoliate GO more effectively.To conclude,these results explained that layered GO pretreated with alkaline solution had been exfoliated to a great extent,and then the nucleation and growth of TiO2crystallites took place in the lamellar structure of GO,finally formed TiO2-GO nanocomposite.

Table 1 Average crystal size of TiO2-GO and GO samples under different conditions
In addition,Fig.1(f)depicts XRD patterns of TiO2-GO nanocomposite which was stored for 8 months and reused for 3 times.The average crystal size of TiO2in TiO2-GO is 9.3 nm. Compared with Fig.1(e),no changes can be found,which confirms that the crystal structure of TiO2-GO remains stable even stored for 8 months and reused for 3 times.
2.2 FT-IR analysis
To determine functional groups existed in TiO2-GO,FT-IR spectroscopy was performed.Fig.2(A)shows FT-IR spectra of TiO2-GO samples a-d in Table 1.FT-IR spectra of GO(e)and sample b are depicted in Fig.2(B).

Fig.1 XRD patterns of TiO2-GO and GO samplesGO exfoliated by(a)0.2 mol·L-1KOH,(b)0.2 mol·L-1NaOH,(c)0.2 mol·L-1LiOH,(d)H2O;(e)GO;(f)sample b stored for 8 months,reused for 3 times; GO:graphite oxide
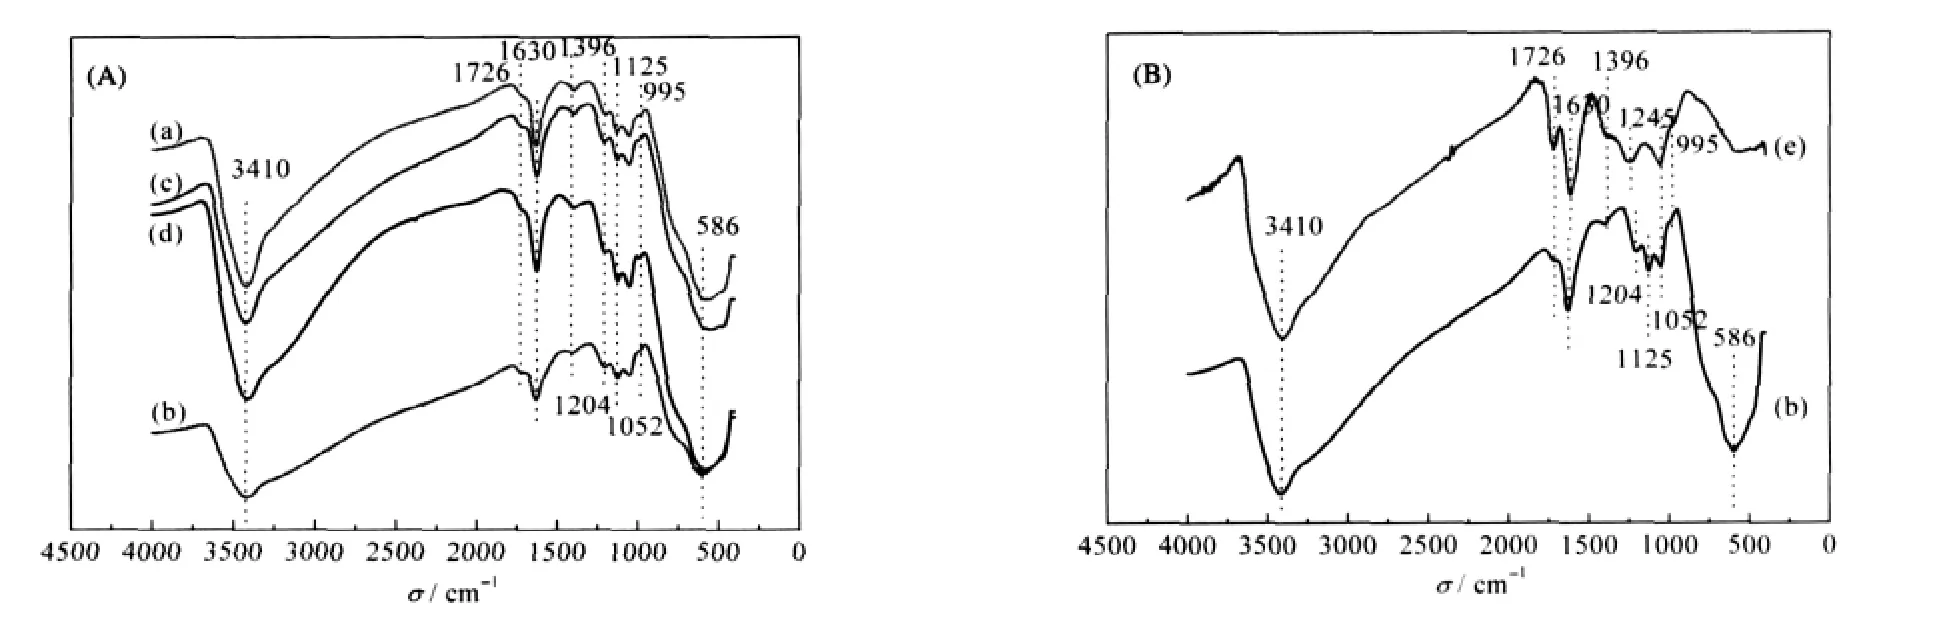
Fig.2 FT-IR spectra of TiO2-GO and GO samples(a-e)corresponding to samples(a-e)in Table 1.
The peak positions of all the spectra in the TiO2-GO samples in Fig.2 are very similar.A broad absorption band at around 3410 cm-1,and two small absorption bands at around 1396,and 1204 cm-1are observed in all the samples,which belong to the stretching and deformation vibration of structural hydroxyl groups,respectively.The sharp absorption band located at 1630 cm-1is assigned to the deformation vibration of adsorbed water molecules.In addition,the absorption band at around 1052 and 995 cm-1is assigned to the vibration of C—O—C group.Compared the FT-IR spectra of TiO2-GO with that of GO in Fig.2(B), new absorption band appeared at 586 and 1125 cm-1which correspond to stretching vibration of Ti—O with shorter bond length and stretching vibration of S=O bond possibly formed due to Ti(SO4)2as a raw material in the reaction process.Furthermore,another difference between TiO2-GO and GO in the FT-IR spectra is at around 1726 cm-1[14,25-26],which is assigned to stretching vibration of conjugated C=O or COOH located at the edge of GO,the absorption band of TiO2-GO is obviously suppressed which may be attributed to the consumption of most C=O in the process of the nucleation and growth of TiO2crystallites.
2.3 XPS analysis

Fig.3 XPS spectra of C 1sThe spectra are deconvoluted into five peaks of sp2:C—OH,C—O—C,C=O,and COOH. (a)graphite;(b)graphite oxide;(c)sample d(d)sample b;(e)sample f
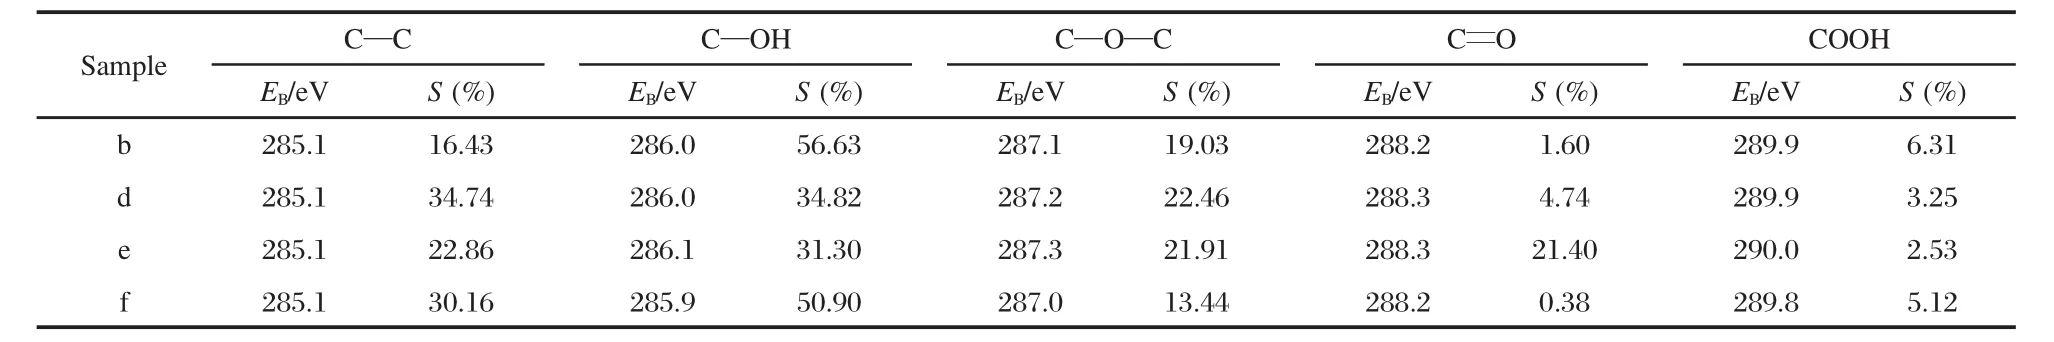
Table 2 XPS data of binding energies(EB)and relative area(S)for GO and TiO2-GO samples deconvoluted into five peaks
Fig.3(a-e)showsXPSC 1s ofgraphite(G),graphite oxide(GO), sample d or sample b and sample f in Table 1,same as follow.In Fig.3(a),the sp2-hybridized carbon peak appeared near 284.6 eV with a well-known asymmetric line shape.A few addi-tional peaks after oxidation developed due to the functional groups. The spectra were deconvoluted into five peaks of sp2(C—C, 285.1 eV),hydroxyl(C—OH,286.1 eV),epoxide(C—O—C, 287.3 eV),conjugated carboxyl(C=O,288.3 eV)and carboxyl (COOH,290.0 eV)groups in the graphite oxide[17,26-27],which are shown in Fig.3(b).Figs.3(c)and 3(d)show the XPS C 1s of samples d and b,and the shape of five peaks mentioned above suffered some degree of change.Table 2 shows the XPS data of binding energies and relative area percentages for GO and TiO2-GO samples deconvoluted into five peaks.Compared to GO,the area percentages of C=O in TiO2-GO samples reduced sharply.To sample d,with the decline of C=O,the content of C—C evidently increased.This can be interpreted by the nucleation and growth of TiO2in GO layer,where C=O was consumed abundantly and partly reduced to C—C.Additionally, to sample b,the content of C=O decreased much more evidently while COOH increased slightly.We speculate that as GO was exfoliated by NaOH,the lamella of GO broke into smaller flakes along with the increase of edge area of GO layer,which caused much more content of C=O and COOH.However,C=O had priority to react in the formation of TiO2which made it decrease sharply.On the other hand,as the total reaction environment is acidic,weakly acidic COOH was protected from no reacting preferentially which kept COOH with an upper content.Moreover,in the XPS data of sample b,the area percentage of C—OH enhanced obviously while the content of C—C decreased sharply,which can be explained that after the exfoliation of GO by NaOH,the colloidal GO/NaOH was alkaline and large amounts of OH attached to the carbon skeleton which finally leaded to the increase of C—OH and the decline of C—C groups.
Compared to sample b,the content of C—C in sample f,Fig.3 (e)evidently increased while other oxygen-containing groups decreased respectively.We deduced that UV light partly reduced the oxygen-containing groups during the photodegradation process,which is also consistent with the fact that the molar ratio of C/O in sample f increased from 1.08 to 1.40 compared to that of fresh sample.
2.4 Photoluminescence analysis
The PL emission spectra(excitation at 338 nm)of P25,sample b and sample d at room temperature are shown in Fig.4(a,b,d). We introduced the mixture of P25 and graphite(P25-graphite, Fig.4(c))as a comparison to evaluate the effects of the absorbance of graphite.All samples emit strongly in the UV with a band centered at 380 nm,corresponding to the excitonic emission[28].The green band around 476 nm is induced by the electron transition from the level of the ionized oxygen vacancies to the valence band[29-30].
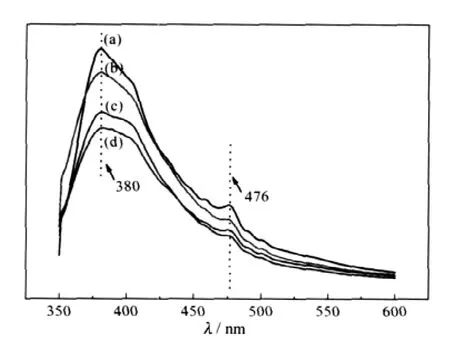
Fig.4 PL spectra of the as-prepared samples under 338 nm UV irradiation(a)P25;(b)sample b;(c)P25-graphite;(d)sample d
Compared to P25,the UV emission of sample b(Fig.4(b))and sample d(Fig.4(d))show a significant decline,which could be attributed to two possible reasons:the transfer of photoinduced electron and the absorbance of graphite.The PL spectrum of the mixture of P25 and graphite(Fig.4(c))is obviously weaker than sample b but slightly stronger than sample d.To the former situation,it should have shown the same UV emission between P25-graphite and sample b theoretically.So we deduce that nano P25 powders and electroconductive graphite flakes might have some close contact and the transfer of photoinduced electron might also took place in P25-graphite which caused the decrease of the UV emission.On the other hand,the really high content of C—OH groups and relatively low C—C groups,as shown in XPS spectra(Fig.3),resulted in the poor electroconductibility of GO in sample b which suppressed the transfer of photoinduced electron.However,the relatively high content of C—C groups and the better contact between the interface of nano TiO2particles and reduced GO flakes in sample d effectively promoted the photoelectron transfer process.
In conclusion,it is clear that the decline of the UV emission of sample b,compared with P25,totally resulted from the absorbance of graphite.As to sample d,it can be attributed to the combined action of the absorbance of graphite and the transfer of photoinduced electron.
2.5 FE SEM analysis
Fig.5(a,c,e)reveals the SEM images of sample d,which parallel to plane(a),and sample b,which parallel to plane(c)and perpendicular to plane(e).Fig.5(b,d,f)shows the magnified morphology of the square area in(a),(c)and(e),respectively.
Compared samples d with b(Figs.5(a)and 5(c)),we found that both of them showed layered structure,but GO was exfoliated more thoroughly by NaOH due to the obvious enlargement of the interlayer distance of GO lamella(shown in the illustration, Fig.5(c)).And the rolling structure(shown by the white arrow) found at the brink of GO lamella caused by uneven stress around the layer indicates that the formed GO lamella is very thin, which also explaines the better exfoliating capability of NaOH to GO,compared to that of H2O,promotes the formation of the lamellar-structure TiO2-GO.We can infer that as GO was exfoliated by NaOH,thinner GO layers increased and much more positions for the nucleation and growth of TiO2crystallites inside and outside the GO layer appeared,finally formed the intercalated structure with well-distributed TiO2particles.

Fig.5 FESEM images of TiO2-GO(a)sample d;(c),(e)sample b;(b),(d),and(f)are magnified morphology of the square area in(a),(c),and(e),respectively.
In the magnified morphology of the square area in Figs.5(a) and 5(c),Figs.5(b)and 5(d),huge amounts of nano TiO2particles can be found growing on the surface of GO flakes.By comparison,GO lamella appeared in Fig.5(d)is broader than that in Fig.5(b),and the nucleation and growth of TiO2crystallites also took place in such lamella.We speculate that the broader GO layers might be due to the connection of the GO flakes during the reaction between C=O located at the edge of GO and—Ti—O—Ti—induced by the hydrolysis of Ti(SO4)2.
From the image of TiO2-GO in Fig.5(e,f),we can clearly observe the distribution status of TiO2nanoparticles inside the interlayer of broad GO lamella,in which fine TiO2particles distributed regularly and homogeneously.
2.6 Photocatalytic properties
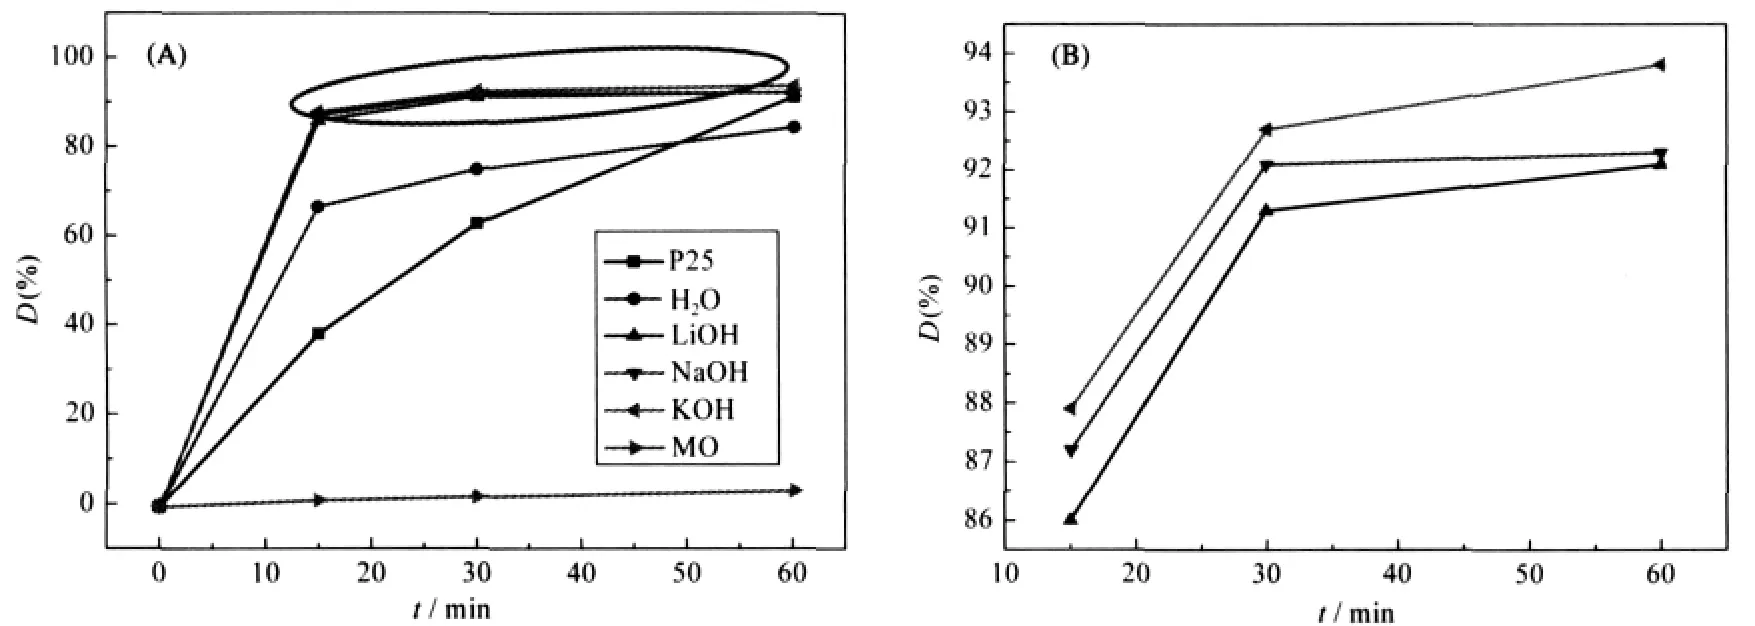
Fig.6 Photocatalytic properties of P25 powders and TiO2-GO samples exfoliated by different alkalies, and self-degradation rate of MO(A)(B)is magnification of the oval area in figure(A);D:degradation
Fig.6(A)shows the photocatalytic properties of TiO2-GO samples under different conditions contrasted with Degussa P25 powder,in which methyl orange(MO)played a role of a target degradation product.Fig.6(B)isthe magnification ofthe oval area in Fig.6(A).The results show that the photocatalytic properties of TiO2-GO composite(GO exfoliated by alkalies)is magnificent.Especially to the case of GO exfoliated by KOH,the pho-todegradation efficiency(η)to MO in 15 min is up to 87.9%, which can also be expressed as η=1.17 mg·min-1·g-1(η=1 mg· D(%)·1000)/(15 min·50 mg).As to GO exfoliated by NaOH and LiOH,the efficiency to MO in 15 min is 87.2%(η=1.16 mg· min-1·g-1)and 86%(η=1.15 mg·min-1·g-1).The photocatalytic properties of TiO2-GO composite(GO exfoliated by H2O)is slightly worse,as the data shown in Fig.6(A),66.7%in 15 min,η= 0.89 mg·min-1·g-1.Although Degussa P25 powder can degrade 91.3%MO in 60 min,such value in 15 min is only 38.4%,η= 0.51 mg·min-1·g-1,considerably lower than that of TiO2-GO composite.This may be caused by two factors.First,TiO2-GO composite has a better adsorption capacity than P25 powder which makes TiO2particles have higher probabilities to contact with MO.Second,the average crystal size of TiO2in TiO2-GO under different conditions is about 9 nm while the grain size of Degussa P25 powders comes up to 21nm.Contrasted with P25, larger specific surface area of TiO2in intercalation composite certainly improves the photodegradation efficiency.In addition, the properties of TiO2-GO composite are superior compared to that of the composite in which GO was exfoliated by H2O.From the test techniques above,these results can be explained that GO was exfoliated to a better degree,as GO was exfoliated by alkali, thinner GO layers increased and much more positions for the nucleation and growth of TiO2crystallites inside and outside the GO layer appeared,finally formed the intercalated structure with well distributed TiO2particles.In this case,when the composite is used to degrade methyl orange,more MO molecules can contact with the homogeneously distributed TiO2nanoparticles.Under UV light irradiation,more methyl orange molecules will be degraded and the photodegradation efficiency of the sample will be raised effectively.Moreover,the efficiency of TiO2-GO composite in which GO was exfoliated by different alkali differs slightly,as is shown in Fig.6(B),and the reason is same as that talked above.Owing to the different size of hydrated ion radius: K+<Na+<Li+,the hydrated ion of K+can diffuse into the interlayer of GO more easily,and then the hydrated ion substitute H+in GO layer and form stronger bond with GO.In consequence,among three alkali,KOH can exfoliate GO to a best degree and TiO2-GO composite in this case shows the best efficiency.
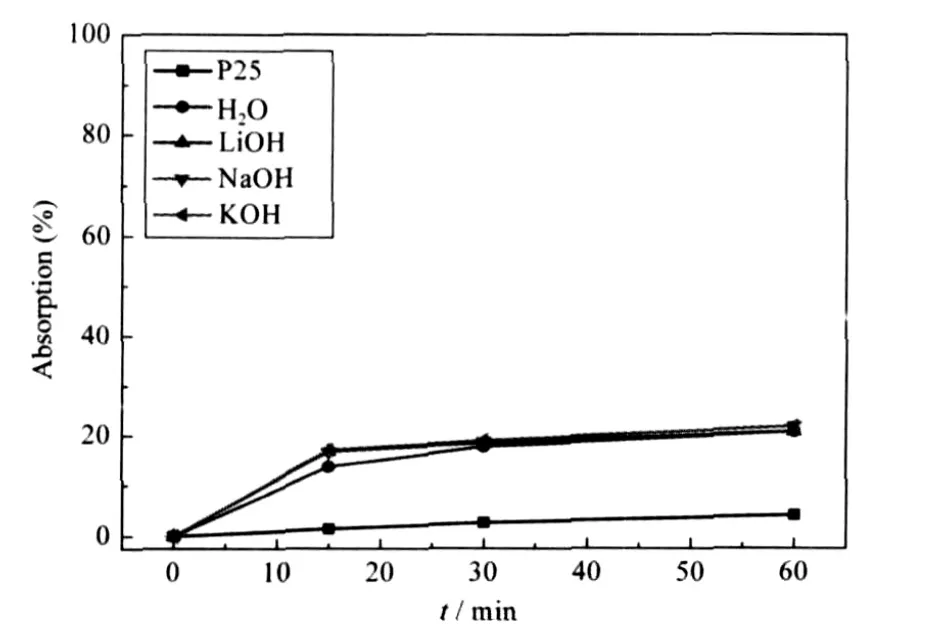
Fig.7 Adsorption of P25 powder and TiO2-GO composites under different conditions
Fig.6(A)also describes the self-degradation data of MO solution under UV light.After irradiation for 60 min,the degradation rate of MO is only 3.6%.Fig.7 shows the adsorption properties of TiO2-GO composites and Degussa P25 powder.When the suspensions of catalysts and MO were placed in the shadows for 15 min,the adsorption data of TiO2-GO(alkali),TiO2-GO(H2O) and P25 powder are up to 17%,14%and 1.5%,which is consistent with the conclusion discussed above.GO has a better adsorption capacity to MO than TiO2particles in TiO2-GO composite,which favorites the adjacent TiO2particles that have more chance to contact with the MO molecules and thereby increases the photodegradation efficiency.
The photocatalytic properties and adsorption properties of TiO2-GO sample f(see Table 1)are shown in Fig.8.When TiO2-GO was reused for three times,the degradation rates of the composite in initial 15 min of each time are 68.2%(η=0.91 mg·min-1· g-1),64.5%(η=0.86 mg·min-1·g-1)and 59.2%(η=0.79 mg· min-1·g-1)respectively.The efficiency decline compared with the fresh sample(86%,η=1.16 mg·min-1·g-1)can be attributed to the agglomeration factor of TiO2particles in the process of storage and continuous use.And the adsorption rates of sample f remain little change when contrasted to the fresh sample.
2.7 Formation mechanism of TiO2-GO composite
Fig.9 elaborates the formation mechanism of TiO2-GO in which GO was exfoliated by alkali.Firstly,graphite(a)was oxidized by strong oxidants such as KMnO4and concentrated H2SO4.The process of strong oxidation induced carboxyl(C= O),hydroxyl(C—OH),epoxide(C—O—C)covalently attached to its layers,which caused the enlargement of the interlayer distance of GO(b).When GO was exfoliated by NaOH,the hydrated sodium ions diffused into the interlayer,part of OH groups attached to the carbon skeleton,the GO lamella broke into flakes and the interlayer distance of GO increased once more(c).After adding the colloidal GO exfoliated by NaOH into the titanium sulfate acid solution,—Ti—O—Ti—chains induced by the hydrolysis of Ti(SO4)2diffused into the interlayer of exfoliated GO and substituted the alkali metal ions existed in the interlayer(d). The substitution mechanism might be due to the difference of the ionic charge,as known to all,the ion exchange capacity of high valence cation is stronger than that of low valence cation. The electric charge of—Ti—O—Ti—is positive divalent and the concentration of—Ti—O—Ti— in the reaction environment is really high (0.1 mol·L-1vs 0.05 mol·L-1alkali ions). Based on these facts,it is practical to substitute alkali metal ions with—Ti—O—Ti—.After—Ti—O—Ti— diffused into GO layer,the nucleation and growth of TiO2crystallites took place subsequently(e).Most—Ti—O—Ti—would react with conjugated carboxyl(C=O)located at the edge of GO layer and form TiO2crystallites,a small proportion of—Ti—O—Ti— chains may be consumed due to the reaction with hydroxyl(C—OH)or epoxide(C—O—C).On the other hand,the exfoliated broken GO flakes will connect together as—Ti—O—Ti—react with conjugated carboxyl(f),then TiO2-GO intercalation composite was finally synthesized.
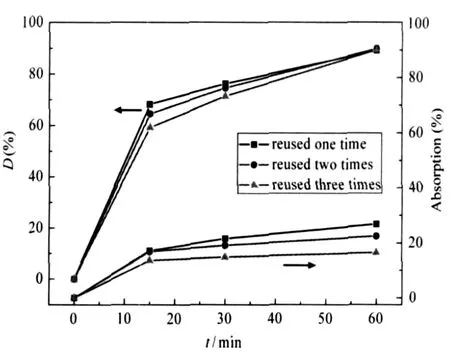
Fig.8 Photocatalytic properties and adsorption of sample f
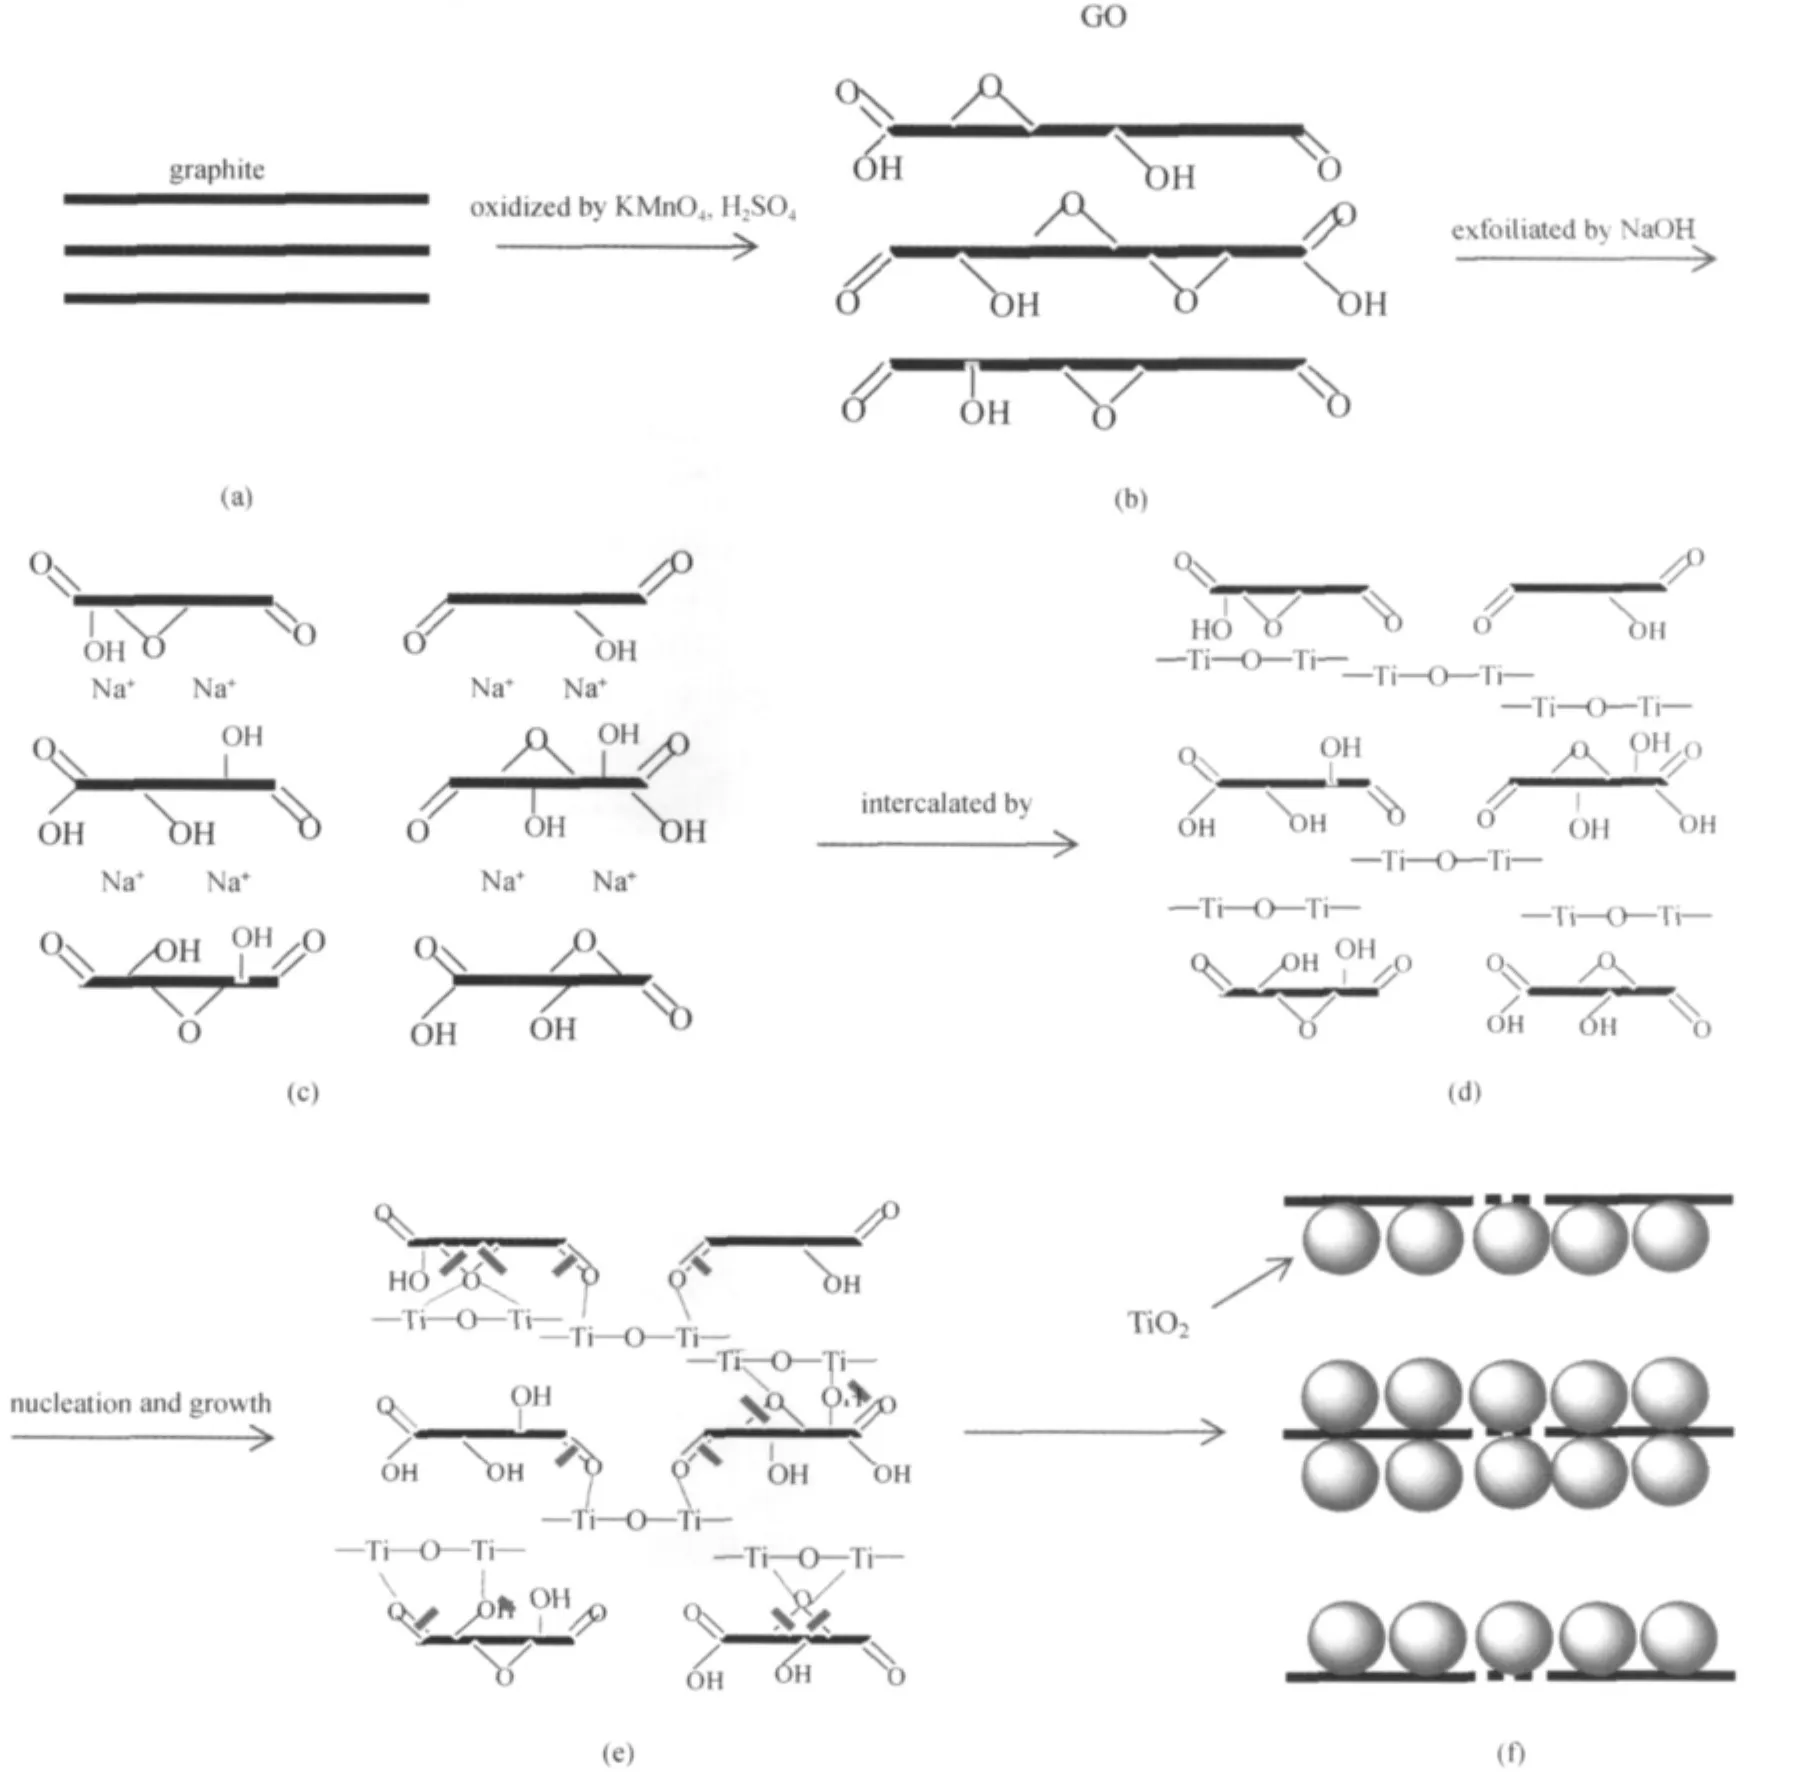
Fig.9 Formation mechanism of TiO2-GO composite
3 Conclusions
(1)TiO2-graphite oxide(TiO2-GO)composite has been successfully prepared at low temperature(80℃)with graphite oxide(GO)and titanium sulfate(Ti(SO4)2)as initial reactants.GO was firstly exfoliated by alkali or H2O,and then mixed with the titanium sulfate solution,the nucleation and growth of TiO2crystallites finally took place in the interlayer of exfoliated GO.
(2)Under the irradiation of UV light,the photodegradation efficiency of TiO2-GO(alkali)and TiO2-GO(H2O)to methyl orange in 15 min is up to 87.9%(η=1.17 mg·min-1·g-1)and 66.7% (η=0.89 mg·min-1·g-1),respectively.Compared with Degussa P25 powder,38.4%in 15 min,η=0.51 mg·min-1·g-1,these intercalation composites own much better efficiency.
(3)There are two main reasons for the much better photodegradation efficiency of TiO2-GO composite,compared to P25 powder.The first is the better adsorption capacity of TiO2-GO composite and the second is the smaller average grain size of TiO2crystallites(about 9 nm)which may be due to the limit of the unique layered structure of TiO2-GO.
(4)As GO is exfoliated by alkali,thinner GO layers increase and much more positions for the nucleation and growth of TiO2crystallites inside and outside the GO layer appear.In this case, when the composite is used to degrade methyl orange,more MO molecules can contact with the homogeneously distributed TiO2nanoparticles at same time.Under UV light irradiation,more methyl orange molecules will be degraded and the photodegradation efficiency of the sample will be more effective than that of TiO2-GO(H2O)composite.
1 Kim,T.Y.;Lee,Y.H.;Park,K.H.Res.Chem.Intermed.,2005, 31:343
2 Meacock,G.;Taylor,K.D.A.;Knowles,M.J.Sci.Food Agric., 1997,73:221
3 Kim,S.J.J.Sol-Gel Sci.Technol.,2001,22:63
4 Ihara,T.;Miyoshi.M.J.Mater.Sci.,2001,36:4201
5 Tang,H.;Prasad,K.;Sanjinès,R.J.Appl.Phys.,1994,75:2042
6 Sopyan,I.;Watanabe,M.;Murasawa,S.J.Photochem.Photobiol. A,1996,98:79
7 Hayashi,H.;Torii,K.J.Mater.Chem.,2002,12:3671
8 Minero,C.;Vione,D.Appl.Catal.B-Environ.,2006,67:257
9 Gao,Y.;Liu,H.;Ma,M.React.Kinet.Catal.Lett.,2007,90:11
10 Gao,B.;Chen,G.Z.;Puma,G.L.Appl.Catal.B-Environ.,2009, 89:503
11 Oh,W.C.;Jung,A.R.;Ko,W.B.Mater.Sci.Eng.C,2009,29: 1338
12 Gao,B.;Peng,C.Chen,G.Z.;Puma,G.Appl.Catal.B-Environ., 2008,85:17
13 Lin,J.;Zong,R.;Zhou,M.;Zhu,Y.F.Appl.Catal.B-Environ., 2009,89:425
14 Szabó,T.;Tombácz,E.;Illés,E.Carbon,2006,44:537
15 Bissessur,R.;Liu,P.K.Y.;White,W.Langmuir,2006,22:1729
16 Bourlinos,A.B.;Gournis,D.;Petridis,D.Langmuir,2003,19: 6050
17 Jeong,H.K.;Lee,Y.P.;Lahaye,R.J.W.E.J.Am.Chem.Soc., 2008,130:1362
18 Xiao,M.;Du,X.S.;Meng,Y.Z.New Carbon Materials,2004, 19:92
19 Han,Y.Q.;Lu,Y.Synth.Met.,2008,158:744
20 Wu,J.;Zou,Y.H.;Li,X.L.Sens.Actuators,B,2005,104:43
21 Wang,G.C.;Yang,Z.Y.;Li,X.W.Carbon,2005,43:2564
22 Higashika,S.;Kimura,K.;Matsuo,Y.Carbon,1999,37:351
23 Bissessur,R.;Liu,P.K.Y.;Scully,S.F.Synth.Met.,2006,156: 1023
24 Zhang,Y.H.;He,Y.Q.Front.Mater.Sci.China,2007,1:297
25 Hontoria-Lucas,C.;Lopez-Einado,A.J.;De Lopez-Gonzalez,J. D.Carbon,1995,33:1585
26 Szabo,T.;Berkesi,O.;Forgo,P.Chem.Mater.,2006,18:2740
27 Jeong,H.K.;Colakerol,L.;Jin,M.H.Chem.Phys.Lett.,2008, 460:499
28 Saraf,L.V.;Patil,S.I.;Ogale,S.B.Int.J.Mod.Phys.B,1998, 12:2653
29 Serpone,N.;Lawless,D.;Khairutdinov,R.J.Phys.Chem.,1995, 99:16646
30 Zhang,Y.X.;Li,G.H.;Jin,Y.X.Chem.Phys.Lett.,2002,365: 300