Gross Error Detection and Identification Based on Parameter Estimation for Dynamic Systems*
2009-05-14JIANGChunyang姜春阳QIUTong邱彤ZHAOJinsong赵劲松andCHENBingzhen陈丙珍
JIANG Chunyang (姜春阳), QIU Tong (邱彤)**, ZHAO Jinsong (赵劲松) and CHEN Bingzhen (陈丙珍)
Gross Error Detection and Identification Based on Parameter Estimation for Dynamic Systems*
JIANG Chunyang (姜春阳), QIU Tong (邱彤)**, ZHAO Jinsong (赵劲松) and CHEN Bingzhen (陈丙珍)
Department of Chemical Engineering, Tsinghua University, Beijing 100084, China
The detection and identification of gross errors, especially measurement bias, plays a vital role in data reconciliation for nonlinear dynamic systems. Although parameter estimation method has been proved to be a powerful tool for bias identification, without a reliable and efficient bias detection strategy, the method is limited in efficiency and cannot be applied widely. In this paper, a new bias detection strategy is constructed to detect the presence of measurement bias and its occurrence time. With the help of this strategy, the number of parameters to be estimated is greatly reduced, and sequential detections and iterations are also avoided. In addition, the number of decision variables of the optimization model is reduced, through which the influence of the parameters estimated is reduced. By incorporating the strategy into the parameter estimation model, a new methodology named IPEBD (Improved Parameter Estimation method with Bias Detection strategy) is constructed. Simulation studies on a continuous stirred tank reactor (CSTR) and the Tennessee Eastman (TE) problem show that IPEBD is efficient for eliminating random errors, measurement biases and outliers contained in dynamic process data.
gross error detection, data reconciliation, parameter estimation
1 Introduction
In the chemical industry, accurate and real-time process data is the foundation of on-line fault diagnosis, real-time monitoring, advanced control and dynamic optimization. Data reconciliation can effectively eliminate errors, typically for the normally distributed random errors, so that the quantities derived from the process data obey the first principles. In fact the industrial measurements are, however, usually contaminated by gross errors, which can be subdivided into measurement bias and outliers. Measurement bias refers to the situation in which measurement devices provide consistently erroneous values, either high or low. Outliers can be considered as abnormal behavior of the measurements, process peaks or unmeasured disturbances [1]. With the presence of gross errors, the reconciled measurements may greatly deviate from their true values. It’s quite necessary to carry out gross error detection and identification, which can locate and eliminate gross errors before data reconciliation.
For outliers there have been relatively effective methods, which can be divided into two categories. One is related to the process model and utilized to identify outliers and eliminate or reduce their influences on the performance of the conventional data reconciliation by making use of cluster analysis [2], quantile probability plots [3] or robust estimation [4-6]. The other one has no relation with the process model but utilizes the multi-scale property of wavelets for data processing and outlier identification [7].
For measurement bias detection and identification, current methods are limited in accuracy and efficiency, and cannot meet the demand for on-line application.
Narasimhan and Mah extended the generalized likelihood ratio (GLR) method for identifying gross errors and used a simple chi-square test to estimate the occurrence time of the gross errors [8]. Kao and Tamhane made use of the cumulative sum (CUSUM) test to detect the presence of gross errors and applied GLR method to identify and estimate their magnitudes [9]. Rollins. presented unbiased estimation technique (UBET) to identify measurement bias and process leaks [10, 11]. Devanathan. proposed a gross error identification approach based on the detection of bias changes [12]. Bagajewicz and Jiang presented a dynamic integral measurement test (DIMT) to identify hold-up measurements as suspects of gross errors [13]. But the above methods are all designed only for linear dynamic systems, which usually operate around a pseudo steady state.
Karjala and Himmelblau proposed an approach to identify measurement bias or measurement errors, which involved the usage of recurrent neural networks (RNN) and the extended Kalman filter (EKF) [14]. However, it is probable for RNN to encounter combinatory explosion problems. Vachhani. viewed the biased parameter identification as a diagnostic problem and brought in methods from fault diagnosis literature to improve the performance [15]. However, this approach is not adoptable for the situation in which multiple gross errors may exist.
Liebman. developed nonlinear dynamic data reconciliation (NDDR) method, which estimated measurement bias as a parameter [16]. This method could be applied to strongly nonlinear dynamic systems with multiple gross errors present. However, no strategy is included in this method to detect the presence of gross errors. Instead, each variable of the process is assumed to be biased and added a parameter for estimation, which increases the complexity of NDDR and limits its efficiency in on-line applications.
Based on Liebman’s parameter estimation method, McBrayer and Edgar proposed a new approach which examined the residuals and carried out summation test and regression test for bias detection [17]. This approach can serially identify and compensate measurement bias and avoid unnecessary parameter estimation, but involves too many unnecessary reconciliations. Besides, the base case required in this approach is ideal and difficult to acquire. Abu-el-zeet. simplified McBrayer’s strategy and presented a new methodology, which combined bias and outlier identification in dynamic data reconciliation [18]. Although base case is removed and some unnecessary calculations are avoided, it is still a serial detection and compensation procedure and not favorable for online applications. Kong. proposed the concept of gross error identifiability and derived the identifiable condition of a process. They also addressed an identification approach on the basis of parameter estimation [19]. But all these methods did not overcome the weakness of parameter estimation and could not meet the needs for high efficiency.
In this article, based on parameter estimation, a new bias detection strategy is proposed, which can simply detect the presence of bias and its occurring and ending time. As a result, the number of estimated parameters is remarkably reduced and the performance of parameter estimation is greatly improved. Furthermore, the strategy is combined with present outlier identification method. It is shown through simulations on the continuous stirred tank reactor (CSTR) test case and Tennessee Eastman (TE) Challenge Process that the integrated approach simultaneously and efficiently identifies bias and outliers for on-line data reconciliation.
2 The original parameter estimation method
In the absence of gross errors the measurement model can be written as:
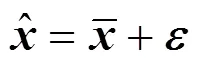
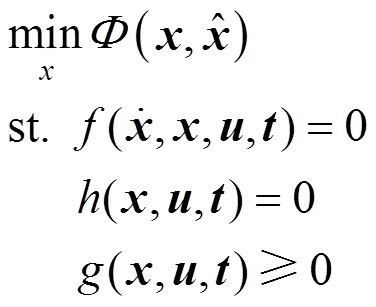
The data reconciliation problem can be stated as a constrained nonlinear programming problem [16]:


The model above has been proved powerful for nonlinear dynamic systems with random errors [16]. However, if the assumption that systematic bias is absent is not hold, the measurement model can be written as:


The original parameter estimation method is applicable and effective for nonlinear dynamic process with multiple gross errors present. But it does not include any bias detection strategy so as to be limited in efficiency, especially when only a small proportion of the measured variables contains gross errors, and present improved strategies bring in other iteration problems while reducing the number of the estimated parameters [17, 18], as mentioned above.
3 The improved parameter estimation method with bias detection strategy
3.1 Bias detection criterion
The CSTR test case published by Liebman. [16] was studied and the reconciled results which were acquired using model (2) were analyzed. It shows that the reconciled results differ a lot with or without the presence of bias. If the measurements only contain random errors in a moving horizon, there will be little deviation between the mean of estimated values and the mean of measured values [see Fig. 1 (a)]. If bias exists, the reconciled results will smear a lot from the measurements [see Fig. 1 (b)].

Figure 1 Reconciled results (a) without measurement bias and (b) with measurement bias —— true values; × measured values;● estimated values
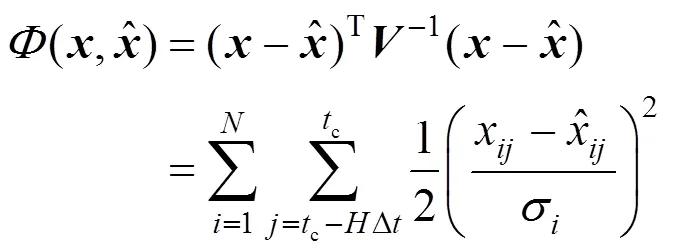
If the smearing could be detected in time using a simple criterion, measurement bias would be identified, including the contaminated variable and the occurring and ending time of the bias. However, it is not easy to tell whether the current deviation is caused by bias or not, because measurement bias is consistently erroneous, as is mentioned above. As a result, detection should be carried out on the basis of statistical analysis of measurements in a moving horizon. The straightforward idea is to analyze the difference between the mean of estimated values and the mean of measured values. Thus, a new criterion for bias detection is proposed as the following:

3.2 Improved data reconciliation model
Based on the criterion, the original parameter estimation model, as Eq. (5), is amended as the following:
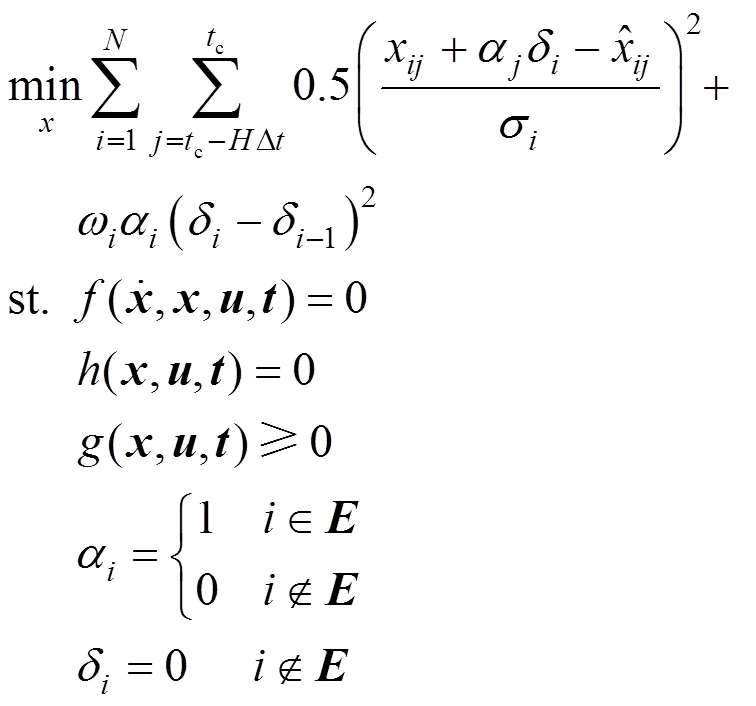
whereis the aggregate of subscript of the variables which might contain bias,is a vector to record the bias detection results.
It should be noted that a positive detection of criterion (6) does not mean that the current measured variable is positively biased. It should be determined eventually by whether the estimated value ofδis over the threshold.
3.3 Bias detection and identification strategy
Bias detection and identification strategy of the improved parameter estimation method is quite straightforward as the following:
1) For the first moving horizon, there is no historical measured data for reference. It is assumed that all the variables are not free of bias, sois set to unit vector. Then data reconciliation is carried out using model (7).
2) Save the reconciled results of the former moving horizon, and check whether criterion (6) holds. Record the detection result in the vector.
3) Reconcile the measurements in the current horizon. If the bias estimation of some variable is over the threshold, the presence of bias is insured and recorded.
4) Return to Step 2).
In this strategy unnecessary parameter estimations and iterations are avoided, so the complexity of data reconciliation is greatly reduced. Besides, the strategy is convenient to be integrated with the original parameter estimation method. Therefore, the improved parameter estimation method with bias detection strategy (IPEBD) can eliminate measurement bias and random errors simultaneously and efficiently.
4 Simulation case study
The IPEBD approach was successfully applied to the CSTR test case and the TE Challenge Processsimulation, which were both based on Matlab 7.3.0 platform on a PC (P4 3.0G, 1G ram).
4.1 CSTR test case
4.1.1
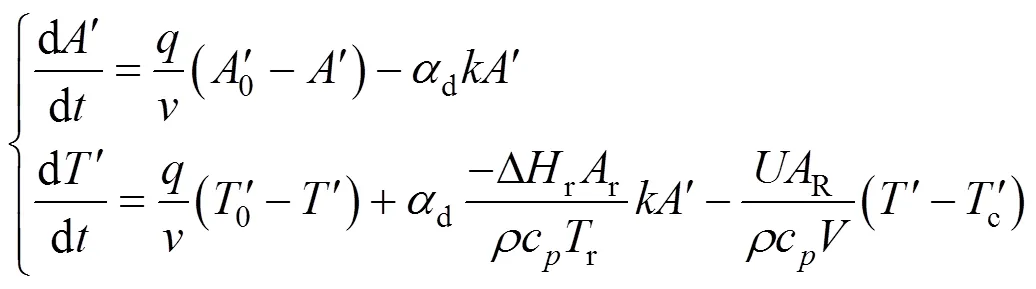
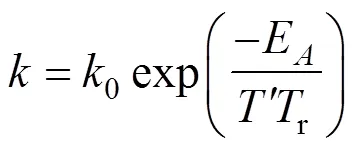
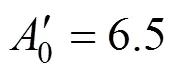
For comparison, IPEBD was tested on the same CSTR test case used by Liebman[16]. The scaled dynamic model can be written as:
4.1.2


4.1.3
Bias detection result is shown in Fig. 2. The vertical axis represents the judgment of the detection strategy, where 1 stands for positive detection and 0 for negative detection. As a result of the assumption that all the variables in the first moving horizon are not free of bias, it is not detection fault that the first stage of all the plots is 1. Since the strategy uses reconciled results in the former horizon for bias detection, there is a short delay in detection results, which is about 0.5-1 times the size of a horizon. There is only one detection fault at time steps 150-180. It is mainly caused by the step change in the input concentration, which is reasonable and acceptable.
The complexity and time consumption are greatly reduced by narrowing the search region. Table 1 shows that the efficiency of IPEBD is greatly improved whether measurement bias present or not. For this test case, in which approximate 50% of the measured data is contaminated by bias, the reconciliation efficiency is increased by about 30%. Since most measured data is free of bias in chemical industry, the efficiency increased will be up to 40%.
4.2 TE challenge process
The advantages of IPEBD have been proved in the CSTR test case where the measured data is contaminated by random errors and measurement bias. But real industrial process is usually more complex than a single CSTR, and the measured data usually contains outliers. In this section, IPEBD will be tested in a complex process named TE Challenge Process with random errors, bias and outliers present.

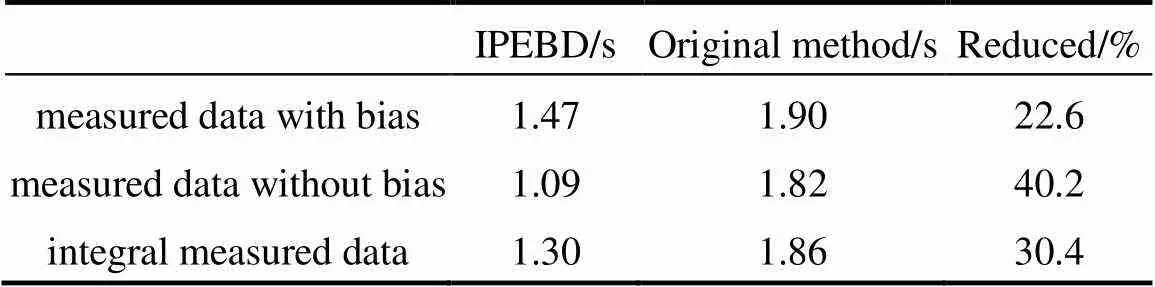
Table 1 Comparison of average time consumption
4.2.1
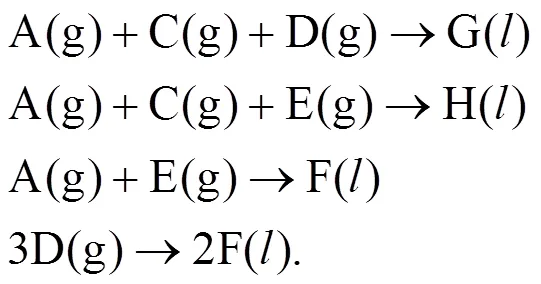
The TE Challenge Process—hereafter called the TE problem—was proposed by Downs and Vogel at an AIChE meeting in 1990 [20]. It involves coordination of four unit operations: an exothermic two-phase reactor, a flash separator, a reboiled stripper and a recycle compressor. The process produces two products from four exothermic, irreversible reactions. There are a total of eight components labeled as A-H, with component B an inert, components G and H the primary products, and component F a byproduct. The chemical reactions provided are written as:
4.2.2
Downs and Vogel omit details of the kinetics, phase equilibria and process dynamics, and no plant model is provided. Fortunately, some mechanistic nonlinear model has been developed and validated with data taken from the original Downs and Vogel work and their accompanying Fortran programs [21-23]. In this article, all the simulations of the TE problem are based on Ricker’s work [21, 22]. The mechanistic nonlinear model includes 76 algebraic equations, 26 differential equations and a total of 112 variables including 67 measured variables. More details could be found in the Refs. [21, 22].
The TE problem is tested through computer simulation with a sampled time of 1 min, and each moving horizon includes 7 measurements. Random errors in normal distribution, outliers of magnitude 5-10and measurement bias of magnitude 4-6are introduced randomly.
Since outliers are present, the IPEBD approach needs to be improved. With the object function replaced by a robust estimator [24, 25], IPEBD will be capable to deal with random errors, measurement bias and outliers simultaneously. The robust estimator adopted in the simulation is first published by the author, which is stated as the following [26]:
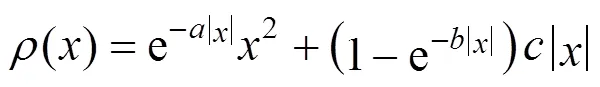
where,,are parameters to be tuned.
4.2.3
Since there are too many measured variables in the TE problem, only part of the reconciled results will be shown in the following text.
As a result of the introduction of the robust estimator, outliers are successfully identified and eliminated by IPEBD as shown in Fig. 5.

Figure 5 Results of outlier detection and identification—— true values; × measured values; ● estimated values; ○ outlier errors
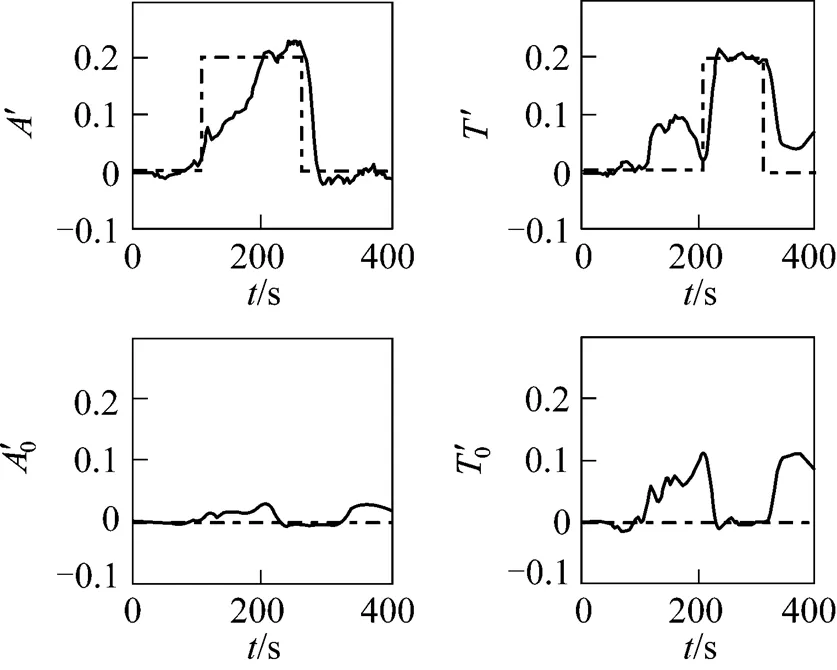
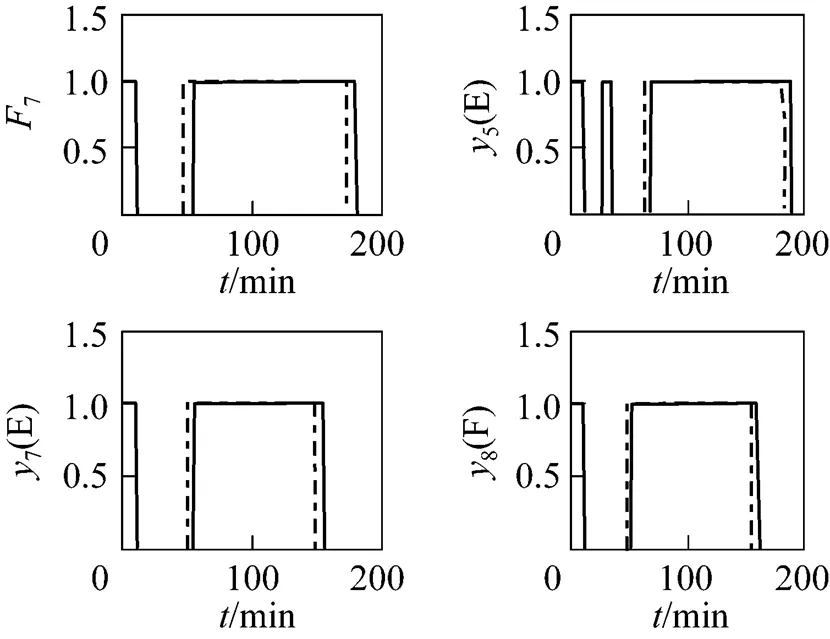
There are totally 4 measured variables contaminated by measurement bias, all of which are successfully detected by IPEBD (see Fig. 6). Bias detection only decides which variable might contain bias and the final judgments are made by the results of parameter estimation. As the CSTR test case, there are a short delay and some faults in bias detection, but bias identification is not affected. All the 4 biases are identified and reconciled eventually as shown in Fig. 7.
Because of the accurate bias detection of IPEBD, most parameters in the original parameter estimation method are avoided, which greatly improves the efficiency of data reconciliation. With the help of bias detection strategy, the average time consumption is reduced by about 30%. Since most measurements are free of bias in the industrial process, time consumption will be further reduced by about 38% (see Table 2). Besides, for the measurements in a single time step, the maximum time consumption of IPEBD is less than the sampled time step, typically 60 seconds in this case, which means IPEBD can be used for online application.
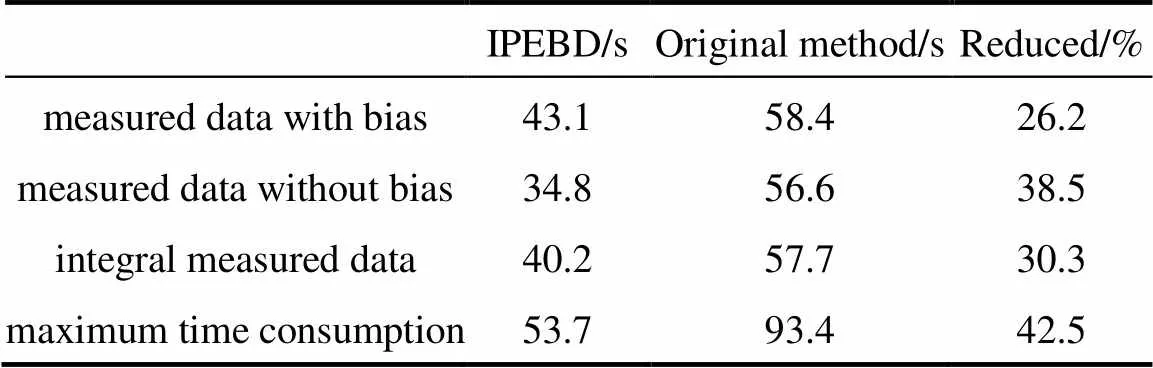
Table 2 Comparison of time consumption
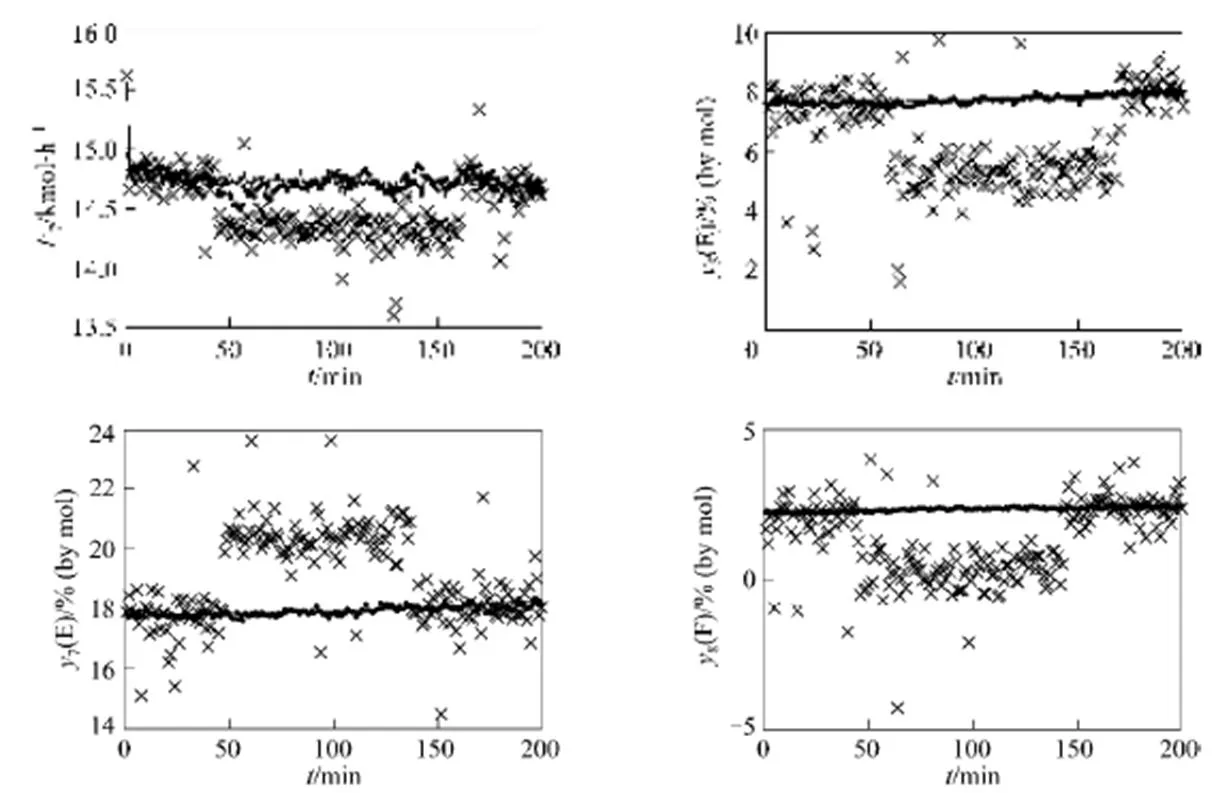
Figure 7 Results of bias identification—— true values; × measured values; ● estimated values
5 Conclusions
Parameter estimation method has been proved to be a powerful tool for bias identification. However, without a reliable and efficient bias detection strategy, data reconciliation based on parameter estimation is limited in efficiency and cannot be applied widely. Against the shortcomings of parameter estimation method, a new bias detection strategy is successfully constructed and has been shown to work efficiently in detecting the presence of measurement bias and recognizing its occurring time. With the strategy present, the number of parameters to be estimated is greatly reduced, and serially detection and iterations are avoided. Besides, the number of decision variables of optimization is reduced, through which influences between parameters estimated are decreased and the accuracy of parameter estimation is improved. By incorporating the strategy into the data reconciliation model, a new methodology named IPEBD is constructed based on parameter estimation method, and it works pretty well in CSTR and TE testing cases.
NOMENCLATURE
feasible region of the original method

feasible region of the improved method
aggregate of subscript of the variables which might contain bias
6reactor feed, kmol·h-1
7reactor outlet, kmol·h-1
differential equation constraints
algebraic inequality constraints
width of the history horizon
algebraic equality constraints
number of the measured variables
vector of time
ccurrent time
Δsample time step
vector of the unmeasured variables
variance-covariance matrix of the measurements
vector of the reconciled measurements
r(G) G in reactor, % (by mol)
5(E) E in top outlet of stripper, % (by mol)
6(H) H in reactor feed, % (by mol)
7(E) E in reactor outlet, % (by mol)
8(B) B in recycle stream, % (by mol)
8(F) F in recycle stream, % (by mol)
vector to record the bias detection results
vector of the measurement bias

δtheth assumed parameter to be estimated

vector of the random errors
ζthreshold of the criterion
penalty weight for theth variable
1 Yuan, Y.G., Li, H.S., Data Rectification of Process Measurements, China PetroChemical Press, Beijing (1996).
2 Chen, J., Romagnoli, J.A., “A strategy for simultaneous dynamic data reconciliation and outlier detection”,..., 24 (4/5), 559-562 (1998).
3 Chen, J., Bandoni, A., Romagnoli, J.A., “Outlier detection in process plant data”,..., 22 (4/5), 641-646 (1998).
4 Zhou, L.K., Su, H.Y., Chu, J., “A new method to solve robust data reconciliation in nonlinear process”,...., 14 (3), 357-363 (2006).
5 Özyurt, D.B., Pike, R.W., “Theory and practice of simultaneous data reconciliation and gross error detection for chemical processes”,..., 28, 381-402 (2004).
6 Faber, R., Li, B., Li, P., Wözny, G., “Data reconciliation for real-time optimization of an industrial coke-oven-gas purification process”,, 14, 1121-1134 (2006).
7 Jiang, T.W., Chen, B.Z., He, X.R., “Industrial application of wavelet transform to the on-line prediction of side draw qualities of crude unit”,..., 24, 507-512 (2000).
8 Narasimhan, S., Mah, R.S.H., “Generalized likelihood ratios for gross error identification in dynamic processes”,., 34, 1321-1331 (1988).
9 Kao, C.S., Tamhane, A.C., Mah, R.S.H., “Gross error detection in serially correlated process data (2) Dynamic systems”,...., 31, 254-262 (1992).
10 Rollins, D.K., Davis, J.F., “Unbiased estimation of gross errors in process measurements”,., 38 (4), 563-572 (1992).
11 Rollins, D.K., Devanathan, S., “Unbiased estimation in dynamic data reconciliation”,., 39, 1330-1334 (1993).
12 Devanathan, S., Rollins, D.K., Vardeman, S.B., “A new approach for improved identification of measurement bias”,..., 24, 2755-2764 2000).
13 Bagajewicz, M. J., Jiang, Q., “Gross error modeling and detection in plant linear dynamic reconciliation”,..., 22, 1789-1809 (1997).
14 Karjala, T.W., Himmelblau, D.M., “Dynamic rectification of datarecurrent neural nets and extended Kalman filter”,., 42, 2225-2239 (1996).
15 Vachhani, P., Rengaswamy, R., Venkatasubramanian, V., “A framework for integrating diagnositic knowledge with nonlinear optimization for data reconciliation and parameter estimation in dynamic system”,..., 56, 2133-2148 (2001).
16 Liebman, M.J., Edgar, T.F., Lasdon, L.S., “Efficient data reconciliation and estimation for dynamic processes using nonlinear programming techniques”,..., 16 (10/11), 963-986 (1992).
17 McBrayer, K.F., Edgar, T.F., “Bias detection and estimation in dynamic data reconciliation”,., 5 (4), 285-289 (1995).
18 Abu-el-zeet, Z.H., Becerra, V.M., Roberts, P.D., “Combined bias and outlier identification in dynamic data reconciliation”,..., 16, 921-935 (2002).
19 Kong, M.F., Chen, B.Z., He, X.R., Hu, S.Y., “Gross error identification for dynamic system”,..., 29, 191-197 (2004).
20 Downs, J.J., Vogel, E.F., “A plant-wide industrial process control problem”,..., 17 (3), 245-255 (1993).
21 Ricker, N.L., “Optimal steady-state operation of the Tennessee Eastman challenge process”,..., 19 (9), 949-959 (1995).
22 Ricker, N.L., Lee, J.H., “Nonlinear modeling and state estimation for the Tennessee Eastman challenge process”,..., 19 (9), 983-1005 (1995).
23 Tian, Z.H., Hoo, K.A., “Multiple model-based control of the Tennessee- Eastman process”,...., 44, 3187-3202 (2005).
24 Huber, P.J., Robust Statistics, Wiley, New York (1981).
25 Hampel, F.R., Ronchetti, E.M., Rousseeuw, P.J., Stahel, W.A., Robust Statics: the Approach Based on Influence Functions, John Wiley & Sons, New York (1985).
26 Jiang, C.Y., Qiu, T., Chen, B.Z., Zhao, J.S., “An improved robust dynamic data reconciliation approach”,..., 24 (10), 1297-1301 (2007).
2008-09-23,
2009-03-11.
the National High Technology Research and Development Program of China (2006AA04Z176).
** To whom correspondence should be addressed. E-mail: qiutong@tsinghua.edu.cn
猜你喜欢
杂志排行

Chinese Journal of Chemical Engineering的其它文章
- On-line Monitoring for Phosphorus Removal Process and Bacterial Community in Sequencing Batch Reactor*
- Mechanism Study of Rice Straw Pyrolysis by Fourier Transform Infrared Technique*
- Simultaneously Designing and Targeting for Networks with Multiple Resources of Different Qualities*
- Modeling and Control of Nonlinear Discrete-time Systems Based on Compound Neural Networks*
- Effect of Doping Cerium in the Support of Catalyst Pd-Co/Cu-Co-Mn Mixed Oxides on the Oxidative Carbonylation of Phenol
- Biodegradation of Aniline by a Newly Isolated Delftia sp. XYJ6*