Enhancement of Proton Exchange Membrane Fuel Cell Performance Using a Novel Tapered Gas Channel*
2009-05-12ZHONGZhenzhong钟振忠CHENJunxun陈俊勋andZHUANGPingji庄平吉
ZHONG Zhenzhong (钟振忠), CHEN Junxun (陈俊勋) and ZHUANG Pingji (庄平吉)
Enhancement of Proton Exchange Membrane Fuel Cell Performance Using a Novel Tapered Gas Channel*
ZHONG Zhenzhong (钟振忠)**, CHEN Junxun (陈俊勋) and ZHUANG Pingji (庄平吉)
Department of Mechanical Engineering, National Chiao Tung University, Hsinchu 300, China
Based on use of multi-dimensional models, this investigation simulates the performance of a proton exchange membrane fuel cell by varying the channel pattern. In the one-dimensional model, the porosity of the gas diffusion layer is 0.3. The model reveals the water vapor distribution of the fuel cell and demonstrates that the amount of water vapor increases linearly with the reduction reaction adjacent to the gas channel and the gas diffusion layer. Secondly, four novel tapered gas channels are simulated by a two-dimensional model. The model considers the distributions of oxygen, the pressure drop, the amount of water vapor distribution and the polarization curves. The results indicate that as the channel depth decreases, the oxygen in the tapered gas channel can be accelerated and forced into the gas diffusion layer to improve the cell performance. The three-dimensional model is employed to simulate the phenomenon associated with four novel tapered gas channels. The results also show that the best performance is realized in the least tapered gas channel. Finally, an experimentally determined mechanism is found to be consistent with the results of the simulation.
multi-dimensional models, proton exchange membrane fuel cell, tapered gas channels, oxygen, pressure drop
1 INTRODUCTION
The best performance is realized in a proton exchange membrane fuel cell (PEMFC) when the anode fuel is pure hydrogen and the cathode fuel is pure oxygen. Research and development of PEMFCs have attracted much interested. Hu. [1] developed a numerical model of a PEMFC and simulated basic transport phenomena as gas-liquid two-phase flows in a working fuel cell. Shao. [2] proposed a dynamic thermal-transfer model of a PEMFC stack based on energy conservation to improve the control of its temperature. Zhang. [3] studied the degradation mechanism of key components in a PEMFC membrane electrode assembly (MEA) and identified feasible means of avoiding degradation. Additionally, the novel MEA is particularly suitable for portable electronic power applications. However, at high current density, the mass transport of reagents to the electrode interface becomes limited. The cell performance decreases substantially with increasing current density, because the oxygen-related kinetics is slowed down and mass transport is limited due to the liquid water generated by the electrochemical reaction. Such water may even flood parts of the gas channels [4]. Therefore,this study modifies the flow channel pattern to enhance oxygen transport in the cathode and thereby improve cell performance. Springer. [5] developed an isothermal, one-dimensional, steady-state model, which balanced water and water vapor at the interface between the membrane and the electrode. Their pioneering research provided the simple diffusive mass transport mechanism and electrochemical kinetics of oxygen transport in the cathode. Bernardi and Verbrugge [6] discussed a comprehensive mathematical model for a PEMFC with reference to fundamental cell polarization characteristics, water transport and catalyst utilization. Their results indicated that if the membrane maintains full saturation, then its contribution to the total cell resistance increases with current density.
Gurau. [7] proposed a one-dimensional half-cell model, considering the presence of liquid water in the gas diffusion layer and the catalyst layer. One parameter was the mean effective porosity of the porous media when the pores were partially filled with liquid at thermodynamic and hydrodynamic equilibriums. Simulations demonstrated that the limiting current density was independent of the properties of the catalyst layer. Futerko and Hsing [8] used the finite element method to solve the continuity, potential and Stefan-Maxwell equations in the flow channel and gas diffusion layer. Their results demonstrated that the fluid flow streamlines, gas mole fractions, membrane water content, current density distributions and water flux profiles are functions of pressure. The PEMFC model applied by Hum and Li [9] was two-dimensional, steady-state, isothermal and fully humidified. The results show that the cathode catalyst layer exhibits more pronounced changes in potential, reaction rate and current density generation than the anode layer, because it has larger activation over-potential and a lower diffusion coefficient of oxygen. Jung. [10] applied a two-dimensional simulation model and found that the mass transport limitation generated rapidly reduces the cell voltage as the current density increases. They also investigated the effects of cell temperature, reactant pressures and gas utilization ratio on cell performance. Their results indicated that flow distribution and current production affect each other significantly.
Dutta. [11] solved the complete three- dimensional, Navier-Stokes equations for a multispecies mixture. They treated electrochemical reactions as mass source/sink terms in the control volumes. Their results indicated that the flow directions depended significantly on the pattern of mass consumption on the MEA. Berning. [12] studied a PEMFC using a comprehensive three-dimensional computational model with all major transport phenomena in the flow channels, electrodes and electrolyte membrane. Their results yielded useful parameters for the design of a fuel cell. Hwang. [13] simulated the transport phenomena on the cathode side of a PEMFC using a three-dimensional numerical model. They applied the Tafel equation to relate the oxygen concentration and current density to the over-potential at the reaction surface with two types of gas distributor. Their results indicated that the interdigitated gas distributor provides a higher average current density on the catalyst layer surface than the parallel gas distributor at the same mass flow rate and cathode over-potential. Weng. [14] presented a rigorous 3-D mathematical model to predict and analyze the concentration of PEMFC species and current density distributions in different flow field patterns under various operating conditions. The simulation results revealed that serpentine and interdigiated flow patterns show strong convection and high mass transfer. Liu. [15] developed an isothermal, steady-state, three-dimensional multi-component transport model for a PEMFC. It was revealed in detail the distribution characteristics of oxygen concentration, local current density and the cathode activation over-potential at different current densities.
Yamada. [16] numerically identified the location and magnitude of flooding in PEMFC using a conventional flow field in experiments. The pressure drop can indicate the flooding level in a gas diffusion layer in the conventional flow field. Yan. [17] carried out experiments under different operating conditions and designed five flow fields with different geometries to improve cell performance. They compared the PEMFC with different conventional flow field designs and found that the rate of the electrochemical reaction increased with the number of flow channels, the flow channel length and the number of corners in a serpentine flow field. Su. [18] discussed two types of flow channel and two electrode sizes with flooding in the cathode flow channels of a low-temperature PEMFC. Their results showed an absence of flooding in the upstream channels in a serpentine-interdigitated flow field, and the novel design seems better for water removal. Ferng and Su [19] investigated the effects of different flow channel designs on the performance of PEMFC. It was found that the parallel flow channel with the step-changes in depth markedly improved the PEMFC performance. Wang. [20] presented a three-dimensional transport model based on the finite-volume method to analyze the effects of the ratio of the flow channel area and the cathode flow rate on the cell performance and local transport characteristics of PEMFC with parallel or interdigitated flow channel designs. The results showed that at high operating voltage, the cell performance was independent of the flow channel design and the operating parameters, while at low operating voltages, both factors affected the cell performance.
Slow oxygen reduction kinetics and water management are well known to be associated with such critical problems as flooding in cathode flow channels, which directly affect the fuel cell performance. The study simulates the effects of convection in a PEMFC using the commercial software, Multiphysics. A one-dimensional model is employed to simulate the distribution of water in the gas diffusion layer. Then, to overcome the limitation on mass transport, a novel cathode gas channel with a tapered configuration is designed. Therefore, two- and three-dimensional models are applied to simulate the distributions of oxygen, the amount of water, the pressure drop and the polarization characteristics of such a gas channel.
2 MATHEMATICAL MODELS
Some simplifications must be made to yield a numerically tractable problem. The main assumptions of the model are as follows:
(1) The flow is steady-state, incompressible, laminar and isothermal;
(2) The inlet fuel is fully saturated with water vapor;
(3) All gases are ideal gases;
(4) The water is produced in the gaseous phase;
(5) The diffusion coefficient is constant;
(6) The over-potential, used as operational parameter, is a fixed value to calculate each current density;
(7) The catalyst layer is a thin interface, where the sink and source terms for the reactants are specified.
2.1 Governing equations in cathode gas channel
Based on the above assumptions, the conservation equations of continuity, momentum and species in the cathode gas channel are as follows.
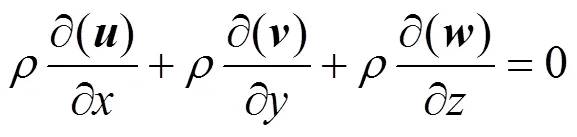
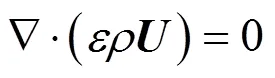
Continuity equation:
Momentum conservation equations:


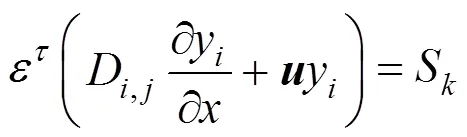
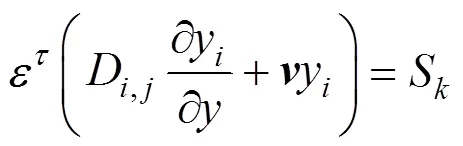
The species equation for a multi-species process is determined by the mass transport equation:

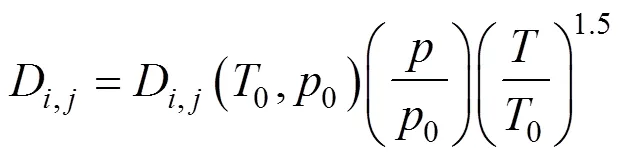
whererepresents oxygen, nitrogen and water vapor, andD,jis the diffusivity of the species. The latter is an experimental value, taken from Bernardi and Verbrugge [6], which is obtained at atmospheric pressure0and taken with the temperature and pressure:
The average molecular mass of gas mixture is calculated using:

The mass fraction of the saturated water vapor is related to the molar fraction by:
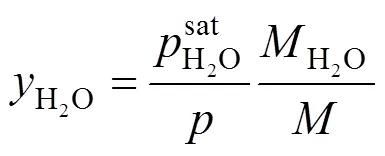
where the water-saturated pressure is calculated using:

2.2 Boundary conditions of gas flow channel
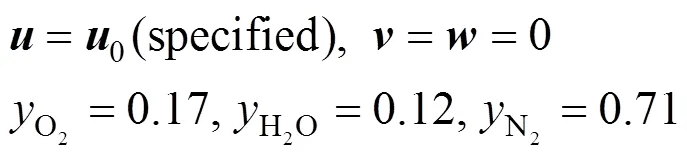
The boundary conditions of the present computational domain at the inlet of gas channel are:
At the walls of the gas channel, no-slip and impermissible conditions are applied:

At the outlet of the gas channel, the boundary conditions are:

At the interface between the gas channel and gas diffusion layers, the boundary conditions for the mass fraction are:

2.3 Governing equations for gas diffusion layer
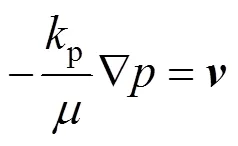
The gas diffusion layers are treated as porous media. The momentum equation has a source term associated with the porous media, which are used to form the flow through diffusion layer, as described by Darcy’s law. These equations are:
Continuity equation:
Momentum equations:

Species equation:
培育壮大新动能有利于推进创新发展。创新发展是新发展理念之一。创新是引领发展的第一动力,是建设现代化经济体系的战略支撑。创新发展首先要解决的是创新动力的培育,而培育壮大新动能将为创新发展提供强大的动力。特别是创新型企业是创新发展的基本主体,新技术是创新发展的核心内容,新制度是创新发展的内在动力。


The no-slip and impermissible conditions are applied at the gas diffusion layer walls.

2.4 Interface conditions between gas diffusion layer and catalyst layer
At the interface between the gas diffusion layer and catalyst layer, the boundary conditions are:
The catalyst layer is treated as a thin interface and adheres to the boundary wall of the gas diffusion layer, where the sink and source terms associated with the reactants are applied. Based on an assumption of infinitesimal thickness, the source terms are actually applied in the last grid cell of the gas diffusion layer. At the interface between the gas diffusion layer and the catalyst layer, the boundary conditions for the mass fraction are:

WhereS, the source term for oxygen at the cathode side, is described by Dutta. [11] as:

For water, it is:
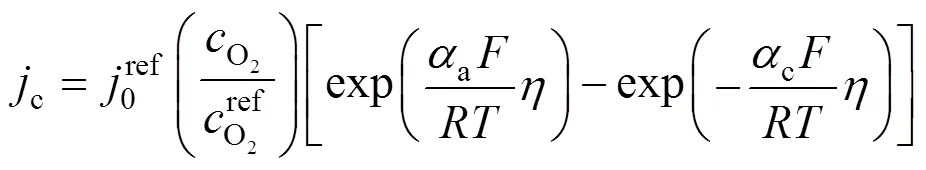
wherecis the local current density, described by the Bulter-Volmer equation:


whereandare the total width and length of the model.
Detailed multi-dimensional models of the transport phenomena and the fuel cell performance are described above. In this work, four grid systems, shown in Fig. 1, are tested in advance and their influences on the resultant velocity profiles at the middle of the gas channel (-direction) are examined. The velocity profiles for 4100, 5100 and 6100 elements are similar to each other. Therefore, the grid system with 5100 elements is adopted as a trade-off between solution accuracy and computational time.
2.5 Experimental
A series of experiments was performed to verify the accuracy of the predications as follows. The PEMFC consists of several major components—the membrane electrode assembly (MEA), the catalyst layer, the gas diffusion layer (GDL), the bipolar plate and the current collector. The PRIMEA series 5561 MEA, a commercial product from Gore, is used in this experiment. The middle of the membrane with an active area of 25 cm2has a thickness of 35 μm. The catalyst loads are 0.45 [mg Pt-Ru alloy (1︰1)]·cm-2on the anode and 0.6 (mg Pt)·cm-2on the cathode. The gas diffusion layers are CARBEL CL GDL and the current collector consists of gold-plated copper. The parallel channels are 0.1 cm wide and 0.1 cm deep and are separated by a 0.1 cm-wide rib used on both the anode and the cathode sites. In the flow field oxygen enters the gas diffusion layer and then traverses an array of parallel channels. Notably, novel tapered flow field in the cathode was designed. The only difference between the simulation and the experiment is that only one tapered flow channel is concerned in the experiment. Fig. 2 displays the experimental configuration.


3 RESULTS AND DISCUSSION
The mass fractions of oxygen, water vapor and nitrogen at the inlet are fixed at 0.17, 0.12 and 0.71, respectively. The temperature is set to 333 K and the over-potential () is 0.3 V. The parameters for the 1-D, 2-D and 3-D models are taken mostly from Gurau. [7], Yan[17] and Hwang[13]. Tables 1, 2 and 3 show the detailed parameters in this study.
3.1 One-dimensional model
Figure 3 schematically depicts the configuration of the one-dimensional model. The effects of gas convention are neglected and the mass transport depends only on diffusion in this model.
The oxidization of hydrogen proceeds so quickly that it causes a very low activation over-potential, which is approximately zero. Nevertheless, the reduction of oxygen involves more steps, causing its activation over-potential to exceed that of hydrogen. Therefore, the activation over-potential of the total reaction can be regarded as associated mostly with oxygen reduction in the cathode site. In this work, the activation over-potential is the input parameter.
The over-potential governs the relationship between the current density and oxygen concentration.
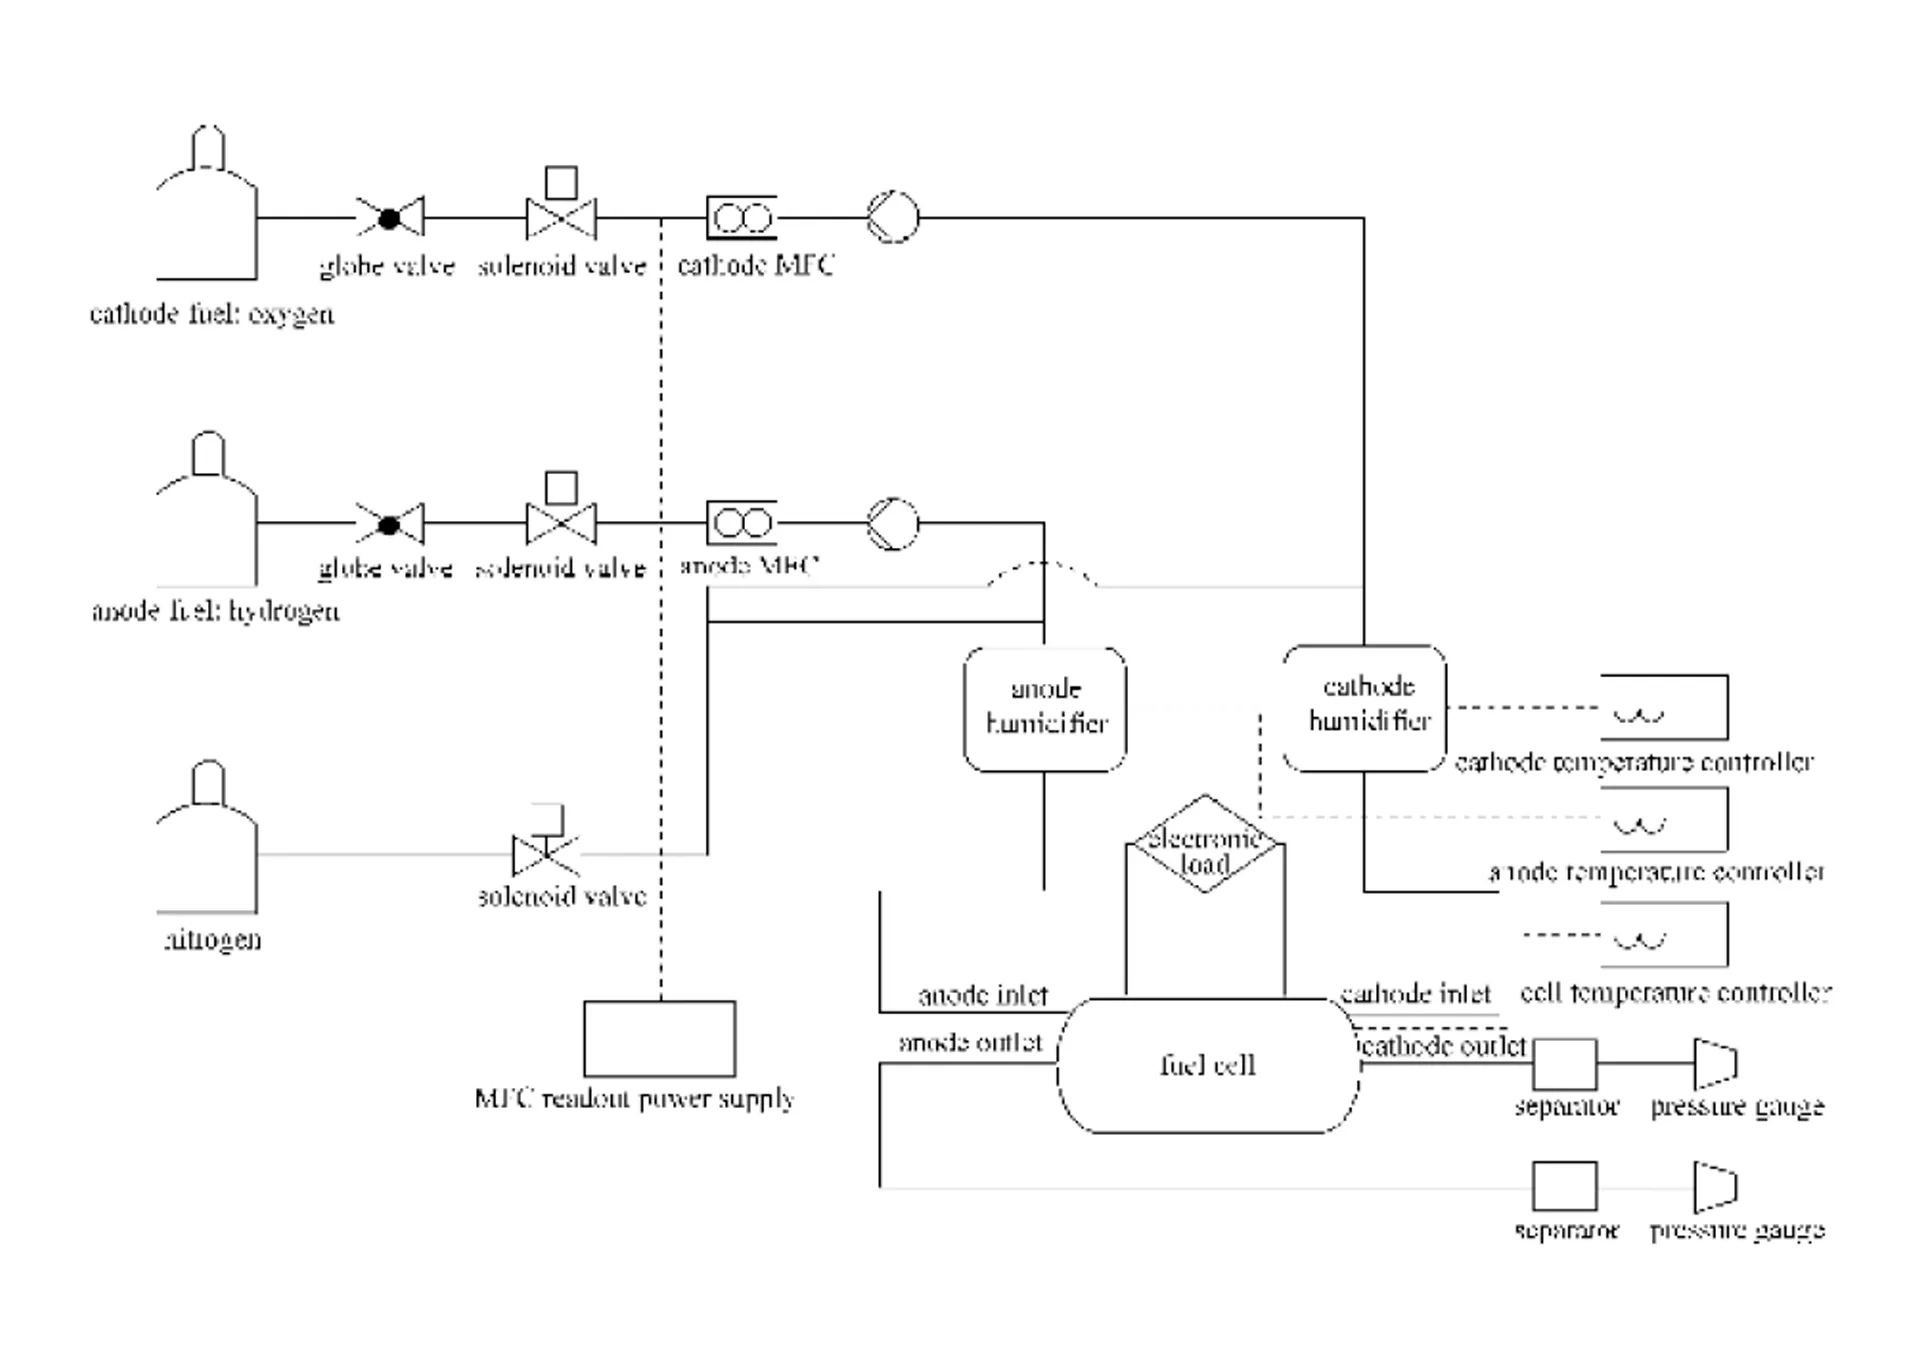
Figure 2 Schematic diagram of the experimental setup

Table 1 Dimensions, properties and parameters for the 1-D model

Table2 Dimensions, properties and parameters for the 2-D model
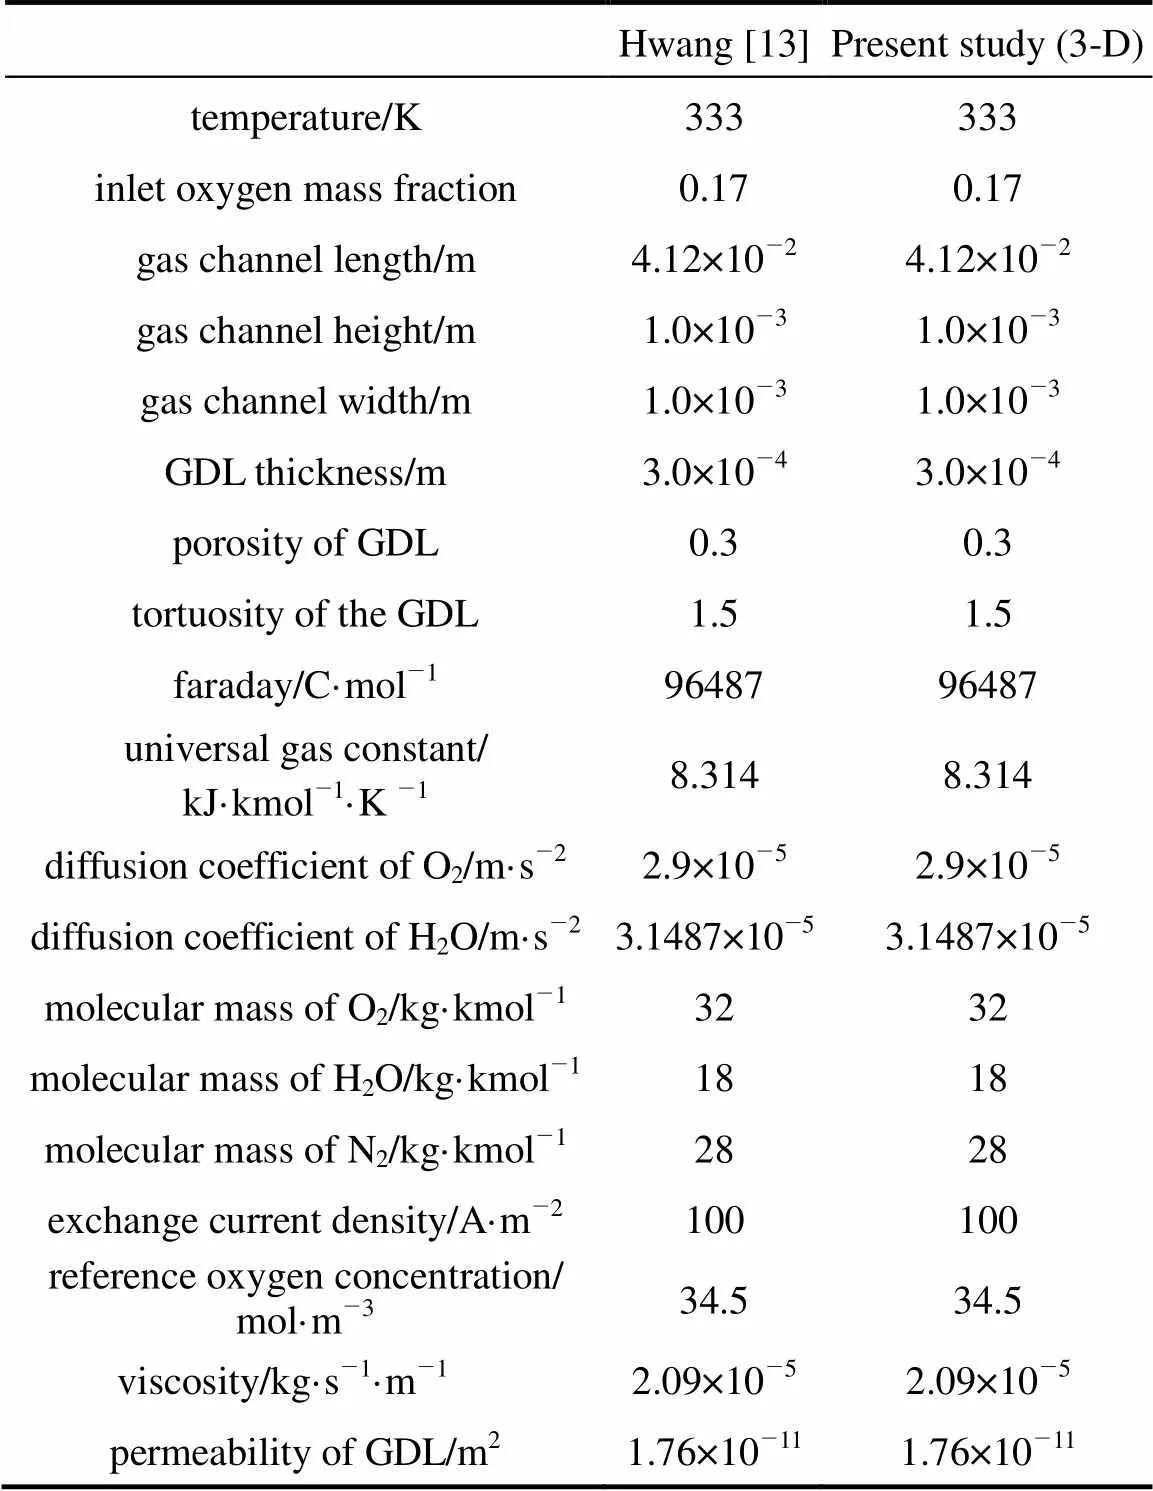
Table 3 Dimensions, properties and parameters for the 3-D model
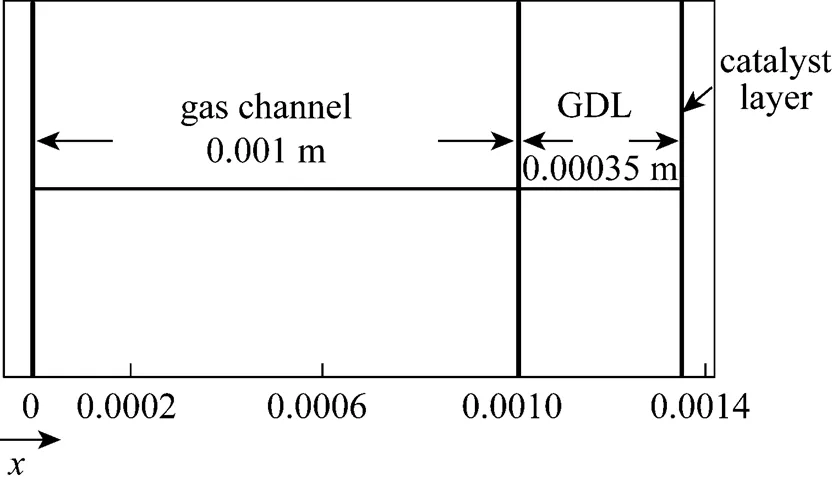
Figure 3 Schematic configuration of 1-D model
Figure 4 Water vapor distribution across the cell
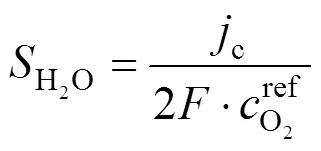
Therefore, the oxygen concentration directly affects the cell performance. The present interpretation predicts the delivery of a lower oxygen concentration through the less porous (0.3) gas diffusion layer.
Figure 4 plots the mass fraction distribution of water vapor across the fuel cell. The water vapor fraction increases linearly with distance along the gas channel and the gas diffusion layer because oxygen is delivered from the channel through the diffusion layer to the reactive sites where it reacts and generates water. As established above, the concentration of water vapor is maximal at the catalyst layer.
3.2 Two-dimensional model
A novel tapered gas channel is designed to study the effects of mass transport on cell performance using the two-dimensional model. The gas channel with the tapered cross section is at the outlet in the side of the cathode. The oxygen is forced to enter the gas diffusion layer to reach the catalyst layer such that the electrochemical reaction can be preceded to accelerate the oxygen to the exhaust where water accumulates. The tapering ratio is defined as the tapered cross section at the gas channel outlet divided by the cross section at the inlet without tapering. The inlet velocity is specified as a function of the average current density,avg, the area of the reaction surfacecat, the cross- section areachof the channel, and the stoichiometric flow rate. The stoichiometric flow rateis set to provide sufficient oxygen to the chemical reaction at the catalyst layer. The specified inlet velocity is determined using:


Figure 7 plots the distribution of oxygen mass fraction at the interface between the gas channel and the gas diffusion layer of the tapered channels. The oxygen mass fraction on the cathode side decreases along theaxis due to the reduction reaction of oxygen. The results indicate that the highest oxygen mass fraction is found when the tapering ratio is 25%. In fact, a less tapered gas channel is associated with a higher flow velocity. Accordingly, the rate of consumption at the tapering ratio of 25% is the lowest, because the flow velocity in the channel is too low to allow the reaction. Furthermore, the largest pressure drop is found for a tapering ratio of 25% (Fig. 8). The pressure drop on the cathode side is a key operating parameter to determine the cell efficiency, confirming that more oxygen can be forced into the gas diffusion layer farther downstream in the channel.
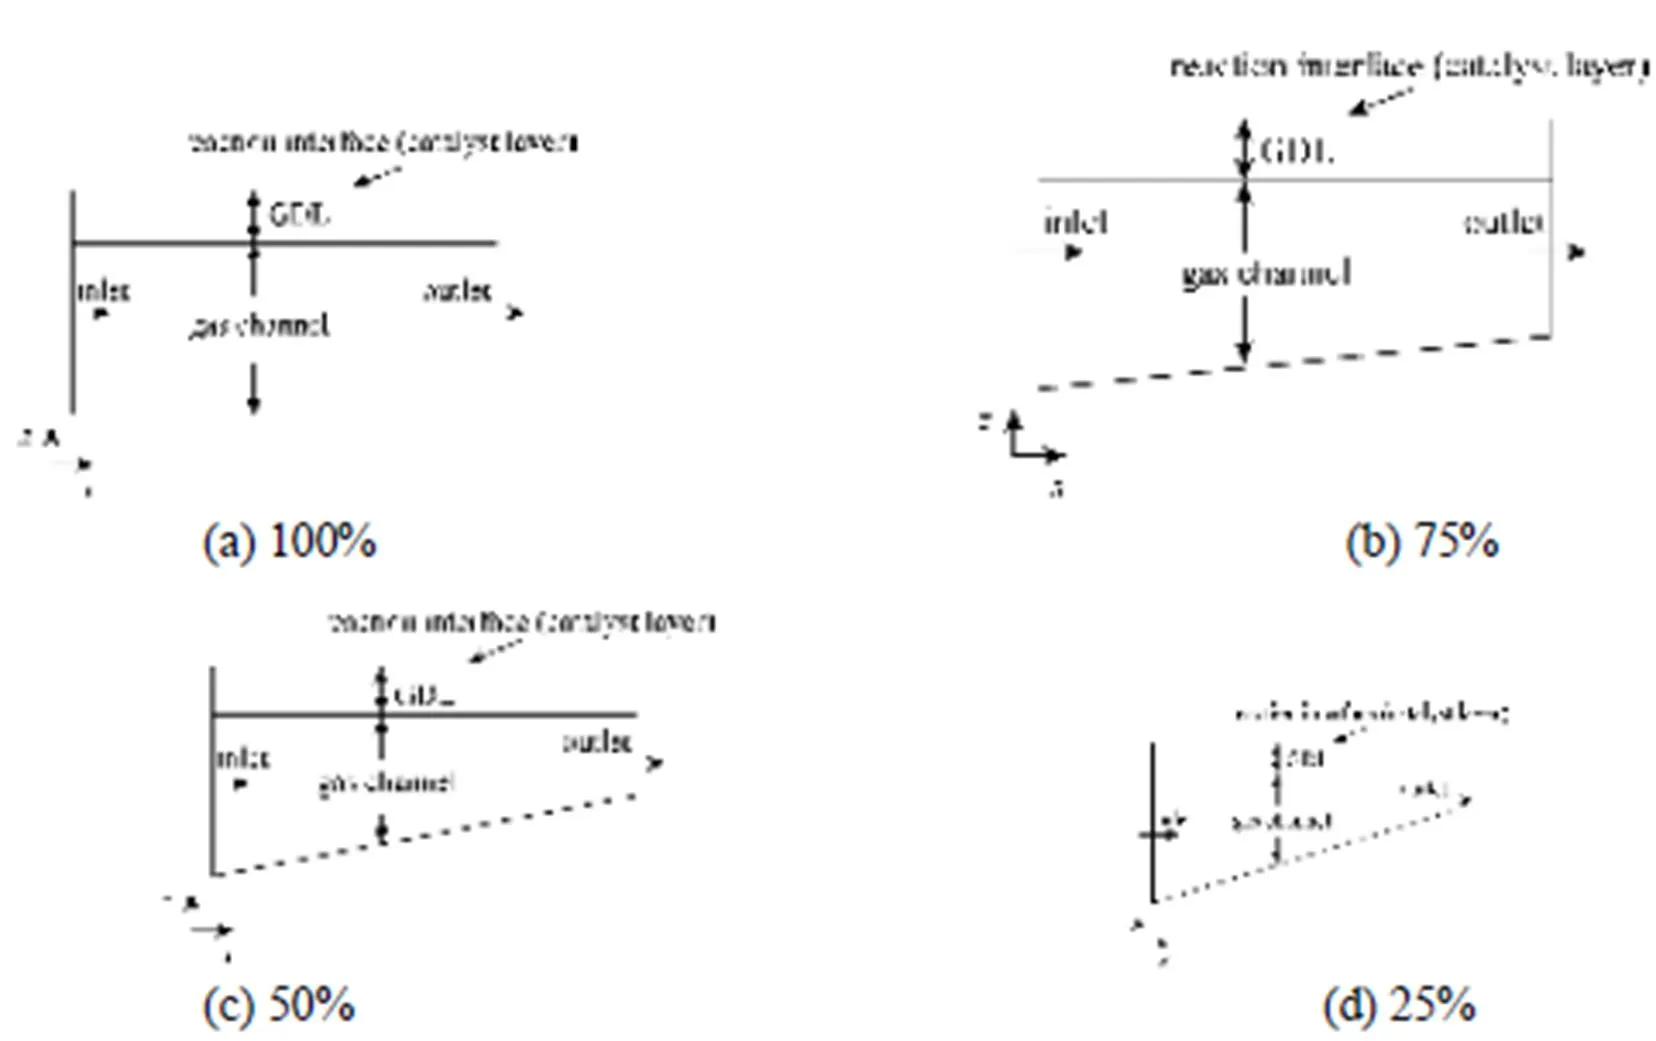
Figure 5 Schematic configuration of the 2-D model with different tapering ratios
Figure 6 Oxygen distribution along the gas channel with different tapering ratios
Water management also importantly affects the performance of PEMFC. To study the effect of the tapered gas channel on the water content distribution, Figs. 9 (a)-(d) present the water distribution along the gas channel for different tapering ratios. The water content is the highest in the diffusion layer when the cell is operated with dry gas at the cathode and oxygen is consumed to produce water in the catalyst layeran electrochemical reaction. This process is plausible since water is expected to accumulate downstream near the outlet gas channel as the oxygen is gradually exhausted. Fig. 10 plots the water distribution at the interface between the gas channel and the gas diffusion layer along the gas channel for four tapering ratios. The lowest water concentration at the outlet of the gas channel is found when the tapering ratio is 25%. As mentioned above, the lowest oxygen consumption in this tapered channel results in the least water to be produced and accumulated. Additionally, a high flow velocity leads to a rapid exhaustion of water. For the above reasons, less water is accumulated as the tapering ratio of the gas channel decreases, implying that the use of the tapered flow field effectively eliminates water accumulation.
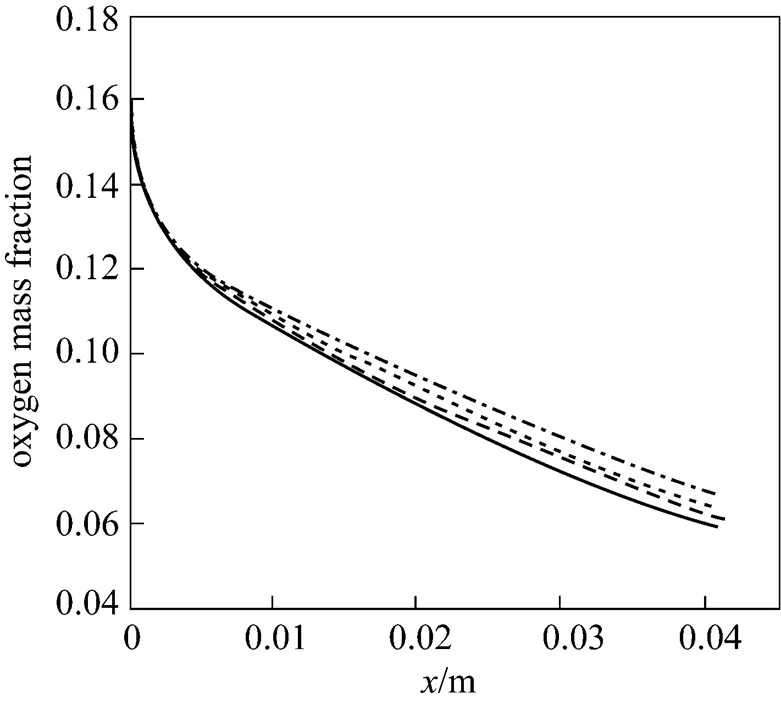

Figure 9 Water distribution along the gas channel with tapering ratios
Figure 11 plots the numerically predicted polarization curves used in the two-dimensional models with various tapered channels. The predicted cell performance does not take into account the liquid water. At low current density, the four tapered channels perform similarly, because sufficient oxygen is available for the reaction to proceed at the initial over-potential. This fact explains why the limiting current density increases as the tapering ratio of the channel decreases. The channel tapering ratio of 25% provides the best performance. Although this channel has the highest oxygen mass fraction, it is also associated with a much larger pressure drop to force non-required oxygen into the catalyst layer, enhancing the electrochemical reaction. Additionally, a less tapered channel is associated with less water accumulation in the flow field, reflecting the fact that a tapered gas channel configuration provides sufficient oxygen to the downstream region of the channel and forces it to the catalyst layer. Fig. 12 plots the comparison of the cell polarization curves obtained using one-dimensional and two-dimensional models at the same open cell voltage (1.1 V). The activation polarization loss is not as obvious in these two polarization curves as experimental ones. Such a loss can be obtained using the Tafel equation, which explains that the voltage loss is governed by the sluggish kinetics of the oxygen reduction reaction at low current density. However, the activation over-potential in this study considers only the oxygen reduction reaction in the cathode side of the simulation, and the over-potential is the input parameter fixed in the calculation of each current density in this simulation. In the flow field, the flow is steady-state, incompressible, laminar and isothermal. All gases are ideal gases and the water exists in the cathode side as vapor water. Additionally, sufficient oxygen sustains the electrochemical reaction at the initial over-potential. Under the above conditions, the average current density is calculated using Eq. (25) and is very favorable. Therefore, the activation losses associated with these two polarization curves are smoothed out.
In the one-dimensional model, the inlet oxygen concentration is held constant (0.17) at the wall of the gas channel, and the mass transport depends only on the diffusion. However, in the two-dimensional model, the distribution of the concentration of oxygen changes at the wall of the gas channel in a manner that depends on the convection effect. Therefore, the oxygen concentration is no longer constant and decreases along the wall of the gas channel. This fact indicates that the one-dimensional model predicts a larger oxygen concentration at the catalyst layer than the two-dimensional model.

3.3 Three-dimensional model
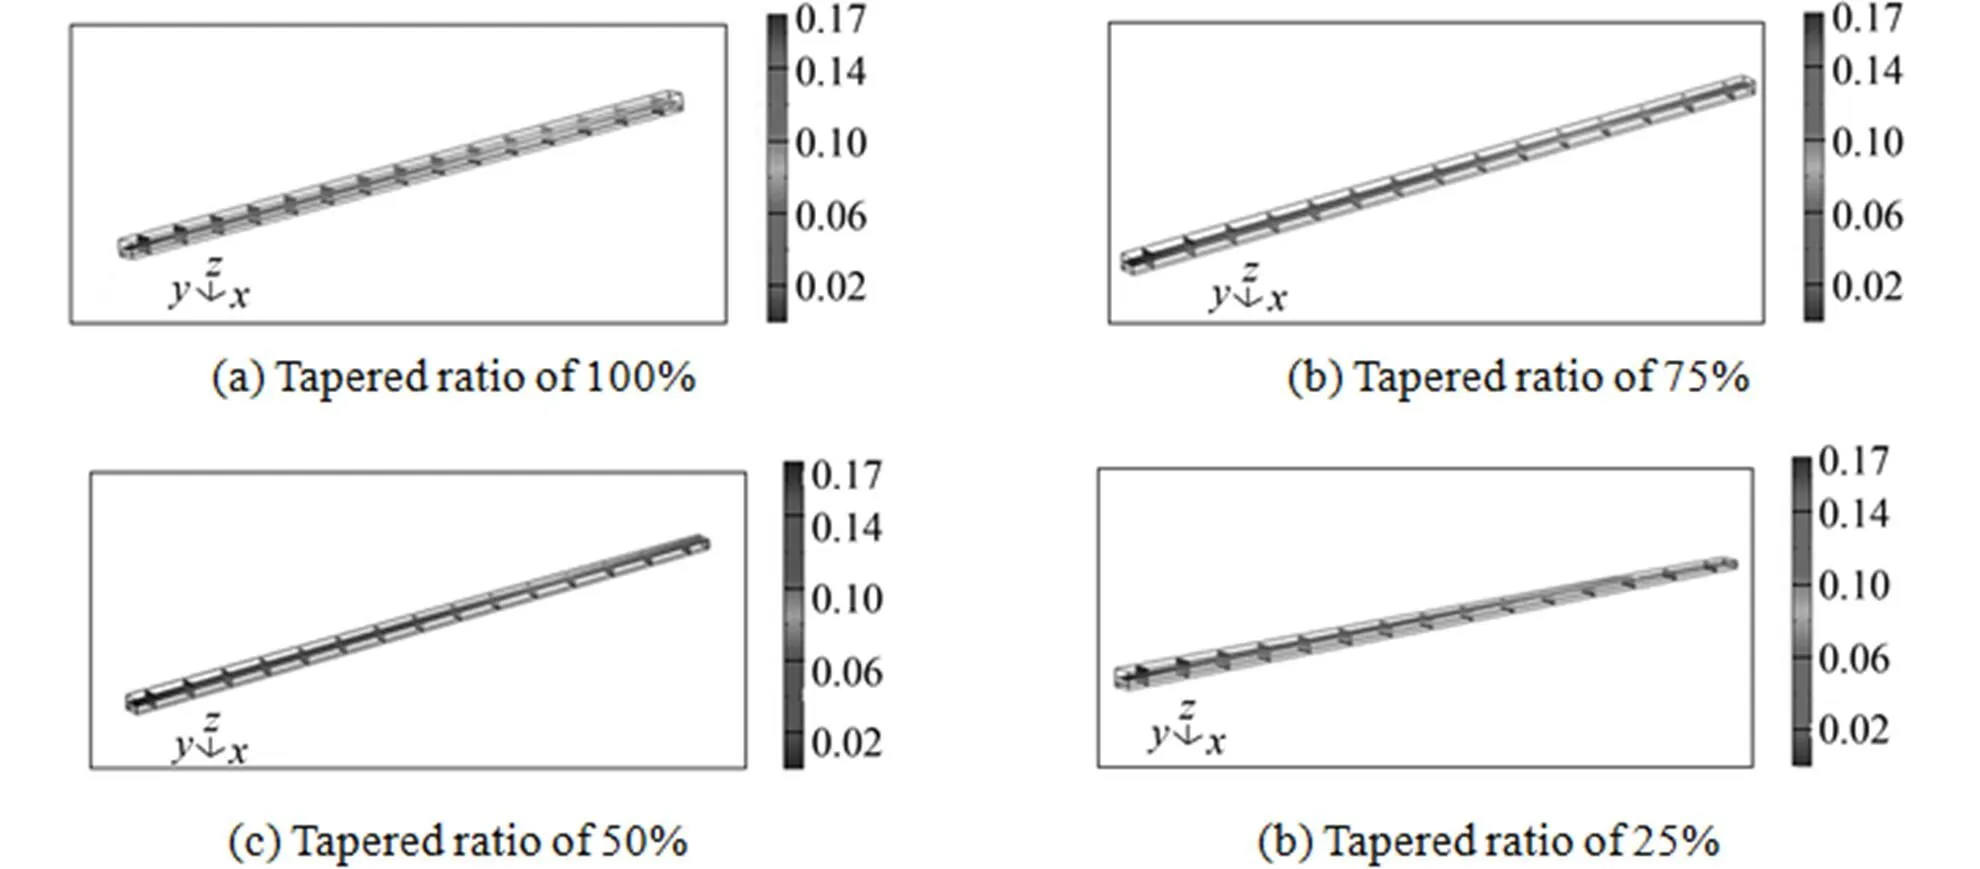
Figure 13 Oxygen distribution along the gas channel with tapering ratios
Figures 16 (a)-(d) plot the water distribution along the four tapered gas channels at various axial points. At fixed over-potential, the water content increases from inlet to outlet. The results show that reducing the oxygen concentration increases the accumulation of water downstream. Fig. 17 plots the water distribution at the interface between the four gas channels and the gas diffusion layer. The results show that the concentration of water is the maximal at the catalyst layer adjacent to the outlet gas channel, and that the water diffuses backward from the gas diffusion layer to the gas channel, because the consumption of oxygen produces water by an electrochemical reaction, and the oxygen concentration is the lowest near the outlet along the gas channel. Therefore, water accumulates in the outlet gas channel. The concentration of water at the outlet of the gas channel is the lowest when the tapering ratio is 25%. These results are similar to those obtained using the two-dimensional model.
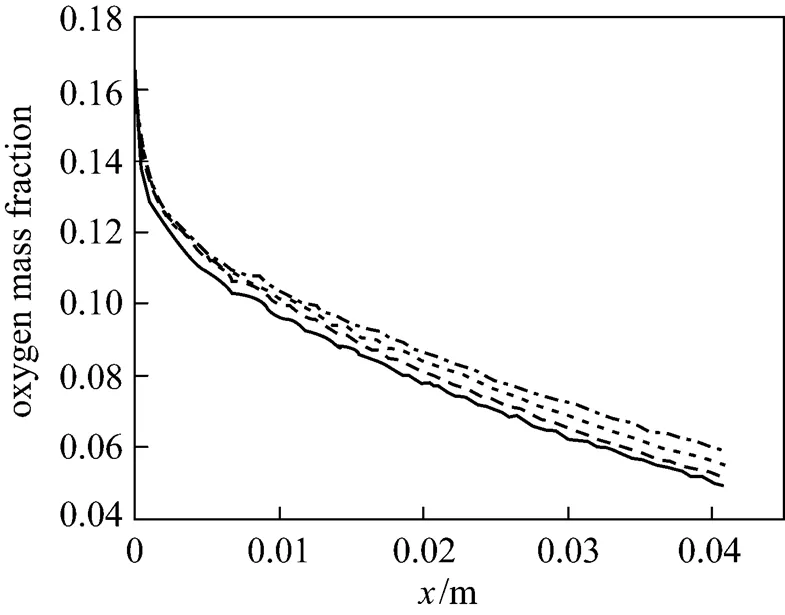

Figure 16 Water distribution along the gas channel with tapering ratios
Figure 18 plots the polarization curves obtained numerically using the three-dimensional model for the variously tapered channels. The model predicts that the limiting current density is the highest when the tapering ratio is 25%. The least tapered gas channel forces the oxygen into the gas diffusion layer most effectively, and optimizes the cell performance. The sufficient mass transport of reactants to the catalyst layer causes the least tapered gas channel to be associated with a higher current density. The effect of the relative humidity of the cathode is not as serious because the forced convection mechanism of the least tapered channel exhausts accumulated water. Fig. 19 plots the cell polarization curves obtained by the two-dimensional and three-dimensional models. The former is better than the latter because the current density obtained using the three-dimensional model treats the reaction interface as a plane, while the two-dimensional model treats it as a line.
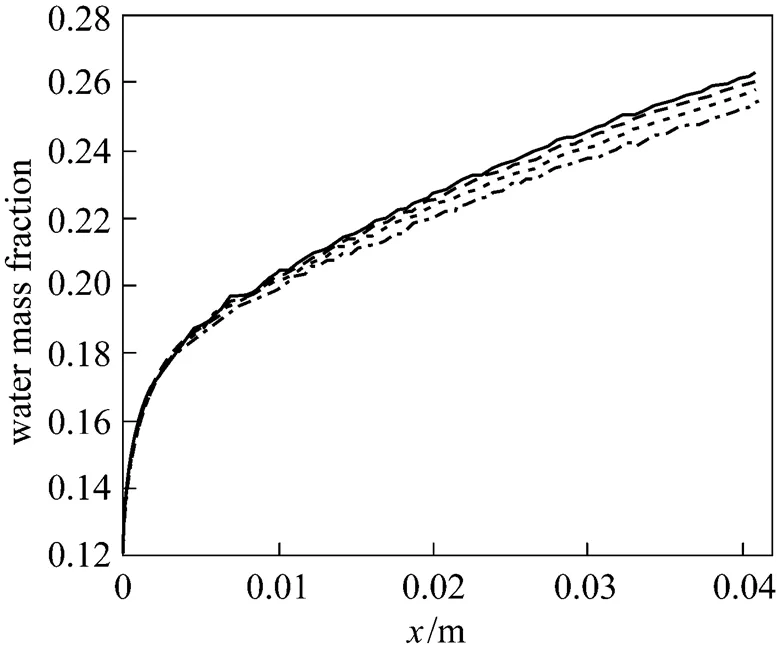

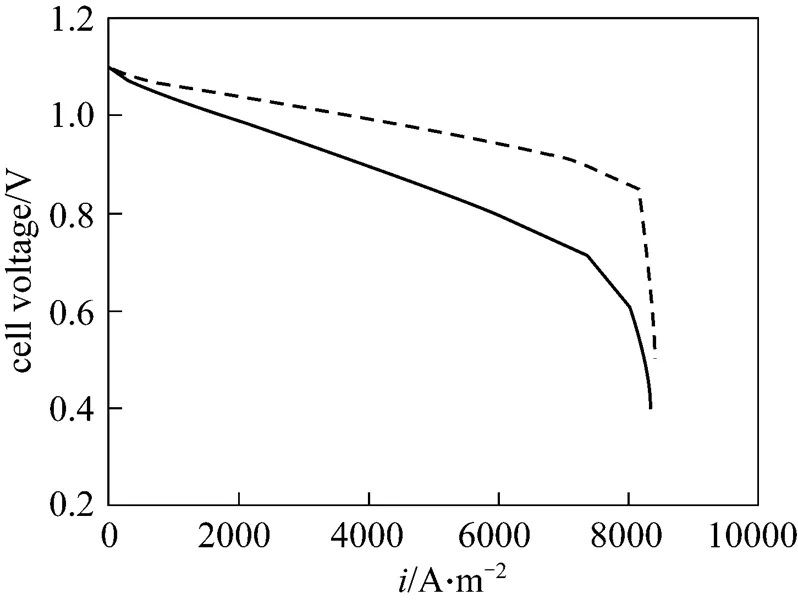
Figure 20 Cell polarization curves in two tapering ratios (exp.) ratio:■ 100%;● 25%
3.4 Comparison with experiment
This study investigated the reactant gas transport and cell performance of a PEMFC with a flow field in a tapered channel. The results of the numerical simulation are validated by comparison with experimental data. Fig. 20 displays the experimentally measured performance of PEMFC with designed gas channel tapering ratios of 100% and 25% at the cell temperature of 333 K. The exit pressures of the anode and cathode sides are 101 kPa. The flow field in the numerical model is a single straight gas flow channel, whereas the experiment uses parallel flow channels with an active area of 25 cm2. The effect of water flooding is neglected in the simulation of the cathode side. These two reasons explain why the numerical data are better than the experimental ones. However, the experimental results help to elucidate the phenomenon associated with the two tapered gas channels at various cell voltages. The tapered gas channel with the smaller tapering ratio clearly provides better performance. In general, for a parallel flow field, oxygen is transferred laterally into the backing layerdiffusion, revealing that reducing the tapering of the flow channels significantly promotes fuel transport. The novel parallel flow field provides a high oxygen transfer rate to the gas diffusion layer because of the forced convection, which increases the oxygen transport rate and ensures that enough oxygen is provided for the catalyst layer to maintain the electrochemical reaction. This phenomenon follows from the limitation on the mass transfer of oxygen. The forced convection can also efficiently remove the excess liquid water produced by the electrochemical reaction. Hence, this mechanism improves water management and enhances the cell performance.
4 CONCLUSIONS
The chief contribution of this work is to develop a tapered channel with a novel design for flow fields in proton exchange membrane fuel cells. Computational multi-dimensional models are presented. The tapered gas channels are exploited to enhance convection and thus to improve mass transport between the gas channel and the gas diffusion layer. The results obtained using the models are summarized to explain the distributions of oxygen, water, and pressure drop across the fuel cell. Furthermore, the polarization curves of differently tapered gas channels are compared.
The one-dimensional model assumes that the oxygen concentration is constant. This study predicts that a lower oxygen concentration passes through a less porous gas diffusion layer and the amount of water vapor increases linearly with the progress of the reduction reaction to produce water in the adjacent gas channel and gas diffusion layer. The catalyst layer has the highest concentration of water vapor.
The two-dimensional and three-dimensional models are used to elucidate the effects of oxygen mass fraction, and the water and pressure drop distributions at the interface between the gas channels with four tapering ratios (100%, 75%, 50% and 25%) and the gas diffusion layer. The least tapered gas channel forces the most reactant gas into the gas diffusion layer and the catalyst layer because of the largest pressure drop, leading to the highest limiting current density and the best cell performance.
Finally, the experimental data obtained at various voltages demonstrate that a tapered flow channel improves the performance. According to experimental results, the optimal tapering ratio is 25%.
ACKNOWLEDGEMENTS
.
NOMENCLATURE
catsurface area of chemical reaction, m2
chcross section area of channel, m2
D,jdiffusion coefficient, m2·s-1
avgaverage current density, A·m-2
ccurrent density, A·m-2
ppermeability of GDL, m2
molecular mass, kg·mol-1
pressure, Pa
temperature, K
velocity ofdirection, m·s-1
velocity ofdirection, m·s-1
velocity ofdirection, m·s-1
porosity
over-potential, V
viscosity, m2·s-1
air density, kg·cm-3
tortuosity
Superscripts
ref reference
1 Hu, M.R., Zhu, X.J., Gu, A.Z., “Simulation of the internal transport phenomena for PEM fuel cells with different modes of flow”,...., 12, 14-26 (2004).
2 Shao, Q.L., Wei, D., Gao, G.Y., Zhu, X.J., “Dynamic thermal model and temperature control control of proton exchange membrane fuel cell stack”,...., 13, 218-224 (2005).
3 Zhang, S.S., Yu, H.M., Zhu, H., Hou, J.B., Yi, B.L., Ming, P.W., “Effects of freeze/thaw cycles and gas purging method on polymer electrolyte membrane fuel cells”,...., 14, 802-805 (2006).
4 Weber, A., Darling, R., Meyers, J., Newman, J., Handbook of Fuel Cells—Fundamentals, Technology and Application, John Wiley & Sons, USA, 47-69 (2003).
5 Springer, T.E., Zawodzinski, T.A., Gottesfeld, S., “Polymer electrolyte fuel cell model”,, 138, 2334-2342 (1991).
6 Bernardi, D.M., Verbrugge, M.W., “Mathematical model of a gas diffusion electrode bonded to a polymer electrolyte”,., 37, 1151-1163 (1991).
7 Gurau, V., Barbir, F., Liu, H., “An analytical solution of a half-cell model for PEM fuel cells”,, 147, 2468-2477 (2000).
8 Futerko, P., Hsing, I.M., “Two-dimensional finite-element method study of the resistance of membranes in polymer electrolyte fuel cells”,, 45, 1741-1751 (2000).
9 Hum, B., Li, X., “Two-dimensional analysis of PEM fuel cells”,, 34, 205-215 (2004).
10 Jung, H.M., Lee, W.Y., Park, J.S., Kim, C.S., “Numerical analysis of a polymer electrolyte fuel cell”,, 29, 945-954 (2004).
11 Dutta, S., Shimpalee, S., Van Zee, J. W., “Numerical prediction of mass-exchange between cathode and anode channels in a PEM fuel cell”,, 44, 2029-2042 (2001).
12 Berning, T., Lu, D.M., Djilali, N., “Three-dimensional computational analysis of transport phenomena in a PEM fuel cell—A parametric study”,, 124, 440-452 (2003).
13 Hwang, J.J., Chen, C.K., Savinell, R.F., Liu, C.C., Wainright, J., “A three-dimensional numerical simulation of the transport phenomena in the cathodic side of a PEMFC”,, 34, 217-224 (2004).
14 Weng, F.B., Su, A., Jung, G.B., Chiu, Y.C., Chan, S.H., “Numerical prediction of concentration and current distributions in PEMFC”,, 145, 546-554 (2005).
15 Liu, X., Tao, W., Li, Z., He, Y., “Three-dimensional transport model of PEM fuel cell with straight flow channels”,, 158, 25-35 (2006).
16 Yamada, H., Hatanaka, T., Murata, H., Morimoto, Y., “Measurement of flooding in gas diffusion layers of polymer electrolyte fuel cells with conventional flow field”,, 153, 1748-1754 (2006).
17 Yan, W.M., Yang, C.H., Soong, C.Y., Chen, F., Mei, S.C., “Experimental studies on optimal operating conditions for different flow field designs of PEM fuel cells”,, 160, 284-292 (2006).
18 Su, A., Weng, F.B., Hsu, C.Y., Chen. Y.M., “Studies on flooding in PEM fuel cell cathode channels”,, 31, 1031-1039 (2006).
19 Ferng, Y.M., Su, A., “A three-dimensional fuel-cell CFD model used to investigate the effects of different flow channel designs on PEMFC performance”,, 32, 4466-4476 (2007).
20 Wang, X.D., Duan, Y.Y., Yan, W.M., “Numerical study of cell performance and local transport phenomena in PEM fuel cells with various flow channel area ratios”,, 172, 265-277 (2007).
2008-09-29,
2009-02-17.
the National Science Council (NSC 97-222-E-009-067).
** To whom correspondence should be addressed. E-mail: chenchung.me93g@nctu.edu.tw
猜你喜欢
杂志排行

Chinese Journal of Chemical Engineering的其它文章
- Design and Performance Analysis of Micro Proton Exchange Membrane Fuel Cells*
- Isolation of Cordyceps ophioglossoides L2 from Fruit Body and Optimization of Fermentation Conditions for Its Mycelial Growth*
- Efficient and Comprehensive Utilization of Hemicellulose in the Corn Stover*
- Simulating Surface Aeration Systems at Different Scale of Mixing Time*
- Kinetics of Reaction-Crystallization of Struvite in the Continuous Draft Tube Magma Type Crystallizers—Influence of Different Internal Hydrodynamics
- Preparation and Characterization of Tungsten-substituted Molybdophosphoric Acids and Catalytic Cyclodehydration of 1,4-Butanediol to Tetrahydrofuran*