Experimental Investigation of Dust Deposit within Ceramic Filter Medium during Filtration-Cleaning Cycles*
2009-05-12CHIHuachang迟化昌JIZhongli姬忠礼SUNDongmei孙冬梅andCUILishan崔立山
CHI Huachang (迟化昌), JI Zhongli (姬忠礼), SUN Dongmei (孙冬梅) and CUI Lishan (崔立山)
Experimental Investigation of Dust Deposit within Ceramic Filter Medium during Filtration-Cleaning Cycles*
CHI Huachang (迟化昌)1,2, JI Zhongli (姬忠礼)1,**, SUN Dongmei (孙冬梅)1and CUI Lishan (崔立山)1
1Department of Mechanical and Electrical Engineering, China University of Petroleum, Beijing 102249, China2Department of Engineering and Construction, China National Oil & Gas Exploration and Development Corporation, Beijing 100034, China
The penetration and deposit of particles within the medium is thought to be one reason that the residual pressure drop of the rigid ceramic filter increase with cycle number. In this study, the change in the microstructure of a single layer ceramic filter candle during filtration-cleaning cycle was observed by scanning electron microscope (SEM) and the resistance property of the filter was monitored accordingly. The experimental results show that there exists a serious dust deposit within the filter medium, especially at the surface region. This should be responsible for the decrease of the filter permeability. The deposit law of dust in the filter medium during filtration-cleaning cycle was then studied by measuring the deposit depth, the deposit amount, the particles distribution within the medium, the size distribution of deposited particles, and so on. Particles migration and fine particles penetration were found to be the main reasons, for which dust deposit within the filter medium became aggravated with cycle number. Based on a differential form of Ergun equation, an expression for the pressure drop of a used ceramic filter was developed with a good agreement with experimental results. Then, the effect of dust deposit on the residual pressure drop was studied at the different face velocities and dust sizes. It was found that face velocity and dust size significantly influence dust deposit within filter medium, and then the operation performance of the filter.
ceramic filter, microscopic analysis, resistance, dust deposit, scanning electron microscope
1 INTRODUCTION
The rigid ceramic filter, such as filter candle, has emerged as the most promising choice for hot gas cleaning because of its high filtration efficiency and ability to withstand attack by aggressive gas at high temperature [1, 2]. For the filtration process to continue, the deposited dust on ceramic filter is removed by pluse gas cleaning. The residual pressure drop (the pressure drop across the filter just after cleaning), however, exceeds the pressure drop of the virgin filter element because of a residual dust cake and/or particles, which have penetrated into the filter medium and have not been removed by the cleaning action [3-6]. This residual pressure drop might hence continue to increase from cycle to cycle. In normal cases, it will reach a relative stable value after a so-called “conditioning” period. However, a stable operation condition will never be reached for some “active dusts”.
For comprehensive understanding of the filter pulse cleaning process, a lot of research has been done, which can be broadly categorized based on the pulse cleaning system design [1, 7-9], the filter candle properties [10], dust properties [11], patchy cleaning [12-14], and so on. But, little attention was paid to the dust penetration in the filter element wall. Dust deposit within the filter medium, which should be the key reason that the resistance of the filter increases with increasing cycle number, has been found in not only bench-scale filter units [15] but also in some industrial systems [4, 16]. The deposit structure of dust within the filter medium is unstable and easy to be destroyed in the analysis procedure. In 1990, Schmidt. [17] presented an experimental procedure for preparing a dust cake for microscopic observation and investigated the compression of dust cakes deposited on bag filter media [18]. Aguiar and Coury [19] used the similar method to directly measure the cake porosity on a fabric filter.
In this study, the change in the local structure of the filter medium after some cycles was studied in detail to understand the mechanism that the flow resistance increases with increasing cycle number. In normal case, a membrane-coated silicon carbine filter candle is used for hot gas cleaning. The dust particles that can penetrate into the medium are few, so a longer experimental period is needed to study dust deposit within the filtration membrane. Because the filtration membrane is the rigid porous structure, the evolution of the residual pressure drop for a membrane-coated filter should follow a similar trend as a single layer filter candle. In this study, a single layer ceramic filter candle that has a larger mean pore size was used.
2 EXPERIMENTAL
2.1 Set-up of filtration system
Figure 1 illustrates the gas filtration rig. A constant raw dust concentration (3 g·m-3for all runs) was created by a dust feeder (BEG-1000, Palas GmbH, Germany). The dusty gas stream mixed with the clean ambient air was drawn through the filter candle by a vacuum pump. The filter medium was a silicon carbide matrix with an averaged porosity of 36% and a mean Feret pore diameter of 44.2 μm. The filter candle of 1.5 m long with an outer diameter of 0.06 m and a wall thickness of 0.01 m was vertically mounted on the tube sheet. The face velocity was measured by a pitot-tube and kept constant for a certain test by adjusting the valve mounted on the filter downstream. After a specific interval, a pulse cleaning jet produced by a solenoid valve (RCAC25T, Goyen GmbH, Australia) was triggered by a pulse generator (TBMM10, Goyen GmbH, Australia) to clean the dust cake deposited on the surface of the filter candle. In this experiment, a time interval of 5 min and pulse duration of 300 ms was used. For a certain run, the cleaning pressure () was kept constant.
During filtration process, the residual pressure drop (Δr) was measured by a U tube manometer. After some cycles (20 in the present work), the filter candle was taken out from the filter unit and a small part of filter element (~0.02 m) was cut off for microscopic analysis. Before analysis, the flow resistance of the used filter medium (Δb) was tested by removing its residual dust cake manually. The remaining filter candle was resealed and used continually to do filtration experiment. Considering the suction capacity of the vacuum pump used, a terminal residual pressure drop of the filtration experiment was set at approximately 25 kPa.
The experimental dust was calcium carbonate particles [97% (by mass) CaCO3, 0.15% HCl insoluble content]. Fig. 2 illustrates the size frequency distributions of three kinds of calcium carbonate dusts used, whose corresponding volume median diameters were 4.98, 7.33, and 11.98 μm, respectively, measured by Welas®optical particle counter (Palas GmbH, Germany). If no special statement is given, the finer dust of volume median diameter of 4.98 μm was used.
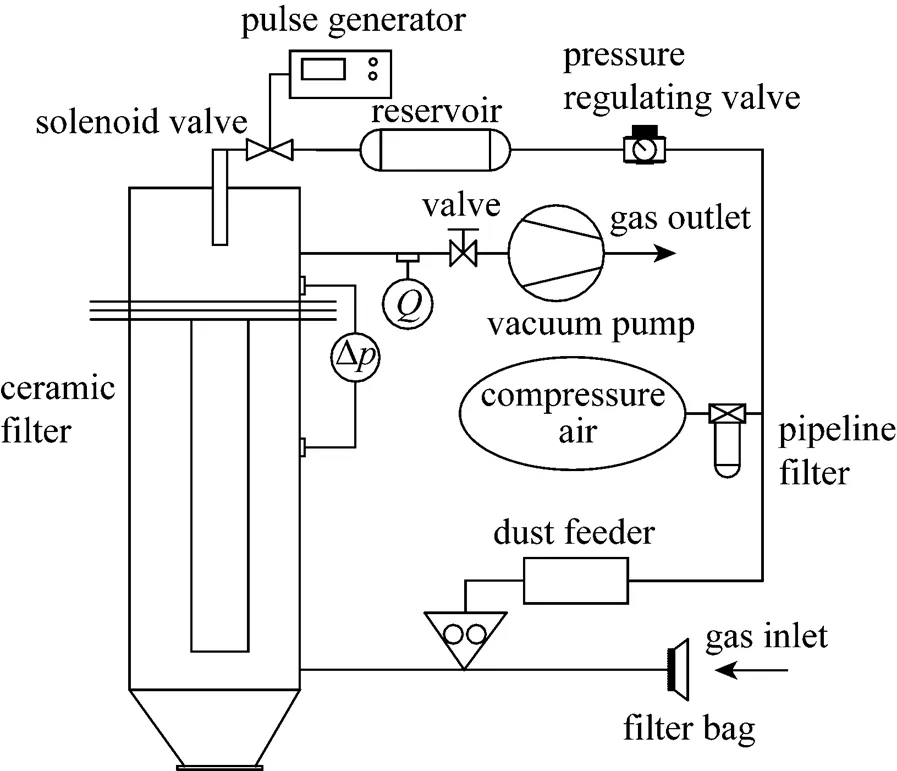
Figure 1 General view of the filtration equipment
2.2 Microscopic analysis method of porous filter element sample
In order to study dust deposit within the filter medium, the filter candle samples after some cycles were subjected to a structural analysis. Referring to the former researches [17, 19], a modified procedure for the preparation of the microscopic observation sample was developed, in which Spurr resin was used as the embedding medium. Before impregnating with Spurr resin, the sample was prefixed by a single- component instant cyanoacrylate adhesive to avoid particle re-arrangement at the embedding process. A scheme of the rig used for the prefixation is shown in Fig. 3. The heating temperature was approximately 100°C. The gas flow velocity in the prefixation procedure was below the face velocity to avoid disturbances in the particles deposit structure. After prefixing and embedding, the sample was cured in the oven for 24 h at 75°C. Then, the embedding sample was sectioned, polished, and etched to prepare for scanning electron microscope (SEM) analysis. With the aid of this elaborate and time-consuming preparation technique, scanning electron micrographs could be taken of specific planes at various different locations over the filter medium to derive quantitative information regarding the local structure. A Cambridge S-360 scanning electron microscope was used here.

Figure 3 Scheme of the rig used for the filter candle sample prefixation
Figure 2 Frequency volume distribution of the CaCO3dustsm/μm: ■ 4.98; ★ 7.33;▼ 11.98
3 RESULTS AND DISCUSSION
3.1 Microscopic analysis of dust deposition within the used filter medium
The deposit amount of dust () in a section of the filter medium was defined as the areal percent of the deposited particles. Considering the size difference and the uneven distribution of deposited particles in a section, two micrographs of different magnifications were taken as shown in Fig. 4. In Fig. 4 (a), the lighter colored zones with visible boundary correspond to the ceramic particles composed of the filter medium, whereas other parts correspond to the pore region of the filter medium that was filled by the cured embedding medium. There are some small holes within the pore region of Fig. 4 (a), which correspond to the larger deposited particles and/or the accumulations of finer particles. Furthermore, there are some grayish blocks within the pore region of Fig. 4 (a), which correspond to the deposit zone formed by finer particles. One such micrograph of the finer particles deposit zone taken at high magnification is shown in Fig. 4 (b). The dark zones in Fig. 4 (b) correspond to the finer particles deposited in the filter medium, which have been etched away by diluted hydrochloric acid. The value ofin a section can be then calculated by the following formula.

whered,z, andtare the area of the etched holes formed by the larger deposited particles and/or the accumulation of finer particles, the area of the deposit zone formed by dispersed finer particles, and the total area, respectively, in a micrograph of low magnification as Fig. 4 (a), andis the areal fraction of the etched holes formed by finer particles in a micrograph of high magnification as Fig. 4 (b). Here, the magnifications of the micrographs were 100 and 2000, respectively. To eliminate the error, five micrographs were taken for each magnification and a mean value ofwas used.
Figure 4 Typical micrograph of the filter medium with deposited particles taken at different magnifications
Figure 5 shows the change in the deposit amount of dust for a fixed section of the filter medium during filtration-cleaning cycle. The deposit situations in the medium circumferential sections were different for the different radial positions. Here, the section of 0.2 mm under the filter surface was analyzed. Two steps might be distinguished in the evolution of the deposit amount of dust as a function of cycle number. During the first step, the evolution was quick, whereas, in the second, the increase became slow and the value tended to a constant. The appearance of a plateau verified that the dust deposit structure gradually became steady, which could be associated with the action of the residual dust cake. The clogging of the filter medium on the one hand caused the resistance increasing, and on the other hand, weakened the pulse cleaning intensity. Then, during filtration-cleaning cycle, dust cake became thick and the residual pressure drop continued to increase. Moreover, a strong dependence between the deposit amount of dust and the face velocity was noticeable as shown in Fig.5. With the increase of face velocity, more dust particles penetrated into the filter medium for a same cycle number.


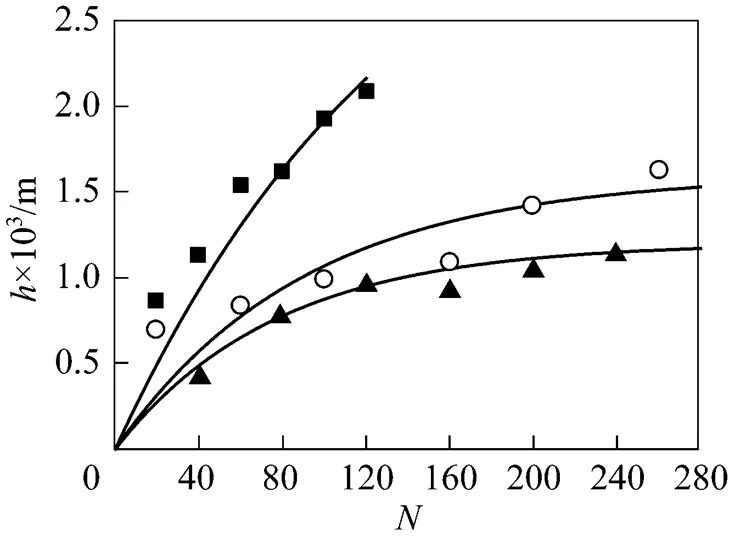
During the filtration-cleaning cycles, at the initial stage, only the pores located at the surface region of the filter medium were clogged by deposited particles, whereas those at the deeper part were still virgin. When the operation period was prolonged, many particles were also found at the deeper part. Fig. 6 displays the change in the deposit depth of dust within the filter medium over cycle number. Here, the deposit depth () means the radial width of the deposit layer in the filter medium, where no obvious etched holes were found in the interface with the clean layer when the magnification was 2000. It can be seen that, at the later stage, the increase of deposit depth becomes gradually slow, which should follow the same reason with the deposit amount of dust. In addition, as shown in Fig. 6, when the face velocity was higher, the deposit depth increased more quickly. The virgin case at the initial stage might also be caused by the error in SEM analysis because the dust size was only micro- grade or sub-micro-grade.
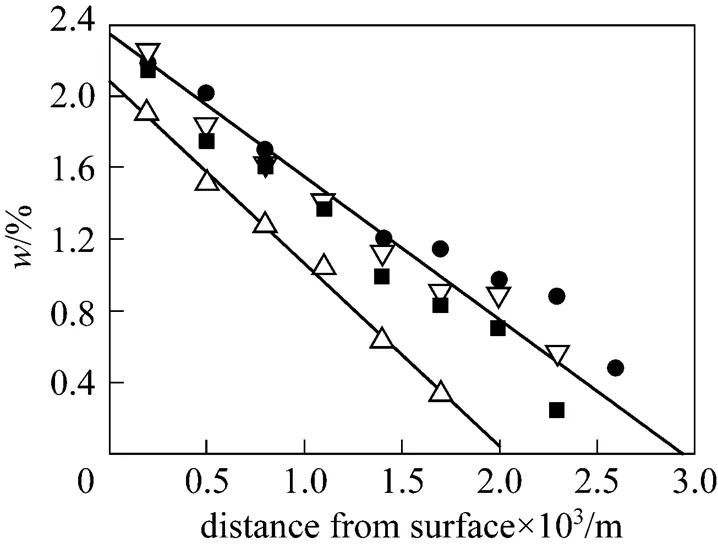
Figure 7 illustrates the radial distribution of deposited particles within the filter medium. The flow resistance of the filter medium (Δb) in Fig. 7 were measured under the face velocity of 0.04 m·s-1, which were different each other because of the constant sampling interval and the different operation conditions. A linear decrease in the deposit amount of dust in the direction away from the filter surface was noticed for all cases although the different face velocities were used. Furthermore, the deposit amount of dust in the used filters having a close Δbof 10 kPa decreased along an almost same line, whereas the case of 7 kPa decreased along another line. Hence, the deposit amount of dust in the different sections was distributed linearly over the depth and was independent of face velocity under the given conditions.
For getting an explicit understanding of dust deposition within the filter medium, the size distribution of the deposited particles was studied by analyzing the micrographs as Fig. 4. Fig. 8 specifies the selected parameters of the deposited particles size distributions in the fixed section determined over cycle number. In order to characterize the width of the respective areal distribution densities2(), the location parameters20,2and80,2have been included, along with the areal median parameter50,2. The location parameters are defined as

whereis particle size,is dimension,q() is the distribution density.
According to Fig. 8, the size of deposited particles for the fixed section became smaller with the increase of cycle number. The appearance of this situation is just because more of larger particles were captured by the densified deposit layer in the filter medium and the thickened dust cake.
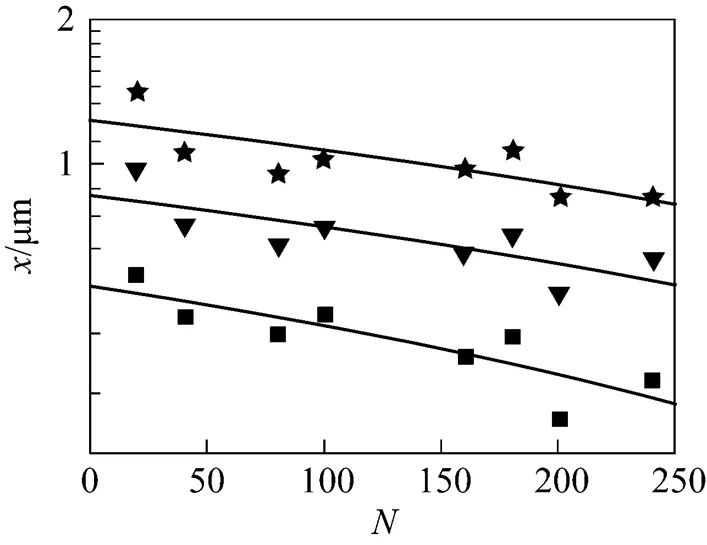
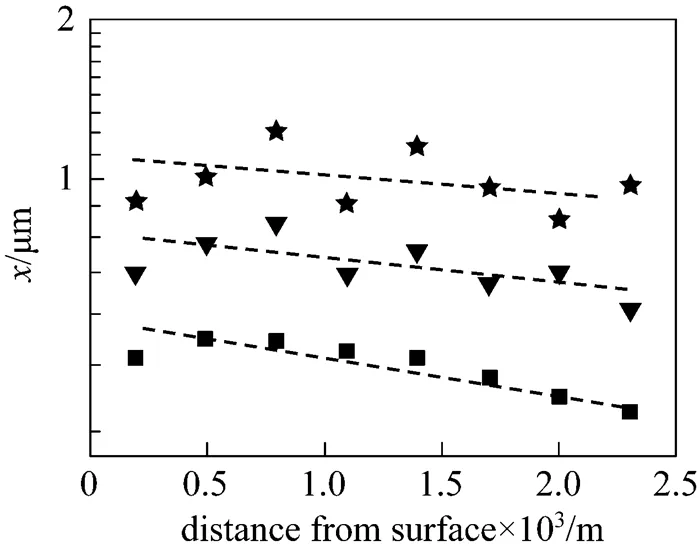
Figure 9 shows the distribution of deposited particles size over the depth of the filter medium for the used filter element. The sketched lines in Fig. 9 have only been included to indicate the tendencies. As expected, the proportion of the smaller particles (20,2) increased towards the filter inner wall, which arose mainly from the fine particles penetration and migration. However, no significant differences were found in the average-sized (50,2) and large particle diameters (80,2) over the filter medium depth. The mean value of50,2was approximately 0.69 μm. Because more large particles would be captured by the dust cake and/or the deposit layer within the filter medium with the increase of cycle number, the appearance of some larger particles in the depth of the medium should come mainly from the migration of the surface region. So, particles re-entrainment phenomenon because of the drag of air flow was presented in the deposit layer.
3.2 Effect of dust size on dust deposit within the filter medium
Figures 10 and 11 show the effect of experimental dust size on the deposit amount and deposit depth of dust within the filter medium, in which the same operation condition was used. The size distribution of the three kinds of dust used is shown in Fig. 2. With increasing cycle number, the deposit amount of dust for the fixed section, just like the deposit depth, steeply increased at the initial stage and gradually tended to stability for all three kinds of dust. It can be seen that dust size had remarkable influence on the increasing velocity and the stable value, whether for the deposit amount or the deposit depth. Unexpectedly, the deposit amount of dust for the fixed section increased with the increase of the experimental dust size. The location of the analyzed section within the filter medium should be responsible for it. Because the mean pore diameter of the filter medium was 44.2 μm and much larger than the experimental dust size, more of bigger particles could penetrate into the surface layer of the filter medium when the experimental dust size was larger. According to the experimental results, the mean values of areal medium diameter of deposit particles within the filter medium were 0.69, 1.34, and 1.52 μm, respectively, when the volume medium diameters of the experimental dusts were 4.98, 7.33, and 11.98 μm.
Contrary to the deposit amount of dust, the deposit depth decreased with the increase of the experimental dust size for a same cycle number. Obviously, when the larger size experimental dust was used, a stable deposit layer could easily form after a long operation period, which performed as a new filter medium and prevented particles penetration into the deeper part of the filter medium.
3.3 Expression for the pressure drop across the used filter medium
According to the differential form of Ergun equation [20] about the resistance of the porous medium and Carman theory [21] about the hydraulic diameter of the mixtures of sizes, the pressure drop across the used filter medium can be calculated by Eq. (3), which is the integral sum of two parts. One part is used to calculate the pressure drop across the clean layer of the filter medium, whereas the other part is for the deposit layer. The related sizes in Eq. (3) are shown in Fig. 12.
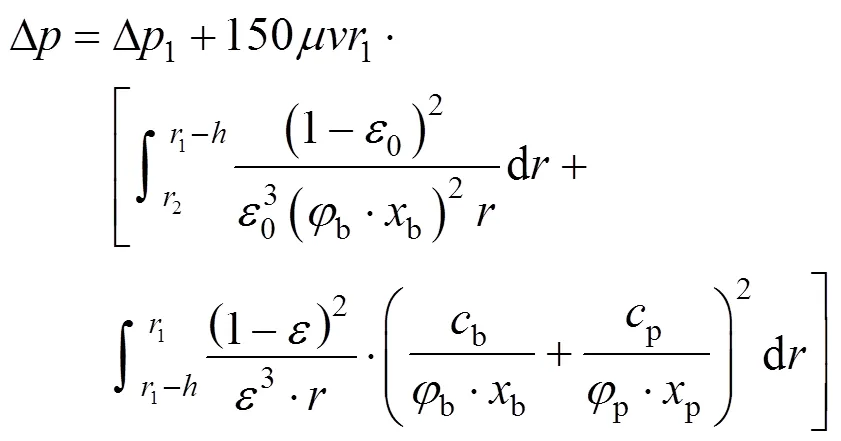

Figure 13 illustrates the evolution of the filter pressure drop during filtration-cleaning cycles under the different face velocities. Here, Δbexpresses the change in the resistance of the filter medium because of dust deposit within the medium and was calculated by Eq.(3). Δrexpresses the change in the resistance of the filter because of dust deposit within the medium and residual dust cake and was experimentally determined. Then, the deviation of Δrwith Δbindicates the resistance change of residual dust cake. By comparing with the experimental result of Δb, the sphericity of ceramic particles and deposited particles in Eq. (3) were set as 0.5 and 0.7, respectively. In this case, the error of the calculated results for Δbwas smaller than 20%.

Figure 12 Filter medium cross section
According to Fig. 13, with increasing cycle number, Δrpresents an almost same trend as Δb, which can be divided into two stages. At the initial stage, the value of Δrincreases slowly, which should be because of only a few of dust deposited within the filter medium as shown in Δb. When more and more dust particles penetrated and deposited within the filter medium with increasing cycle number, some pores were clogged and then the flow resistance steeply increased. The residual dust cake was the other reason for the resistance increasing as shown of the difference between Δrand Δbin Fig. 13. Moreover, a strong dependence between the filter resistance and the face velocity was noticeable in Fig. 13. With the increase of the face velocity, the increase of Δrbecame more pronounced, which reflected the tendency of dust deposit within the filter medium as shown in Fig. 5 and Fig. 6.
Figure 14 shows the evolution of the filter pressure drop during filtration-cleaning cycles when the different sizes of dust were used. It can be seen that dust size is the key factor that influences the flow resistance of the filter. With the increase of cycle number, Δrsteeply increased for the experimental dust with a volume median diameter of 4.98 μm especially at the later stage, while the case of 7.33 and 11.98 μm reached a relatively stable stage after about 200 cycles. The effect of dust size on Δrcan be associated with the deposit structure of dust within the filter medium. As mentioned above, when the large size experimental dust was used, a stable deposit structure could be easily yielded within the filter medium and then, Δbapproached to a certain value with increasing cycle number as shown in Fig. 14. Obviously, a stable and lower residual pressure drop is the key that a stable operation was yielded for the rigid ceramic filter. Furthermore, as illustrated in Fig. 14, for the larger size experimental dust, the deviation of Δrwith Δbapproached a certain value. It means that the looser dust cake structure formed by larger size dust was also the reason that a stable and lower residual pressure drop was yielded.

4 CONCLUSIONS
The local structure of the filter medium after some cycles was observed by a microscopic analysis method. It was found that because of particle migration and fine particle penetration, dust deposit in the medium tended to aggravate and extended toward inside of the medium with the increase of cycle number. In the medium, the deposit amount of dust decreased linearly in the radial direction away from the surface. The face velocity and dust size are the key factors that influence dust deposit within the filter medium.
Based on a differential form of Ergun equation, the change of micro parameters was related to the evolution of the filter medium resistance by an expression. It is verified that dust deposit within the medium is the main reason for the filter resistance increasing and the ceramic filter cycle irreversible. For getting a stable operation, a lower face velocity and reasonable ratio of dust size to pore size of the filter medium should be used.
NOMENCLATURE
area, μm2
areal fraction of particles
deposit depth of dust, m
cycle number
cumulative percentage
pulse pressure, kPa
Δpressure drop, kPa
radius of filter candle wall, m
face velocity of the filter, m·s-1
deposit amount of dust, %
the diameter of particle, μm
porosity of the filter medium, %

Subscripts
b filter medium
m volume median diameter of dust
p dust particle
r residual dust cake
0 original value of the filter medium porosity
1 outside radius of the filter candle wall
2 inside radius of the filter candle wall
1 Ji, Z.L., Shi, M.X., Ding, F.X., “Transient flow analysis of pulse-jet generating system in ceramic filter”,., 139, 200-207 (2004).
2 Seville, J.P.K., Chuah, T.G., Sibanda, V., Knight, P., “Gas cleaning at high temperatures using ceramic filters”,.., 14 (6), 657-672 (2003).
3 Schildermans, I., Baeyens, J., “Pulse jet cleaning of rigid filters: A literature review and introduction to process modeling”,.., 41 (5), 26-33 (2004).
4 Phillips, J.N., Dries, H.W.A., “Filtration of fly slag from the shell coal gasification process using porous ceramic candles”, In: Proceedings of the 2nd International Symposium on Gas Cleaning at High Temperatures, Guildford, UK (1993).
5 Burnard, G.K., Leitch, A.J., Stringer, J., Clark, R.K., Holbrow, P., “Operation and performance of the EPRI hot gas filter at Grimethorpe PFBC establishment: 1987-1992”, In: Proceedings of the 2nd International Symposium on Gas Cleaning at High Temperatures, Guildford, UK (1993).
6 Jalovaara, J., Hippinen, I., Jahkola, A., “Experiences of a fibrous ceramic candle filer for hot gas cleaning on pressurized fluidized bed combustion”, In: Proceedings of the 2nd International Symposium on Gas Cleaning at High Temperatures, Guildford, UK (1993).
7 Choi, J.H., Seo, Y.G., Chung, J.W., “Experimental study on the nozzle effect of the pulse cleaning for the ceramic filter candle”,., 114, 129-135 (2001).
8 Chi, H.C., Yu, L., Choi, J.H., Ji, Z.L., “Optimization of nozzle design for pulse cleaning of ceramic filter”,...., 16 (2), 306-313 (2008).
9 Ji, Z.L., Peng, S., Tan, L.C., “Numerical analysis of flow field in ceramic filter during pulse cleaning”,...., 11 (6), 626-632 (2003).
10 Pastila, P., Helanti, V., Nikkilä, A.P., Mäntylä, T., “Environmental effects on microstructure and strength of SiC-based hot gas filters”,...., 21, 1261-1268 (2001).
11 Alvin, M.A., “Characterization of ash and char formations in advanced high temperature particulate filtration systems”,.., 44, 237-283 (1995).
12 Duo, W., Kirkby, N.F., Seville, J.P.K., Clift, R., “Patchy cleaning of rigid gas filters (I) A probabilistic model”,..., 52 (1), 141-151 (1997).
13 Dittler, A., Ferer, M.V., Mathur, P., Djuranovic, P., Kasper, G., Smith, D.H., “Patchy cleaning of rigid gas filters-transient regeneration phenomena comparison of modeling to experiment”,., 124, 55-66 (2002).
14 Ji, Z.L., Jiao, H.Q., Chen, H.H., “Image analysis on detachment process of dust cake on ceramic candle filter”,...., 13 (2), 178-186 (2005).
15 Chung, J.D., Hwang, T.W., Park, S.J., “Filtration and dust cake experiment by ceramic candle filter in high temperature conditions”,..., 20 (6), 1118-1122 (2003).
16 Alvin, M.A., “Impact of char and ash fines on porous ceramic filter life”,.., 56, 143-168 (1998).
17 Schmidt, E., Löffler, F., “Preparation of dust cakes for microscopic examination”,., 60, 173-177 (1990).
18 Schmidt, E., “Experimental investigation into the compression of dust cakes deposited on filter media”,.., 32 (8), 789-793 (1995).
19 Aguiar, M.L., Coury, J.R., “Cake formation in fabric filtration of gases”,...., 35, 3673-3679 (1996).
20 Ergun, S., “Fluid flow through packed columns”,.., 48 (2), 89-94 (1952).
21 Carman, P.C., “Fluid flow through granular beds”,...., 15, 150-166 (1937).
2008-06-05,
2009-02-17.
the Specialized Research Fund for the Doctoral Program of Higher Education of China (20040425007).
** To whom correspondence should be addressed. E-mail: jizhongli63@vip.sina.com
杂志排行

Chinese Journal of Chemical Engineering的其它文章
- Design and Performance Analysis of Micro Proton Exchange Membrane Fuel Cells*
- Isolation of Cordyceps ophioglossoides L2 from Fruit Body and Optimization of Fermentation Conditions for Its Mycelial Growth*
- Efficient and Comprehensive Utilization of Hemicellulose in the Corn Stover*
- Simulating Surface Aeration Systems at Different Scale of Mixing Time*
- Kinetics of Reaction-Crystallization of Struvite in the Continuous Draft Tube Magma Type Crystallizers—Influence of Different Internal Hydrodynamics
- Preparation and Characterization of Tungsten-substituted Molybdophosphoric Acids and Catalytic Cyclodehydration of 1,4-Butanediol to Tetrahydrofuran*