Intervention against information diffusion in static and temporal coupling networks
2023-10-11YunChai柴允YouGuoWang王友国JunYan颜俊andXianLiSun孙先莉
Yun Chai(柴允), You-Guo Wang(王友国), Jun Yan(颜俊), and Xian-Li Sun(孙先莉)
1School of Telecommunication and Information Engineering,Nanjing University of Posts and Telecommunications,Nanjing 210003,China
2School of Science,Nanjing University of Posts and Telecommunications,Nanjing 210023,China
Keywords: information diffusion,coupling networks,spectral optimization,optimal control
1.Introduction
The process of information diffusion over complex networks such as face-to-face contact networks,the Internet,and online social platforms is ubiquitous in our daily lives.Understanding and analyzing the mechanism of information diffusion to design corresponding intervention strategies is of great significance in many fields (e.g., epidemiology and public health,[1,2]cybersecurity,[3]and public opinion guidance[4]).In this paper, we are interested in effectively intervening against information diffusion on complex networks.More specifically,our goal is to solve the following problems.
(i) Which models are suitable for describing the interaction among agents and information diffusion dynamics in diffusion intervention?
(ii)How can stability analysis theory be used to optimize resource allocation to restrain the diffusion process?
(iii)How to utilize the optimal control theory to dynamically adjust intervention resources according to real-time feedback of the nonlinear system?
The modeling, analysis, and control of information diffusion on complex networks have been a long-term research topic.Network science traditionally treats individual interactions as a connectivity-driven permanent structure (i.e., static network).[5–29]However, the interaction among agents often unceasingly changes over time in many real cases.[30]Intuitively,time-varying networks can better reflect the basic properties of complex systems.For instance, the activity-driven network(ADN)is a common and powerful tool that encapsulates the intricate interplay between agents and interactions as the activity of nodes.[31]A general standard ADN assumes that the connections are completely random and memoryless under ideal circumstances.But in reality,individual connections(especially social interactions)are not completely established at random.[32]Consequently, the lack of preferential connections among nodes limits the application of ADNs.So far,irreducible stable interactions in temporal datasets have been extracted accurately as network backbone.[33,34]We hereby adopt an improved ADN model combined with the static backbone to represent static and temporal coupling networks.This model fully describes the coupling dynamics of strong ties(static structure)and weak ties(temporal structure).[35,36]
Typically, epidemic models are widely utilized to characterize diffusion dynamics based on the similarity between information dissemination and infectious disease transmission.[18,37]We present a microcosmic susceptible–infected–recovered–susceptible (SIRS) model to simulate the information diffusion process on static and temporal coupling networks.The SIRS model has been justified to be applicable for information diffusion on complex networks and is compatible with other epidemic models through simple degradation.[23]Generally speaking, there are three main categories of information diffusion intervention technologies:spectral optimization technology,optimal control technology,and heuristic control technology.[14]Although the research on information diffusion intervention has yielded some meaningful results over the past few years, control engineers need to pay more attention to the static and temporal coupling structure.To fill this gap,we design two intervention schemes of information diffusion in static and temporal coupling networks.Our goal is not only to consider the efficiency of intervention strategies from a microcosmic perspective but also to cover the situation of a completely static or time-varying network.
Specifically,we introduce a modified ADN model to describe realistic networks.A novel node-based SIRS model is established to characterize information diffusion dynamics.We then propose three synergetic intervention strategies (i.e.restriction,correction,and prevention)to suppress information diffusion processes.Given networks with homogeneous static backbones,the critical threshold is derived via stability analysis.Accordingly,we design a spectral optimization scheme for information diffusion intervention.For different intervention goals, the budget-constrained resource allocation is to maximize the critical threshold,while the risk-constrained resource allocation is to minimize the required budget.To cover more situations, static backbones and diffusion parameters are extended to heterogeneous settings.We design an optimal control scheme to dynamically allocate intervention resources,which aims to minimize system loss and intervention expense simultaneously.In contrast to other baseline schemes,simulation results demonstrate that the optimal control scheme is the ideal choice against information diffusion in static and temporal coupling networks.
The remainder of this paper is organized as follows.Section 2 reviews the related works.In Section 3,we introduce the system models.Section 4 focuses on suppressing information diffusion by spectral optimization scheme, followed by Section 5,which studies the optimal control scheme.Simulation results are provided in Section 6.Finally, Section 7 presents the conclusion.
2.Related work
In this section, prior works are reviewed from two aspects: (i)information diffusion intervention in static networks and (ii) information diffusion intervention in temporal networks.
2.1.Information diffusion intervention in static networks
Stability analysis plays an important role in understanding information diffusion dynamics.The global and local stability conditions of disease-free and endemic equilibria under various diffusion models were analyzed.[5–7]In recent years,the threshold,extinction time,and spectral results obtained by stability analysis theory have been utilized to optimize intervention resources to control information diffusion processes.For example,Preciadoet al.[8]explored a resource allocation problem of the susceptible–infected–susceptible (SIS) model by using geometric programming.They show that the resource allocation problems can be solved in polynomial time for arbitrary directed graphs of nonidentical nodes and a wide class of cost functions.Their work then is extended to generalized epidemic models.[9,10]After that, Torreset al.[11]investigated the diffusion intervention problem when only part of the network nodes allow sparse resource allocation.Zhaoet al.[12]developed a concrete resource description model for the diffusion intervention problem and solved it with a new swarm optimizer.To meet the challenges of increasing network scales and improve the solving efficiency,a communitybased divide-and-conquer algorithm is proposed to address discrete resource allocation problems.[13]
In general, the aforementioned efforts belong to spectral optimization technology.Specifically, these efforts are suitable for two cases: (i) a certain amount of intervention resources should be optimally allocated to weaken the undesired diffusion process; (ii) find the cost-optimal resource distribution for the desired intervention goal.Yet, spectral optimization technology faces several challenges in practical applications.[14]First, they need to allocate all intervention resources at once, thereby ignoring the current system state.Second, some simplified assumptions in the stability analysis for the sake of calculation may affect the accuracy of the results.Third, some centralized solutions may lead to a high computational burden,especially for large-scale networks.
At present, the optimal control technology is a direction to address these issues.This technology usually seeks the best control effect by balancing the intervention cost and performance based on the feedback mechanism.[14]Chen and Sun[15]introduced the vaccination strategy to intervene in the SIRS diffusion process over heterogeneous networks via optimal control theory.Kandhway and Kuri[16]devised realtime resource allocation strategies to maximize information diffusion.Currently, various strategies have been formulated according to the optimal control theory to deal with different situations.[17–20]Following these works, some researchers studied the optimal control problem in light of node-based information diffusion models, taking into account heterogeneities in both network structures and individual characters.[21–23]The optimal control method based on Pontryagin’s principle and dynamic programming can often achieve control effects,but there are still options from the perspective of computational complexity or system complexity.Hence, some scholars developed near-optimal algorithms to avoid complex theoretical designs.[24–26]Similarly, a variety of heuristic and approximate algorithms were proposed.[27–29]
2.2.Information diffusion intervention in temporal networks
Many existing attempts focus on static networks, where links provide fixed connections among their nodes.However,it has been recognized that most natural and social systems are best described as temporal networks.[38]Recently,information diffusion in temporal networks has attracted growing attention from research groups.[39–42]Chenet al.[43]were among the first to investigate information diffusion intervention over mobile social networks.They solved the optimal intervention allocation time through dynamic programming to minimize the cumulative cost.Subsequently, a resource allocation problem on a class of Markovian time-varying graphs has been addressed via geometric programming.[44]Ogura and Preciado[45]further formulated an optimization intervention framework by modeling randomly switching networks as Markov jump linear systems.Afterward,Liet al.[46]adopted a suboptimal intervention scheme that can be easily implemented in semi-random networks.These works only aim at a specific time-varying network without universal applicability.
As a significant modeling tool of temporal networks,ADN has been used in the research of information diffusion intervention.[47,48]On this basis, Oguraet al.[49]added an adaptive social distance mechanism into the standard ADN.They tried to adjust the connections to avoid possible interactions with infected nodes.Zinoet al.[50]combined two non-pharmaceutical intervention policies to produce the solutions for the intervention optimization problems.Both studies adopted spectral optimization technology.To the best of our knowledge, up to now, control engineers rarely carry out information diffusion intervention on the static and temporal coupling structure.Therefore,designing intervention schemes for the coevolutionary dynamics between information diffusion processes and coupled networks remains an open problem.
3.System model
In this section,we first introduce a modified ADN model to represent individual interactions.Then,an information diffusion model over static and temporal coupling networks is established.Finally,we formulate three synergistic intervention strategies to restrain information diffusion.
3.1.Network model
We use a combination model of discrete-time ADN and static backbone to represent realistic networks.[35,36]LetGt=(V,ℰs,ℰt)denotes an undirected static and temporal coupling graph withNnodes.Specifically,V={1,...,N}is the set of nodes,ℰsis the set of static edges,andℰtis the set of temporal edges.In particular, each nodei ∈Vmay denote a person, a host,or a mobile phone.The static backboneℰsis defined by a binary symmetric adjacency matrixA=[aij]N×N,while each static edge represents a fixed connection.Besides,each nodeihas an activity rateαi,which characterizes the expected number of temporal connections per unit time.The activity rate of each node is assigned according to a distribution functionF(α)withα ∈[ε,1].Typically,we impose a lower cutoffεto avoid possible divergence ofF(α)close to zero.In practical applications,F(α) can be selected accordingly or extracted from empirical data.[31]
Definition 1 (Modified activity driven network).Given the above settings, the generative steps of the modified ADN are as follows:
(i) At timet=t0, the networkGtstarts with the static backboneℰsand the weak structureℰt=∅.
(ii) At any discrete timet, each nodeibecomes active with probabilityαiΔt.When a nodeiis activated,it randomly creates a weak link with another nodej.
(iii)At the next time stept+Δt,all weak links inGtare deleted.
The illustration of the generative process of a modified ADN is shown in Fig.1.

Fig.1.Illustration of the generative process of a modified ADN.Black solid lines represent the static edges in the backbone, and blue dashed lines represent the temporal edges generated according to nodes’activity.
3.2.Information diffusion model
We establish a novel node-based SIRS model in static and temporal coupling networks to characterize the diffusion dynamics.Following the traditional SIRS model, every nodei ∈Vat each moment is in one of three compartments: susceptible(S),infected(I),and recovered(R).We illustrate the state transition of nodes in Fig.2.More concretely,a susceptible node receives information (infection) from an infected neighbor at rateλ.Meanwhile, an infected node recovers at rateµ.In addition,a recovered node loses immunity at a rate ofγ.

Fig.2.Schematic representation of the SIRS diffusion process.Note that λ is the infection rate, µ is the recovery rate,and γ is the immunity loss rate.Additionally,u,υ,and ω are intervention inputs.
From a microcosmic perspective, this process induces a 3N-state Markov chain.[51]LetXi(t)denotes the state of nodeiat time instantt.Hence,we can summarize the instantaneous state transition of a nodeiby the following matrix:
whereδx,yis the Kronecker delta function as
Among the three summands on the second column of the first row,the first term captures the probability of nodeibecoming infected via the static backbone.The second and third terms describe the probability of nodeibecoming actively and passively infected by any other infected nodes via temporal links,respectively.Accordingly, the probability that a nodeitransfers its state fromm ∈{S,I,R}ton ∈{S,I,R}is
Then,we can derive a mean-field approximation[52]of the 3N-state Markov chain model,which significantly reduces the dimension from 3Nto 3N,as follows:
3.3.Intervention strategies
As another foundation for the diffusion intervention problem, intervention strategies can be broadly divided into pharmacological and non-pharmacological interventions.[53]Here,we propose three synergetic intervention strategies to be implemented in our schemes.Their role is graphically represented in Fig.2.
(i) Restriction Restriction measures (e.g., mandatory mask policies, virus warning messages, and advertising restrictions) can reduce the infection rate in different scenarios.[9,13,23]The restriction input will hinder the transition of a node from the S state to the I state by adjusting the infection rateλ.Their interaction can be expressed asλ(1-u).
(ii)Correction Correction measures(e.g.,medical treatment, antivirus programs, and rumor refutation) can increase the recovery rate in different scenarios.[8,13]Hence, the correction input will promote the transition of a node from the I state to the R state by adjusting the recovery rateµ.Their interaction can be expressed asµ(1+ℓυ),whereℓis a positive scalar that captures the effectiveness of correction.
(iii) Prevention Prevention measures (e.g., vaccination,system bug fixes,and anti-rumor truth spreading)provide immunity to susceptible nodes in different scenarios.[8]We denoteωas the prevention input, which will promote a node from the S state to the R state at rateω.
4.Spectral optimization scheme
Drawing inspiration from Refs.[35,36] this section focuses on homogeneous static backbones.We start our technical discussion by calculating the threshold behavior of the controlled-SIRS system.Thereafter, two diffusion intervention problems for allocating resources are formulated.
4.1.Threshold behavior
Given homogeneous static backbone,the static degree of most nodes satisfieski ≈〈k〉,∀i ∈V.[35]In this sense, the controlled-SIRS system can be formulated as

Thus, resorting to the stability analysis theory,[54]we have the following theorem.
Theorem 1 Through local stability analysis, the critical threshold of the controlled-SIRS system(3)is


Additionally,the macroscopic variables are defined as
Next, for the sake of analysis, we adopt the method in Ref.[52]and let
Then we derive a system composed ofpI,y,andz,which is linearized about disease-free equilibrium
The disease-free equilibrium condition of this system is equivalent to the controlled-SIRS system (3).[50]Hence, we can study the system (5) , whose Jacobian matrix has eigenvalues
According to Routh–Hurwitz criterion,[54]all eigenvalues have a negative real part if and only ifλ/µ <σ.That is
Consequently,the proof is completed.
4.2.Resource allocation model
We are now interested in optimizing two types of intervention problems to allocate control resources leveraging the result of the critical threshold: 1)the budget-constrained allocation problem and 2)the risk-constrained allocation problem.
Problem 1(Budget-constrained allocation).Given a budgetℬ >0,our goal is to find the optimal distribution of intervention inputs to maximize the critical threshold (i.e., minimize the outbreak risk).Thereby,the budget-constrained allocation problem is formulated as
Problem 2(Risk-constrained allocation).Given the threshold of outbreak risk,our goal is to minimize the required budget.Thus, the risk-constrained allocation problem is formulated as
wheref(u),g(υ),h(ω)are cost functions for intervention inputs.Furthermore,0<umax,ωmax<1,andµ(1+ℓυmax)≤1 due to the intrinsic mechanism of diffusion processes.
Various functions can be used to represent costs for Problems 1 and 2.[14]In this paper,we will focus on the quadratic form.Note that quadratic functions are a common choice for cost functions in intervention problems.[15,16,18–20]Since the objective functions are monotonically increasing concerningu,υ,andω,the maximum(minimum)will necessarily attain when the equality constraints are satisfied.
5.Optimal control scheme
In this section, the intervention problem against information diffusion in static and temporal coupling networks is investigated via optimal control theory.We extend the node-based SIRS model (2) with homogeneous parameters to heterogeneous settings.Also, the optimal control problem is formulated and analyzed using Pontryagin’s minimum principle.[56]
5.1.Problem formulation
In reality,there often exists heterogeneity due to individual differences.Hence,homogeneous parameters may not be applicable in some scenarios.[10,55]We begin our investigation by extending the node-based SIRS model (2), which allows the diffusion process to be affected by heterogeneous parameters.The controlled-SIRS diffusion process in Fig.2 can be described as

To reduce both system loss and intervention expense,the objective function can be formulated as

Problem 3Aiming at minimizing total system cost, the optimal control problem can be formulated as
5.2.Our solution
In this subsection, the optimal control theory[56]is utilized to analyze Problem 3.We first need to ensure solvability.To this end,the following theorem shows the existence of the optimal intervention inputs.
Theorem 2Given Problem 3,optimal intervention inputsu*(t),υ*(t),andω*(t)exist inWsuch that the objective function is minimized.
Also,we have the following conclusion about the uniqueness of the solution.
Theorem 3For a short intervention period [t0,tf], the state and costate trajectories and the optimal intervention pair(u*(t),υ*(t),ω*(t))of Problem 3 are unique.
The detailed proofs of Theorems 2 and 3 can be easily obtained from Ref.[56](Theor.4.1,p.68 and Theor.6.2,p.169).Hence, they are omitted here due to limited space.Next, we will solve Problem 3 via Pontryagin’s minimum principle.For the sake of explicit expression,we use the quadratic functions to represent the intervention resources consumption.That is,the objective function(9)can be rewritten as
whereB= diag(b1,...,bN),C= diag(c1,...,cN), andD=diag(d1,...,dN)are constant positive definite diagonal matrices.These matrices reflect the cost weights of different intervention strategies.
After that,we obtain a Lagrangian equation as
Thus,the Hamiltonian function can be defined as
whereφ(t) = (φ1(t),φ2(t),φ3(t))⊤∈R3Ndenotes the vector of costate variables, andp(t)=(pS(t),pI(t),pR(t))⊤denotes the state vector.Furthermore,F(p(t),u(t),υ(t),ω(t))=·p(t) is the macroscopic form on the right-hand side of the controlled-SIRS system(8).Accordingly,we have the following theorem.
Theorem 4Let(u*(t),υ*(t),ω*(t))be the optimal intervention pair, andp*(t)=(pS*(t),pI*(t),R*(t))⊤be the optimal state solution.Then,costate variables exist that satisfy
with the transversality conditions
Moreover,we can obtain the optimal intervention inputs
ProofFollowing Pontryagin’s minimum principle, we have the costate equations as
SetpS(t)=pS*(t),pI(t)=pI*(t),pR(t)=pR*(t),u(t)=u*(t),υ(t)=υ*(t),andω(t)=ω*(t),thus under the transversality conditionsφ1,i(tf)=φ2,i(tf)=φ3,i(tf)=0,i=1,...,N,we obtain Eq.(13).Then,we can calculate the optimal intervention inputs according to the optimality condition
The Hamiltonian functionH(p(t),φ(t),u(t),υ(t),ω(t))is a quadratic convex function ofu(t),υ(t), andω(t), so the minimum value ofH(p(t),φ(t),u(t),υ(t),ω(t))is obtained at the stationary point, the start point, or the end point.For the stationary point(~u(t), ~υ(t), ~ω(t)),it obeys
Hence we have
At last, we can obtain the optimal intervention inputs as Eqs.(14)–(16)by combining the boundary conditions.
The state vector (8), the vector of costate variables (13),and the optimal intervention inputs(14)–(16)constitute an iterative optimality system.We apply the forward–backward sweep algorithm as shown in Algorithm 1 to obtain a numerical solution.Both forward sweep and backward sweep result in a linear complexityO(N(tf-t0)),while the maximum number of iterations(Iter)is typically small.Thus it is suitable for large-scale static and temporal coupling networks.
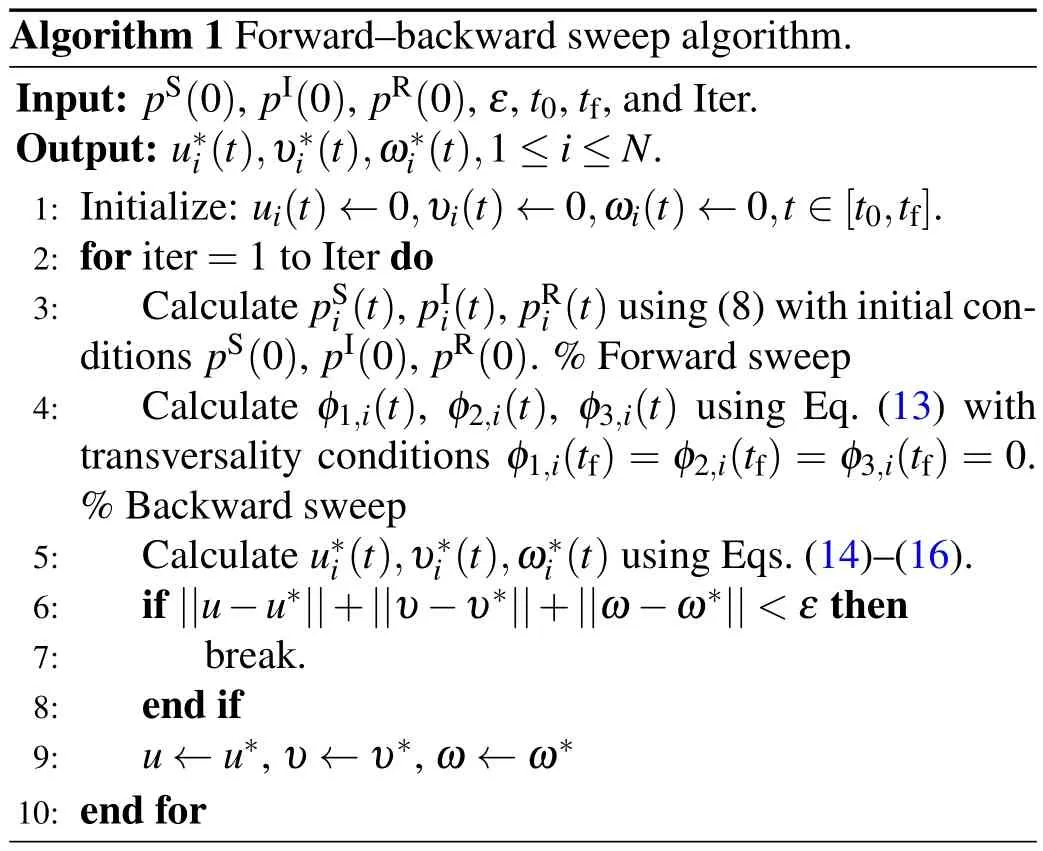
Algorithm 1 Forward–backward sweep algorithm.Input: pS(0), pI(0), pR(0),ε,t0,tf,and Iter.Output: u*i(t),υ*i(t),ω*i(t),1 ≤i ≤N.1: Initialize: ui(t)←0,υi(t)←0,ωi(t)←0,t ∈[t0,tf].2: for iter=1 to Iter do 3: Calculate pSi(t),pIi(t),pRi (t)using(8)with initial conditions pS(0), pI(0), pR(0).%Forward sweep 4: Calculate φ1,i(t), φ2,i(t), φ3,i(t) using Eq.(13) with transversality conditions φ1,i(tf)=φ2,i(tf)=φ3,i(tf)=0.%Backward sweep 5: Calculate u*i(t),υ*i(t),ω*i(t)using Eqs.(14)–(16).6: if||u-u*||+||υ-υ*||+||ω-ω*||<ε then 7: break.8: end if 9: u ←u*,υ ←υ*,ω ←ω*10: end for
6.Simulation results
In this section, extensive simulations are conducted to verify the effectiveness of our proposed intervention strategies and schemes.First,we examine the spectral optimization scheme in several static and temporal coupling networks with homogeneous static backbones.Then, the efficiency of the synergistic intervention implementation is evaluated.Finally,we validate the performance of the optimal control scheme in more general networks.
6.1.Evaluation of spectral optimization scheme
Following Refs.[35,36], we generate two synthetic networks with the ER static backbone, represented by SN1 and SN2 respectively.The activity rates of the SN1 network are uniformly distributed in [0,1].The activity rates of the SN2 network are bounded in the interval [ε,1] and extracted from a distribution functionF(α)∝α-κ.Meanwhile, we set the lower cutoffε=0.1 and the scaling exponentsκ=2.5.More detailed statistical characteristics of the two modified ADNs are listed in Table 1.

Table 1.Statistical characteristics of the modified ADNs.

Table 2.Default values of basic parameters.
6.1.1.Theoretical threshold verification
Before demonstrating the effectiveness of the spectral optimization scheme, the theoretical threshold must be verified first.We adopt four configurations of intervention strategies to cover the following cases.
Case 1We setu=0,υ=0,andω=0,that is,no intervention strategy is implemented in the diffusion process.
Case 2We setu=0.8,υ=0.2,andω=0.2,that is,the restriction strategy obtains the major investment in the diffusion process.
Case 3We setu=0.2,υ=0.8,andω=0.2,that is,the correction strategy obtains the major investment in the diffusion process.
Case 4We setu=0.2,υ=0.2,andω=0.8,that is,the prevention strategy obtains the major investment in the diffusion process.
Other default parameters that follow practical significance in previous works[20,23,50]are shown in Table 2.Besides, the initial state probability of each node is randomly chosen from[0,1],and the average probabilities of S,I,and R states are set to 0.85,0.1,and 0.05,respectively.
Figure 3 depicts the critical thresholds of SN1 and SN2 given by Theorem 1.Generally,the critical thresholds increase monotonically concerningu,υ,andω.Figure 4 shows the relationship between the steady-state prevalencepI(∞) and the infection rateλ.For the SN1 network, the lowest infection rates of endemic states derived from the theoretical threshold in four cases are 0.0522, 0.7303,0.4564,and 0.3391, respectively.From Fig.4(a), we can see that information will tend to be prevalent when the infection rates exceed the theoretical values.Additionally, for the SN2 network, the lowest infection rates of endemic states derived from the theoretical threshold in four cases are 0.0595, 0.8329, 0.5206, and 0.3867, respectively.We can find from Fig.4(b) that under the heterogeneous activity rate distribution, information will also be endemic when the infection rates approximately reach the theoretical values.These results verify the accuracy of the theoretical derivation.Moreover, the implementation of intervention strategies can not only improve the threshold but also reduce the influence of information even if the diffusion still reaches the epidemic state.Interestingly, combining the results of Figs.3 and 4,the influence ofuandυon the threshold and diffusion scale is greater than that ofω.It suggests that the restriction and correction strategies are more important than the prevention strategy in quickly suppressing information diffusion.
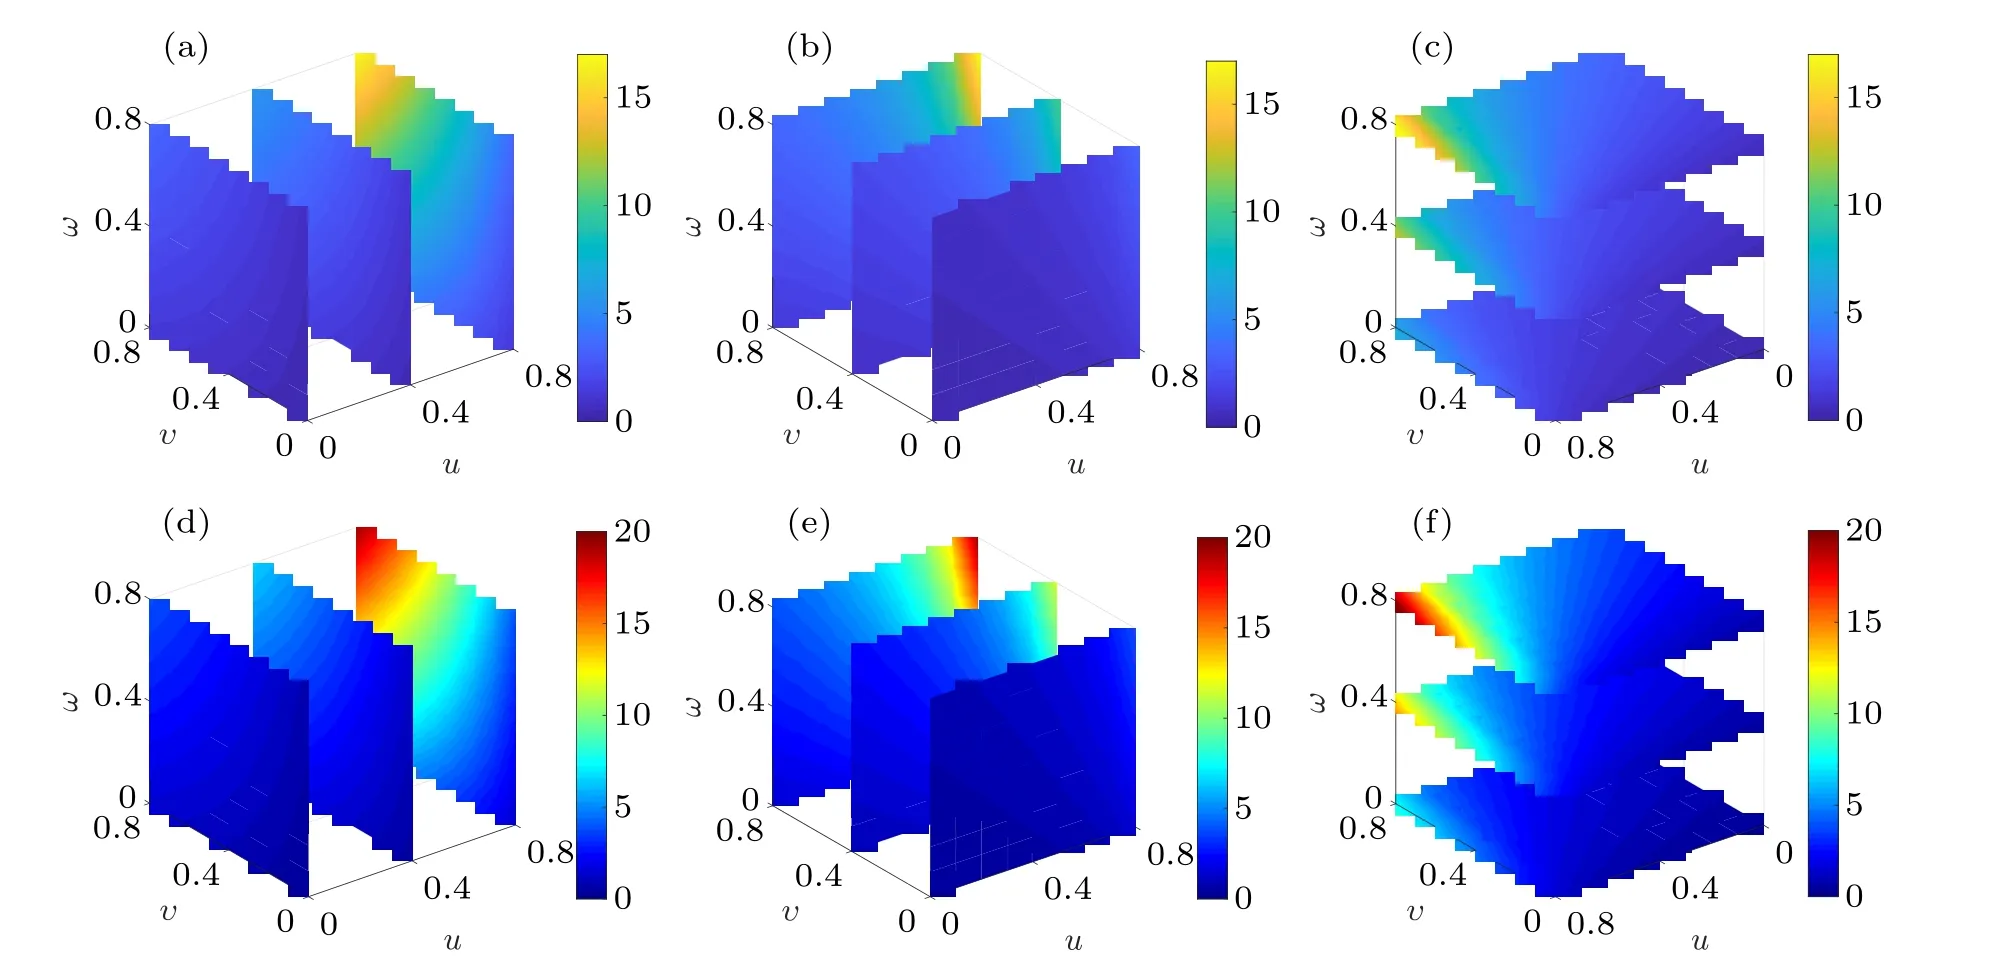
Fig.3.Theoretical thresholds for different values of u,υ,and ω.(a)–(c)SN1 network;(d)–(f)SN2 network.

Fig.4.The relationship betweenpI(∞)and λ on two networks.(a)SN1 network;(b)SN2 network.
6.1.2.Validation and sensitivity analysis
Here, we conduct experiments to demonstrate the effectiveness of the spectral optimization scheme and examine the effects of some key parameters.Problems 1 and 2 are solved numerically with the same cost function in Problem 3.We setλ=1 and begin by solving Problem 1 to maximize the thresholdσat an allowed budget.Figure 5 shows the dynamic evolution process of prevalence over time with different budgets.Whenℬ=0, no intervention strategy is implemented.The prevalencepI(t)will reach more than 0.65 after the peak on the two networks.It can be seen that with the implementation of the spectral optimization scheme, the information is effectively controlled.As expected,we observe the prevalence drops to 0 when budgets are sufficient.
Then,we solve Problem 2 to minimize the budget within the outbreak risk.Table 3 presents the intervention inputs and corresponding budgets for different configurations obtained by solving Problem 2.Since the average activity rate of the SN2 network is lower than that of the SN1 network, it requires a lower budget to suppress information diffusion.Figure 6 displays the dynamic evolution process of prevalencepI(t) under different infection rates.From Fig.6, we notice that information tends to die out under different diffusion parameters.These plots demonstrate the performance of the riskconstrained allocation method.Eventually, information will be fully eradicated.It means that the risk-constrained allocation goal is well achieved at the desired cost.

Table 3.Intervention inputs and budgets of different configurations.

Fig.5.Dynamic evolution process of prevalencepI(t) under different budgets.(a)SN1 network;(b)SN2 network.

Fig.6.Dynamic evolution process of prevalencepI(t) under different infection rates.(a)SN1 network;(b)SN2 network.
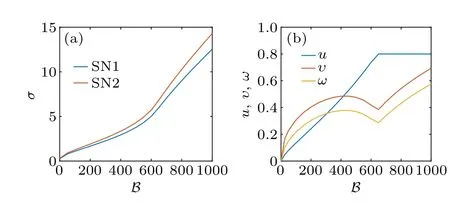
Fig.7.Influence of budget ℬ.(a)Threshold σ;(b)intervention inputs u,υ,and ω.
We further investigate the role of budgets.For Problem 1,figure 7(a) reports the corresponding thresholds for different budgets.We can find that the threshold presents a positive correlation with the budget.For Problem 2, it shows the required intervention cost as a function of the desired threshold.Figure 7(b)reveals how restriction,correction,and prevention resources are allocated when a given budget increases.Especially,it can be seen that restriction inputuincreases monotonically with the increase of budget until it reaches the maximum value.Namely, restriction resources are allocated in preference when the budget is sufficient.
6.2.Evaluation of the optimal control scheme
In this subsection,we employ Algorithm 1 to solve Problem 3.We generate a synthetic network with a heterogeneous backbone named SN3.[35]The activity rate distribution function of the SN3 network is the same as the SN2 network.In addition,the Superuser network is generated according to an empirical dataset.This dataset collects data from a stack exchange website: Super User.Specifically, we filter out irrelevant information and extract a subgraph from this dataset.Subsequently, the time window of network evolution is divided into independent intervals.Then,high-strength links are screened by the threshold method and added to the backbone.[57]Thus, we can characterize the activity rates as similar to Ref.[31].More detailed statistical characteristics of the two modified ADNs are also listed in Table 1.
6.2.1.Performance examination
We discuss the following eight scenarios to evaluate the performance of the optimal control scheme and the impacts of three synergetic intervention strategies.
Scenario 1 No intervention strategy is implemented,i.e.,ui(t)=0,υi(t)=0,andωi(t)=0,i=1,2,...,N.
Scenario 2 Only the restriction strategy is implemented,i.e.,ui(t)/=0,υi(t)=0,andωi(t)=0,i=1,2,...,N.
Scenario 3 Only the correction strategy is implemented,i.e.,ui(t)=0,υi(t)/=0,andωi(t)=0,i=1,2,...,N.
Scenario 4 Only the prevention strategy is implemented,i.e.,ui(t)=0,υi(t)=0,andωi(t)/=0,i=1,2,...,N.
Scenario 5 The restriction strategy and the correction strategy are implemented,i.e.,ui(t)/=0,υi(t)/=0,andωi(t)=0,i=1,2,...,N.
Scenario 6 The restriction strategy and the prevention strategy are implemented,i.e.,ui(t)/=0,υi(t)=0,andωi(t)/=0,i=1,2,...,N.
Scenario 7 The correction strategy and the prevention strategy are implemented,i.e.,ui(t)=0,υi(t)/=0,andωi(t)/=0,i=1,2,...,N.
Scenario 8 Three intervention strategies are synergistically implemented, i.e.,ui(t)/=0,υi(t)/=0, andωi(t)/=0,i=1,2,...,N.
Figure 8 displays the dynamic evolution of the prevalence over time in Scenarios 1–4.We can find that a single intervention strategy cannot completely inhibit the dissemination of information at a given period.Yet, in Scenarios 2–4,pI(t) is significantly reduced compared to the situation without any intervention strategy.Besides,the restriction strategy shows the fastest effect in the early stage of intervention,but the correction strategy is still the most effective.The cumulative total costs of the controlled-SIRS system in Scenarios 1–4 can be seen in Fig.9.It indicates that the intervention effect of the restriction and correction strategies is stronger than the prevention strategy.Also,these results reveal that the correction strategy is slightly stronger than the restriction strategy.An intuitive explanation is that the correction strategy acts directly on the infected nodes.
Figures 10 and 11 show the dynamic evolution of prevalence and average intervention inputs over two networks in Scenarios 5–8.It can be seen that with the development of the system,the average intervention inputs are constantly dynamically adjusted.From the results of Scenarios 5–7,we observe that the prevalence is kept at a low level when two intervention strategies are implemented.Not surprisingly, the combination of restriction strategy and correction strategy performs best among the three scenarios.The cumulative total cost of the controlled-SIRS system in Scenarios 5–8 can also be seen in Fig.9.By contrasting Scenarios 2–4 and Scenarios 5–7 in Fig.9, we find that the intervention effect of any combination is better than that of a single strategy.In particular, the combination of restriction strategy and correction strategy reduces the cumulative total costs by more than 65%compared to the implementation of a single restriction strategy or corrective strategy.
What is more, figures 10(d) and 11(d) show that three synergistic intervention strategies can quickly and significantly reduce the prevalence.Compared to Scenarios 5–7,Scenario 8 does not require consistently high intervention inputs.Especially in the SN3 network, the prevalence can be reduced to zero for a short period.As can be seen from Fig.9, three synergistic intervention strategies greatly reduce the cumulative total costs compared to Scenarios 1–7.It demonstrates the efficiency of synergistic intervention strategies.Generally speaking, the synergistic implementation of the three intervention strategies is the best choice.

Fig.8.Dynamic evolution ofpI(t)over time in Scenarios 1–4.(a)SN3 network;(b)Superuser network.
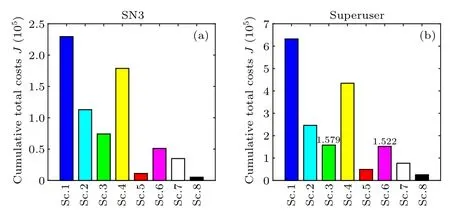
Fig.9.Cumulative total cost J of the controlled-SIRS system in Scenarios 1–8.(a)SN3 network;(b)Superuser network.
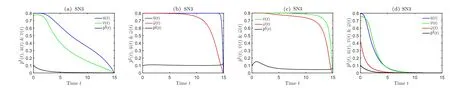
Fig.10.Dynamic evolution of pI(t),u(t),υ(t),and ω(t)over the SN3 network.(a)Scenario 5;(b)Scenario 6;(c)Scenario 7;(d)Scenario 8.

Fig.11.Dynamic evolution of pI(t),u(t),υ(t),and ω(t)over the Superuser network.(a)Scenario 5;(b)Scenario 6;(c)Scenario 7;(d)Scenario 8.
6.2.2.Comparison with other schemes
Next,the performance of the optimal control scheme over the SN3 network and the Superuser network is compared with the other baseline schemes.
(i)Spectral optimization scheme:The risk-constrained allocation problem is solved.We obtainu=0.4498,υ=0.4831,ω=0.3765 on the SN3 network andu=0.4862,υ=0.4857,ω=0.3790 on the Superuser network,respectively.
(ii) Greedy scheme:[20]This scheme consistently adopts the maximum intervention input(i.e.,u=umax,υ=υmax,andω=ωmax).
(iii)Random scheme:[20]This scheme randomly allocates intervention resources at each time step.
Figure 12 presents the dynamic evolution of the prevalence over time with different intervention schemes.From Fig.12(a),we can observe that the optimal control scheme and the greedy scheme perform well and eliminate information on the SN3 network.The spectral optimization scheme and the random scheme can not eliminate information, but they also significantly reduce the prevalence on the SN3 network.From Fig.12(b),we can see that information cannot be eradicated on the Superuser network at the given time.But all these intervention schemes greatly decrease the prevalence.As expected,the optimal control scheme and the greedy scheme perform better than the other two schemes, while the spectral optimization scheme and the random scheme perform similarily.
Figure 13 presents the cumulative total costJfor different intervention schemes.We can observe that the spectral optimization scheme and the random scheme yield close cumulative total costs.The cumulative total cost of the greedy scheme is slightly less than theirs.By contrast, the optimal control scheme consumes the least cumulative total cost of the controlled-SIRS system.Since the goal of the spectral optimization scheme is to minimize the intervention expense with constant intervention inputs regardless of system changes and losses, the efficiency of the spectral optimization scheme is similar to that of the random scheme.Furthermore, the result from Fig.12 seems to demonstrate the great performance of the greedy scheme.However, the greedy scheme requires more intervention resources than the optimal control scheme,which leads to a high cumulative cost of the system.

Fig.13.Cumulative total cost J of different intervention schemes.(a)SN3 network;(b)Superuser network.
We should make judicious decisions about intervention resources to restrain information diffusion in static and temporal coupling networks.To summarize, the optimal control scheme performs best in our experiments.The resource allocation efficiency is greatly improved due to the dynamic and node-based allocation technology.Therefore,the optimal control scheme is the ideal choice against information diffusion in static and temporal coupling networks.
7.Conclusion
In this article, we address the intervention problem against information diffusion over static and temporal coupling networks.We propose three synergetic intervention strategies to restrain information diffusion processes.Subsequently, the critical threshold for homogeneous static backbones is derived via stability analysis.Accordingly,we exploit a spectral optimization scheme to maximize the critical threshold or minimize the required budget.Then the heterogeneity of nodes is fully considered.We design an optimal control scheme that simultaneously minimizes system loss and intervention expense.At last,the accuracy of theoretical derivation and the performance of our proposed intervention schemes are evaluated on various static and temporal coupling networks.Extensive simulation results demonstrate that the synergistic implementation of the three intervention strategies is the best choice.Besides,the optimal control scheme is the ideal choice against information diffusion in static and temporal coupling networks.As a future research direction, we tend to investigate information diffusion processes occurring in temporal multiplex networks.
Acknowledgment
Project supported by the National Natural Science Foundation of China(Grant No.62071248).
杂志排行

Chinese Physics B的其它文章
- Dynamic responses of an energy harvesting system based on piezoelectric and electromagnetic mechanisms under colored noise
- Turing pattern selection for a plant–wrack model with cross-diffusion
- Quantum correlation enhanced bound of the information exclusion principle
- Floquet dynamical quantum phase transitions in transverse XY spin chains under periodic kickings
- Generalized uncertainty principle from long-range kernel effects:The case of the Hawking black hole temperature
- Commensurate and incommensurate Haldane phases for a spin-1 bilinear–biquadratic model