Simulation-driven Wind Load Analysis and Prediction for Large Steerable Radio Telescopes
2023-03-25ShuaiLiBaoQingHanShaoYiLiuWenJuanWangBenBenWangXinYuZhangLongYangWangQianXuNaWangWuLinZhaoandCongSiWang
Shuai Li ,Bao-Qing Han,5 ,Shao-Yi Liu ,Wen-Juan Wang ,Ben-Ben Wang ,Xin-Yu Zhang ,Long-Yang Wang,Qian Xu,Na Wang,Wu-Lin Zhao,and Cong-Si Wang
1 Key Laboratory of Electronic Equipment Structure Design,Ministry of Education,Xidian University,Xi’an 710071,China;hanbaoqing18@163.com
2 Xinjiang Astronomical Observatory,Chinese Academy of Sciences,Urumqi 830011,China
3 The 39th Research Institute of China Electronics Technology Group Corporation,Xi’an 710065,China
4 Guangzhou Institute of Technology,Xidian University,Guangzhou 510555,China;congsiwang@163.com
Abstract Large steerable radio telescopes can rotate in azimuth and elevation,with various upwind postures and complex wind load characteristics.In order to obtain the wind load distribution on the reflector and the wind force coefficients in different upwind postures,this work took the reflector of the QiTai Telescope in Xinjiang as the object.The wind pressure distribution,drag coefficient,side force coefficient,lift coefficient,and total force coefficient of 361 groups of reflectors with different upwind postures were calculated and analyzed by a numerical simulation method.The results show that the force on the reflector when the concave surface faces the wind is significantly greater than when the convex surface faces the wind.The surrogate models for calculating wind force coefficients were established based on the polynomial response surface model(PRSM)and regularized minimumenergy tensor-product spline(RMTS).The adjusted R-squared of RMTS is 0.98,and the root mean square error is below 0.1,which proves RMTS is significantly better than PRSM.Compared with the numerical simulation values,the absolute errors of the drag coefficient,side force coefficient,lift coefficient,and total force coefficient of the reflector with azimuth and elevation of 45°predicted by RMTS are 0.02,0.027,0.032,and 0.046,respectively.The relative errors are 2.42%,2.76%,2.23%,and 2.43%,respectively.It is proved that the RMTS surrogate model is reliable and that the predicted data can fast provide sufficient information for the wind-resistant design of the large steerable radio telescopes.
Key words: methods: numerical–methods: data analysis–telescopes–atmospheric effects
1.Introduction
Large steerable radio telescopes are widely used in the detection,communication,radio astronomy,and other fields because they provide the highest gain,widest bandwidth,and best angular resolutions at the lowest costs(Samii&Haupt 2015).The steerable radio telescopes often work in an open-air environment,which would inevitably be affected by environmental loads.The wind force on the reflector surface was proportional to the square of its aperture radius,and the wind torque was proportional to the cubic of its aperture radius.For Xinjiang Qitai 110 m Telescope(QTT) (Wang 2014) and Yunnan Jingdong 120 m Radio Telescope (JRT) (Wang et al.2022),their giant reflectors are more prone to deformation due to the influence of wind load,resulting in the decline of antenna efficiency and pointing accuracy.Therefore,wind load has become one of the critical loads that must be considered in the design,operation,and maintenance of large aperture radio telescopes.Analyzing wind load characteristics on the reflector under different azimuths and elevations has a significant engineering application value for designing large antenna structures and wind resistance research.
For the research of wind load on steerable radio telescopes,most of the achievements focused on the primary reflector wind tunnel experiments funded by NASA and completed by JPL in the 1960s.Fox and Dayman (Fox &Dayman 1962) summarized the referenced wind tunnel test performed in the Northrop Subsonic Wind Tunnel in November 1961.The data of solid,edge porous,and uniform porous parabolic reflectors under multiple upwind postures were obtained.The integration of pressure data on the reflector was compared with the directly measured force and torque data.It was concluded that the solid reflector structure had a robust local edge load,and the porous reflector structure could alleviate this situation.In the following year,Fox (1962) tested a parabolic reflector with an 18-inch diameter and a focal diameter ratio of 0.33 in a wind tunnel.It was concluded that the parabolic reflector’s surface roughness had little bearing on the overall force and torque and could be ignored.The wind load at the edge of the reflector is typically lower than that at the center of the reflector for most reflector upwind postures.Wyatt(Wyatt 1964)thought that the reflector was the main factor for the wind load of the parabolic antenna.It was beneficial only to consider the wind load of the reflector.At the same time,through the analysis of the wind tunnel data,it was found that the moment at the top of the paraboloid had a special relationship with the focal diameter.Scruton (Scruton 1964) studied the wind-induced vibration of the Jodrell Bank and found that the vibration was most severe when the reflector was at 15° elevation.The chatter at the edge of the reflector may be caused by the chattering caused by the shedding eddy current.The chatter could be reduced or prevented by strengthening the edge stiffness or modifying the edge shape.Katow (Katow 1975) conducted wind tunnel tests on solid reflectors,25% porous reflectors,and 50% porous reflectors,pointing out that the drag coefficients of 25%porous reflectors and solid reflectors were very close when the concave surface was in direct wind.Gawronski (Gawronski et al.2005)measured the average wind torque of the NASA Deep Space Network (DSS) 34 m antenna,calculated the dimensionless wind torque under various upwind postures,and compared it with the wind tunnel test data of the scaled antenna model.It shows that the difference between the wind tunnel measurement data and the field measurement data is less than 10%,which proves the reliability of the scale model.The wind load research on radio telescopes in foreign countries is gradually decreasing,which may be because there has been no plan to build large aperture radio telescopes in foreign countries in recent years.
At the present time,researchers have a basic understanding of the wind load characteristics of the reflector.However,only the analysis of the reflector under specific upwind postures is not comprehensive enough,and there is a lack of research on the wind force coefficients of the reflector,such as the drag coefficient,side force coefficient,lift coefficient,and total force coefficient.It is worth noting that the wind pressure distribution and wind force coefficient of 361 groups of reflectors with different upwind postures are calculated and analyzed by the numerical simulation method in this work.The surrogate model is established to predict the wind force coefficients of various upwind postures based on the wind coefficient data,and the fast calculation of the wind coefficient under upwind postures is achieved.The data in this paper will provide a large amount of reliable data for the wind-resistant design of radio telescopes.The surrogate model can also be used in the wind-resistant control system of radio telescopes,which has an excellent engineering application value.
2.Numerical Models and Methods
QTT will be constructed in the Qitai County of Xinjiang,China.It uses an axisymmetric modified Gregorian dual reflector antenna.The mechanical structure mainly includes the primary and secondary reflectors,quadruped structures,alidades,and wheel rails.The primary reflector diameter is 110 m,the secondary reflector diameter is about 12 m,the focal diameter ratio is 0.33,and the weight is about 5500 tons.The wind load on QTT is mainly due to differential pressure resistance caused by the normal uneven pressure of the reflector.The airflow converges in front of the reflector because of the reflector’s barrier,creating a high-pressure region.The airflow has a flow-around phenomenon,which generates an eddy current behind the reflector to form a lowpressure area.High and low pressure is formed before and behind the reflector,causing the reflector deformation.Assume that the direction of the wind in the Cartesian coordinate system is horizontally pointing to theX-axis.The force on the reflector in theX-axis is defined as drag,and the torque is the rolling torque;TheY-axis is the side force and the overturning torque;TheZ-axis is the lift force and the azimuth torque.The force points to the positive direction of each axis is a positive value.The schematic diagram of the wind force on the QTT is shown in Figure 1.

Figure 1.The schematic diagram of the QiTai radio telescope structure and wind load.
In Figure 1,the azimuth angle (α) represents the horizontal rotation angle of the reflector,and the elevation angle (β)represents the vertical rotation angle of the reflector.Azimuth rotates counterclockwise,elevation rotates clockwise.Azimuth angle and Elevation angle jointly determined the upwind postures (α,β) of the reflector.Figure 2 shows the schematic diagram of the radio telescope at specific upwind postures.The azimuth angles (0°–180°,at every 10° position) and elevation angles (0°–90°,at every 5° position) of the upwind postures were modeled.There are 361 groups of numerical simulation cases.

Figure 2.Upwind postures diagram of the reflector.(a)When the azimuth is 0°,the reflector elevation is 0°,45°,and 90°,and the elevation angle changes clockwise.(b) When the elevation is 45°,the reflector azimuth is 0°,90°,and 180°,and the azimuth angle changes counterclockwise.
2.1.CFD Model Description
The diameter of the primary reflector is 110 m,and the alidade and backup structure diameters are far less than 1 m.The mesh technology of the current commercial CFD software cannot effectively mesh the space truss structure with such a complex size span.Moreover,Wyatt(Wyatt 1964)pointed out that it was advantageous to only study the reflector for the wind load analysis of the antenna.This work only established the model of the primary reflector and the computational domain.In the calculation domain setup,the calculation domain’s smaller size should be selected as far as possible without affecting the calculation result,which could reduce the calculation cost.At the same time,it is necessary to ensure that the blocking rate is not greater than 3% to avoid the boundary of the computational domain interfering with the flow field around the reflector.The reflector diameter D is generally used as the characteristic dimension in the existing studies.The reflector is 8D from the entrance of the computational domain and 20D from the exit.The width of the computational domain is 9D,and the height is 6D.The main size settings for the computational domain are shown in Figure 3.

Figure 3.The computational domain model for wind load analysis of the reflector.

Figure 4.Comparison of wind force coefficients for different number of elements in mesh.
Polyhedral Meshing in ANSYS Fluent was used for the mesh division of the computational domain.The reflector’s drag,side force,and lift coefficient change with the number of meshes,as shown by the mesh independence verification in Figure 4.This work adopted a 1.6 million number of elements in mesh according to the calculation time and accuracy.
2.2.Boundary Conditions and Numerical Methods
Slip conditions were applied on the upper and side boundaries of the computational domain.At the same time,the wall function was used on the lower boundary of the computational domain and surface of the reflector.The outlet of the computational domain was at zero pressure,and the exponential profile formula was adopted for the inlet as follows,
wherezis the height,zrefis the reference height,which is generally 10 m,uzis the wind speed at heightz,andurefis the wind speed at heightzref.In the simulation,zref=10 m,uref=12 m s−1,n=0.15.The steady RANS (Reynolds-averaged Navier–Stokes)equation is the primary method for numerical simulation of the complex viscous flow field.The accuracy of the RANS equation in calculating force and torque direction has been dramatically improved after the introduction of the turbulence model.The Shear Stress Transportk−ω Model(SSTk−ω)has the characteristics of small dependence on remote and high precision of the near-wall simulation.Therefore,this work mainly uses SSTk−ω turbulence model to calculate.The turbine kinetic energyk,dispersion rate ∊and specific dispersion rate ω in the model are determined by the following formula,
whereCμis a constant,usually 0.09,landTiare turbulence integral scale and turbulence intensity respectively,which can be calculated by the following formula,
wherezis the height,uzis the wind speed at heightz,n=0.15(He et al.2020).All equations adopted the second-order upwind discrete format.By ensuring that all residuals of the transport equation fell below a predetermined threshold of 10−5,the wind force coefficients no longer changed with iteration.
3.Fluid Analysis and Discussion
3.1.Distribution of Wind Force Coefficients
This work mainly analyzed the force coefficient of the reflector rather than the force.The advantage of using the force coefficient was that it did not change with the change of the inlet velocity and the diameter of the reflector,which made the data in this paper more referential.As shown in Figure 1,the reflector is subjected to forces in three directions.The drag coefficient CFD,side force coefficient CFS,and lift coefficient CFLcorrespond to dragFD,side forceFS,and lift CFL,respectively.The coefficients are defined as follows,
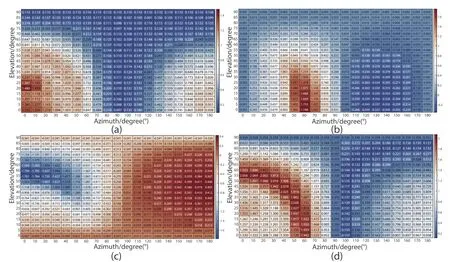
Figure 5.Wind force coefficients of reflector with different upwind postures.(a) Drag coefficient of the reflector,(b) side force coefficient of the reflector,(c) lift coefficient of the reflector,and(d)total force coefficient of the reflector.The color represents the value of the force coefficient in this upwind posture,corresponding to the number in the color block.
where ρ is the air density (ρ=1.225kg/m3),urefis the inlet velocity of the calculation domain,Ais the characteristic area of the reflector,which is generally usedin the literature,andDis the diameter of the reflector.At the same time,this work also analyzed the total force coefficient of the reflector.The definition of the total force coefficient refers to the definition of the total force,
The force coefficients of 361 groups of QTT reflectors calculated by numerical simulation are shown in Figure 5.The color represents the value of the force coefficient in this upwind posture,corresponding to the number in the color block.The abscissa in the Figure 5 is the azimuth angle.When it is 0°–90°,the concave surface of the reflector is windward,and when it is 90°–180°,the convex surface is windward.The ordinate is the elevation angle.When it is 0°,the reflector points parallel to the ground,and when it is 90°,it points to the sky.The distribution law of wind load on the reflector was as follows:
The value of the drag coefficient is always positive,which means that the direction of the drag coefficient is pointed to theX-axis and is parallel to the wind direction.When the azimuth angle of the reflector is 80°–100°,the drag coefficient is relatively small.Because most of the reflector area is parallel to the wind direction,the influence area of wind pressure is small.This result is similar to the experimental data on the reflector model measured by Fox(1962).The maximum drag coefficient appears at 0° elevation for all azimuths except 0°,10°,and 180°.The reflector drag coefficient at 0° elevation can be considered maximum value in that azimuth.As the elevation rise,the drag coefficient gradually decreases.
When the reflector azimuth is 0°,170°,and 180°,the side force coefficient is too tiny compared with the drag coefficient and can be ignored.When the upwind posture of the reflector is(0°,60°),the lift is maximum and points to the ground,which is entirely consistent with Cohen’s wind tunnel test results(Cohen et al.1964).The changing trend of side and lift force has a certain coordinate rotation symmetry;For example,the side force coefficient at (60°,0°) corresponds to the lift coefficient at (0°,60°),They are the maximum values of all upwind postures of the reflector.The coefficient values differ due to the gap between the ground and the reflector.The presence of the gap changes the pressure distribution over the reflector surface.According to Bernoulli’s principle,the wind speed between the gap increases,and the wind pressure decreases,which would significantly impact the lift more than the side force.When the concave is windward,the lift coefficient is primarily negative,that is,the force points to the ground;when the convex is windward,the lift coefficient is primarily positive,that is,the force points to the sky;when the concave is windward,the lift coefficient is generally higher than the convex.
The changing trend of the total force coefficient is symmetrical at about 90° in the azimuth dimension,but the coefficient values are different.The difference values are because when the convex is windward,its shape tends to flow linearly,with a specific coanda effect.When the concave is windward,its shape is close to the bluff body,and the airflow separates,shedding at the edge of the reflector,thus increasing the pressure difference between the front and rear sides.The above differences required us to simulate each upwind posture reflector to obtain accurate wind force coefficients,which would undoubtedly result in substantial time costs.To solve this problem,in Section 4,the surrogate model is established based on the simulation data to fast predict the wind force coefficients of the reflector under different upwind postures.
3.2.Distribution of Wind Pressure
The wind force coefficients mainly reflect the overall performance of the wind load on the reflector.The wind pressure distribution diagram of the reflector can show the characteristics of the wind pressure on the concave and convex surfaces,helping to understand the law of changes in the wind load character of the reflector.The wind pressure distributions on the reflector are shown in Figure 6,when the elevation of reflector is 0°,30°,60°,and 90°,respectively.The wind pressure distribution of the 90° elevation reflector at different azimuths is unchanged and only shown in Figure 6(a).
It can be seen from Figure 6 that when the azimuth is 0°and 180°,the wind pressure distribution of the reflector at each elevation is symmetrical(except for the 90°elevation).At other azimuths,the wind pressure distribution of the reflector is asymmetric so that torque will be generated.This article does not address the effect of torque on the reflector.The wind pressure on the windward surface is positive,and the leeward surface is negative.When the concave is windward,the maximum pressure appears at the lower edge of the concave,except when the reflector is at 90° elevation.At this time,the wind would rise first at the edge of the reflector after separation and then move to the other edge due to the gravity drop.This feature mainly occurs on the large-diameter reflector.See the wind speed streamline diagram in Figure 7 for details.In the upwind postures of (0°,0°) and (180°,0°) reflector,the maximum wind pressure appears in the center of the reflector.The maximum pressure distribution in other upwind postures appears at the edge of the reflector because of the separation and shedding of airflow from the reflector edge and eddy current.

Figure 6.Wind pressure distribution on the concave and convex surface of reflector.(a) Wind pressure distribution on reflector at 0° azimuth,(b) wind pressure distribution on reflector at 90° azimuth,and (c) wind pressure distribution on reflector at 180° azimuth.
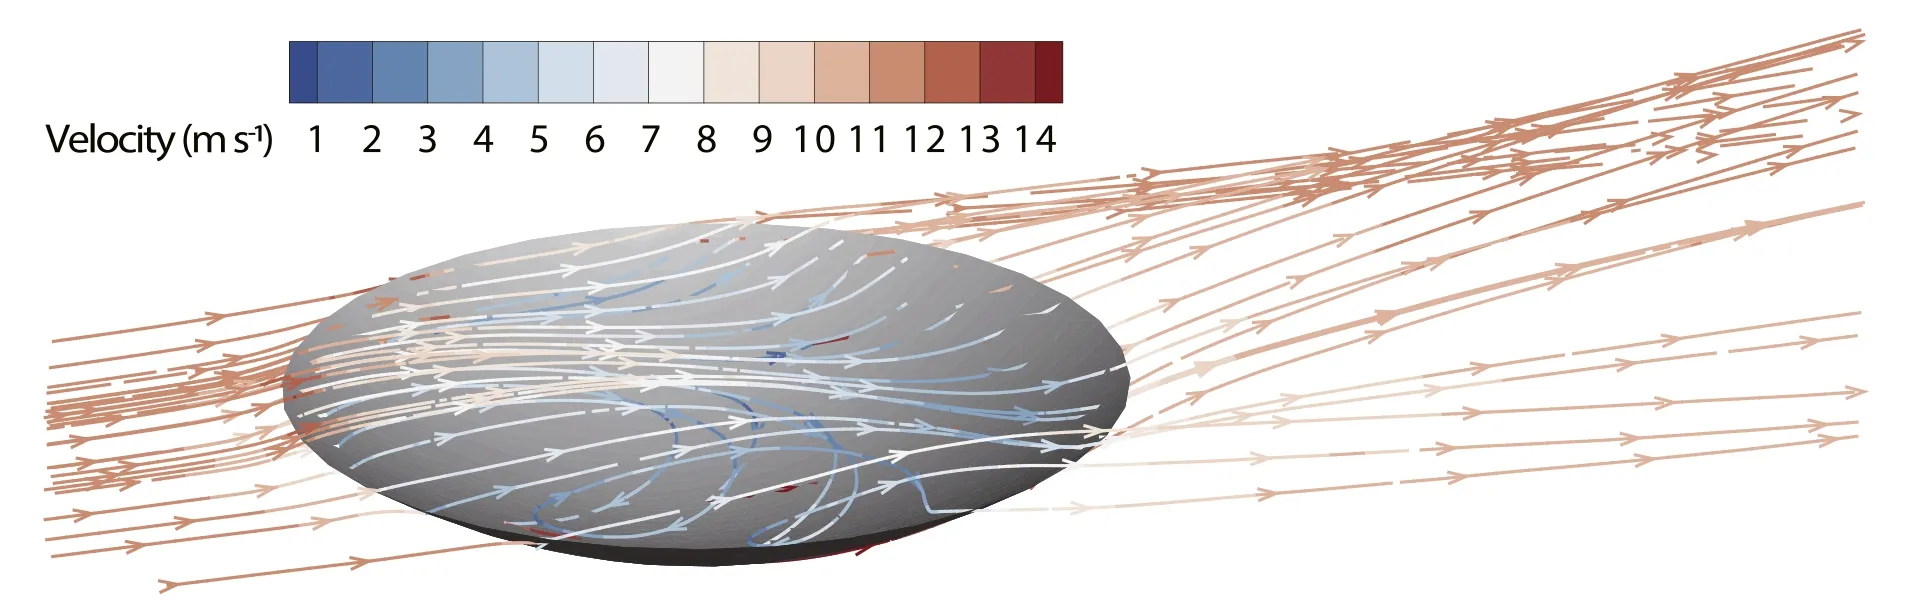
Figure 7.Reflector streamline distribution at 90° elevation (color corresponds to speed value).

Figure 8.Comparison of wind force coefficients predicted by RMTS and simulation.(a)Drag coefficient of the reflector,(b)side force coefficient of the reflector,(c)lift coefficient of the reflector,and (d) total force coefficient of the reflector.
4.Prediction of Wind Force Coefficients
More wind force coefficients of reflectors with different upwind postures can provide sufficient technical data for antenna control engineers and wind disturbance resistance design.Obtaining the reflector’s wind coefficient using a numerical simulation will take too long.For this reason,this section used the polynomial response surface method (PRMS)and surrogate model based on regularized minimum energy tensor product spline (RMTS) to achieve fast prediction of the wind force coefficients of the reflector (Hwang &Martins 2018).This work only considers the azimuth and elevation of the reflector and adopts a two-factor polynomial response surface proxy model.The expression is,
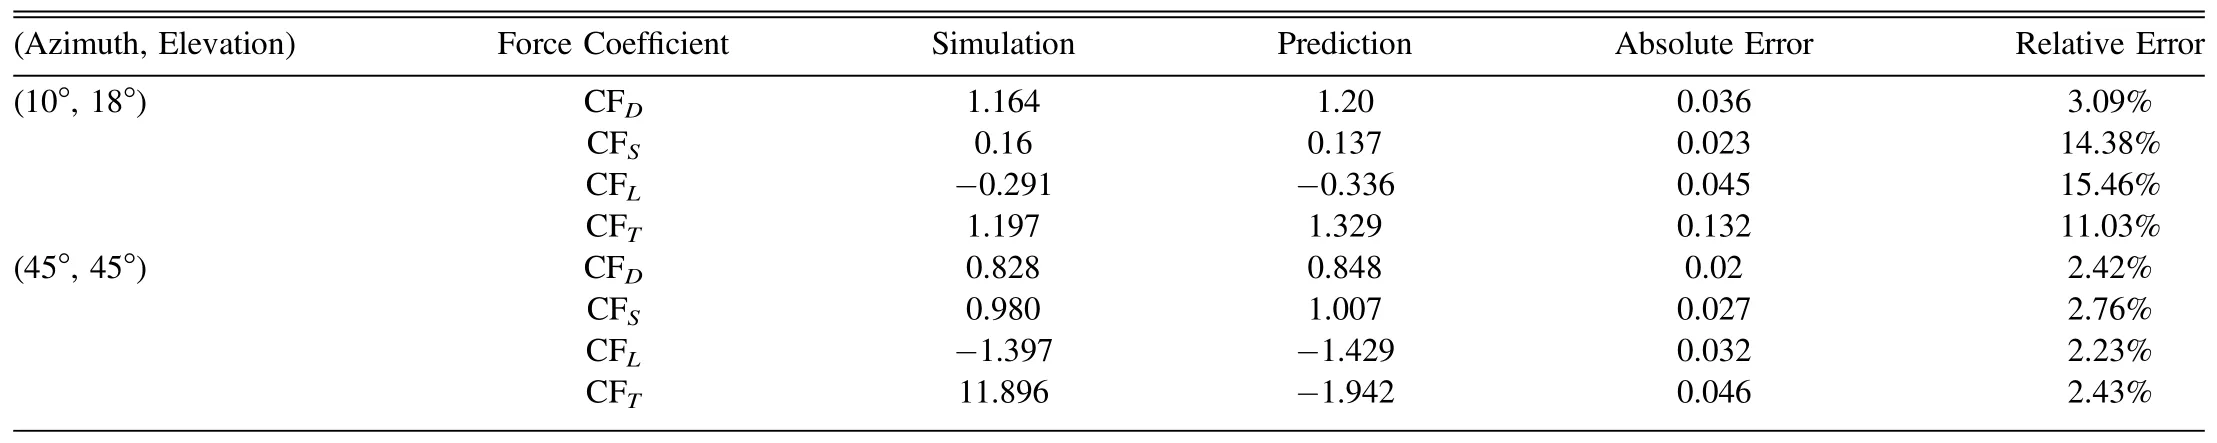
Wherec0,ci,cij,andcjare undetermined coefficients,x,yare factors,zis the prediction output,andnis polynomial degree,n≥1,i+j The RMTS model is a surrogate model for low-dimensional problems with large data sets with fast prediction capability.Unlike other methods,such as kriging and radial basis function(RBF),RMTS is not susceptible to numerical issues when there are many training points,or they are too close together.The prediction equation for RMTS is given by, Wherexis the prediction input vector,yis the prediction output,w is the vector of spline coefficients,and F(x) is the vector mapping the spline coefficients to the prediction output.RMTS computes the coefficients of the splines,w,by solving an energy minimization problem subject to the conditions that the splines pass through the training points.The objective function of this problem is formulated as an unconstrained optimization problem with terms representing the approximation error for the training points,the second derivatives of the splines,and another term for regularization.Consequently,this optimization issue can be expressed as, In order to evaluate whether the model can accurately predict the wind load coefficient of the reflector,root mean square error(RMSE) and adjusted R-square are used to evaluate the model’s performance.The expression distribution of each indicator is as follows, Figure 8 displays the RMTS prediction results and Table 1 displays the PRSM and RMTS model performance evaluation values.It is clear that the performance was significantly better than PRSM and that the error based on the RMTS model was very small. Table 1 Comparison of Prediction Performance between PRMS and RMTS Models Table 2 Comparison of Simulated and RMTS Predicted Wind Force Coefficients Two arbitrary numerical examples(10°,18°)and(45°,45°)are chosen at random in this paper to compare with the predicted value of the RMTS method in order to assess its efficacy in predicting wind force coefficients.Table 2 presents the comparison information.As can be seen,the wind force coefficients predicted by the RMTS model are very close to the simulation and have reliable prediction performance.Although the relative error of the predicted reflector lift coefficient at (10°,18°) is 15.46%,the absolute error is minimal.Because the predicted value is conservative,engineers will have some redundancy in the design process,which is safer and more reliable.Therefore,the wind coefficient predicted by the RMTS model meets the engineering application standards and can significantly reduce the time for simulation to obtain the wind force coefficients of the reflector.At the same time,in terms of time cost,numerical simulation takes roughly 30 minutes to obtain the wind force coefficients of the reflector with a single upwind posture using the simulation parameters described in this study.Under the same computing resources,it takes only about 5 s for RMTS model to predict the wind force coefficients of the reflector under a single upwind posture.Moreover,RMTS model can simultaneously predict the wind force coefficients of reflectors with different upwind postures without increasing the time-consuming,which shows the superiority of predicting the wind force coefficients based on RMTS.Moreover,the RMTS model can be combined with the wind prediction to jointly predict the force on the reflector under complex wind environments in the future. The wind pressure distribution and wind force coefficients of 361 groups of reflectors with different upwind postures are calculated and analyzed by a numerical simulation method.The RMTS model is established to predict the wind force coefficients of various upwind postures.Detailed conclusions are listed below. 1.The reflector drag coefficient at 0° elevation could be thought of as the maximum value of different elevations at that azimuth.As elevation rises,the drag coefficient gradually decreases. 2.The gap between the ground and the reflector changes the pressure distribution over the reflector surface,which would significantly impact the lift more than the side force. 3.The shape difference between the concave and convex surfaces of reflector leads to a significant difference in their wind force coefficients. 4.The strong local edge loads are caused by the separation and shedding of airflow from the reflector edge and eddy current. 5.The PRMS and the RMTS could quickly predict the reflector’s wind force coefficients.The performance of RMTS is significantly superior to PRSM,and the prediction based on RMTS has little error compared with simulation,which can be applied to engineering. Acknowledgments This work was supported by the National Key Research and Development Program of China(grant No.2021YFC2203600),the National Natural Science Foundation of China (Grant Nos.52275268 and 51975447),the National Defense Basic Scientific Research Program of China(Grant No.JCKY2021210B007),Wuhu and Xidian University Special Fund for Industry-University-Research Cooperation (Grant No.XWYCXY-012021012),and Youth Innovation Team of Shaanxi Universities (Grant No.201926). ORCID iDs
5.Conclusion
杂志排行

Research in Astronomy and Astrophysics的其它文章
- Application of a Magnetic-field-induced Transition in Fe X to Solar and Stellar Coronal Magnetic Field Measurements
- Gravitational Wave Radiation from Newborn Accreting Magnetars
- Power-law Distribution and Scale-invariant Structure from the First CHIME/FRB Fast Radio Burst Catalog
- Solar Active Region Magnetogram Generation by Attention Generative Adversarial Networks
- Construction and Validation of a Geometry-based Mathematical Model for the Hard X-Ray Imager
- The Decay Process of an α-configuration Sunspot