Liquid-liquid phase transition in confined liquid titanium
2023-03-13DiZhang张迪YunruiDuan段云瑞PeiruZheng郑培儒YingjieMa马英杰JunpingQian钱俊平ZhichaoLi李志超JianHuang黄建YanyanJiang蒋妍彦andHuiLi李辉
Di Zhang(张迪) Yunrui Duan(段云瑞) Peiru Zheng(郑培儒) Yingjie Ma(马英杰) Junping Qian(钱俊平)Zhichao Li(李志超) Jian Huang(黄建) Yanyan Jiang(蒋妍彦) and Hui Li(李辉)
1Key Laboratory for Liquid-Solid Structural Evolution and Processing of Materials,Ministry of Education,Shandong University,Jinan 250061,China
2College of Materials Science and Engineering,Taiyuan University of Technology,Taiyuan 030024,China
Keywords: titanium,layering transition,liquid-liquid phase transition,confined space
1.Introduction
Phase transition[1-4]as a typical concept is necessary for the comprehensive understanding of the physical properties of materials.Usually, conventional phase transition is induced by temperature and pressure.[5,6]Now, it is observed that a new phase transition mode is induced by confined space.[7-9]Heet al.[7]proposed that carbon film was transformed from two-fold coordinated liquid to three-fold coordinated liquid in a confined space.By investigating silicon carbide melt, Wuet al.[8]indicated that both the slit size and the pressure impacted the phase transition, which provided a new way to prepare special silicon carbide materials.In a confined space, not only non-metallic materials but also metal materials show interesting phenomena.Duanet al.[9]discovered the phase transition behavior of copper melt induced by density in a confined space.Phase transition and also the properties of materials in confined space have received significant attention.[10-18]Takehisaet al.[4]proposed that the phase transition of confined materials may be different from the bulk one,which may have unprecedented potential in biological research,[19,20]electrochemical devices[14,21]and catalysts.[22,23]For example, some gas hydrates confined in porous nanomaterials have wide application prospects in energy storage and carbon sequestration.[24-26]Besides these traditional applications, in environmental protection, removal of notorious sulfur compounds to produce low-sulfur-content(≤10 ppm) diesel within porous aromatic framework cavities is necessary and vital for modern industry.[16]An increasing number of experimental studies have demonstrated that metal or metal oxide nanoparticles confined in capped carbon nanotubes exhibit different catalytic activities,which provided confinement energy to enable prediction of confinement effects on catalytic activities in different reactions.[27]All of these indicate that materials in confined space show powerful application prospects.
Both theoretical and experimental studies have demonstrated the existence of layering upon confinement.[28]Hexadecane has been demonstrated to exhibit pronounced molecular layering upon confinement in gaps, which may play a key role in lubricating oils.[29]Besides, particles in ionic liquids could be stabilized using the layering of structured solvation.[30]Layering can even be used in medical research, such as in dentistry restorations.[31]Polyelectrolyte layering[32]confined in the porous structure enhanced the interaction between the membrane and the polyelectrolyte multilayer,which can be used in the treatment of municipal waste water.[33]The above-mentioned studies showed that layering as a fascinating phenomenon has some successful applications in various industries.Until now,although there has been considerable progress in the understanding of layering,studies on the layering of liquid metal are still limited.In this work,we will discuss the liquid-liquid phase transition of liquid titanium in a confined space.
Superior corrosion resistance, high mechanical strength and fine biocompatibility are the major advantages of titanium and its alloys, which are attracting increasing interest in wider industrial applications, especially in the aerospace industry[34-36]and biomedical applications.[37-41]Although titanium has wide applications,its mechanism of liquid-liquid phase transition and properties in confined space has not been well studied.In this article, we carry out a systematic study of liquid titanium confined in two infinite parallel walls using molecular dynamics(MD)simulation.This study will provide a better understanding of the liquid-liquid phase transition in the two infinite parallel walls, which may contribute to their application in various fields.
2.Models and methods
Molecular dynamics simulations are performed to study the structure of liquid titanium confined between two infinite parallel walls using the software package LAMMPS.The liquid titanium is initially arranged into a 30×30×1 hexagonal close-packed cubic (hcp) lattice and 1800 titanium atoms are used; the size of the simulation box is 87.19 °A×87.19 °A×4.67 °A.
In this article,the pair interaction between titanium atoms is modeled using the embedded-atom method (EAM), which was fitted by Acklandet al.[42]The interaction of the platinum walls and the liquid titanium is modeled using the modified embedded-atom method (MEAM), which was fitted by Kimet al.[43]In addition,the modified embedded-atom method(MEAM)proposed by Kavousiet al.[44]is applied to describe the nickel walls and titanium.Both the embeddedatom method and the modified embedded-atom method are suitable for metal melt systems.The interactions between the carbon wall and liquid titanium are described by the 6-12 Lennard-Jones(LJ)potentials with the following parameters:εTi-wall=0.0315 eV,σTi-wall=2.976 °A.[45]The normal of the walls is in thezdirection.Along thezdirection,the confined wall is imposed with the slit size varying from 8 °A to 15.5 °A.In the simulation,to improve the calculation efficiency,we fix the confined wall,which has been widely adopted in the study of confined systems.[46-49]We also studied the density distribution of liquid titanium under the unfixed confined wall with the same temperature as the liquid, which is very similar to the layering characteristics under the fixed confined wall (as shown in Fig.S1).Thus,it is reasonable to use the fixed confined wall in the simulation.Periodic boundary conditions are applied along thexandydirections.
For the system with carbon walls, simulations are performed using the constant number of molecules,pressure and the temperature (NPT) ensemble, while the constant number of molecules,volume and the temperature(NVT)ensemble is adopted for the system confined by platinum and nickel walls.A Nose-Hoover thermostat and barostat are adopted to control the temperature and pressure,respectively.For the carbon wall confinement,we exert a constant pressure within thex-yplane to analyze the effect of pressure on layering.All simulations are carried out using the velocity Verlet algorithm,which is used to integrate the equation of motions with a time step of 1 fs.We exert constant pressure parallel to the walls to analyze the effect of pressure on the layering.
The liquid titanium is heated to 3000 K,where relaxation is performed for 200 ps for equilibrium.Then,it is cooled to the target temperatureT=2100 K at a cooling rate of 1 K/ps.Final structures are obtained after relaxation for 2000 ps at the target temperatureT=2100 K,which is adequate for the system to reach its equilibration(as shown in Fig.S2).
3.Results and discussion
Confined walls as a crucial factor usually play an important role in a liquid-liquid phase transition.Figures 1(a) and 1(b)show that when the temperature,pressure and slit size are the same, the liquid titanium atoms display various layering phenomena in the different walls.This non-uniform system density distribution can be expressed by the density distribution function along theZdirection, which is cutting the system into a thin slice with the thickness of 0.05 °A in thezdirection and counting the atom number in each sheet divided by the volume as the density value in this location.Usually,atoms can scatter uniformly in free space.However, the situation of the atoms in confined space is different,and displays an outstanding non-uniform system density distribution.Obvious peaks are observed in the density distribution functions(ρ) along thezdirection, which correspond to the layers in the snapshots.Because the layering of the liquid titanium is a stable equilibrium state at a given slit size, pressure and temperature,we are sure it is the liquid-liquid transition.
In Fig.1(a), when the pressure is 0 bar, the temperature is 2100 K and the slit size is 9.5 °A,the liquid titanium atoms confined by carbon walls show two layers, while the case in Fig.1(b) is different.When confined by nickel walls, liquid titanium atoms form three atomic layers at the same temperature, pressure and slit size, meaning that this interesting phenomenon is caused by the confinement changes.Clearly,the liquid titanium shows two layers when confined in carbon walls but when confined in nickel walls it has three layers, indicating that the confinement from the carbon walls is stronger than that from the nickel walls.To further clarify this occurrence, we take another example.Keeping the same temperature and pressure but increasing the slit size to 11 °A,the density distribution functions and snapshots along thezdirection confined by platinum and nickel walls are shown in Figs.1(c)and 1(d).Notably,there are two peaks for liquid titanium atoms in the middle layer in Fig.1(d),indicating that the system begins to form four layers.Interestingly, in the same situation,the liquid titanium atoms confined by platinum walls only have three layers.However,its density peaks are sharper.In other words,its structure is denser than the atoms confined by nickel walls, which means that the confinement effect of the platinum is stronger than the nickel.
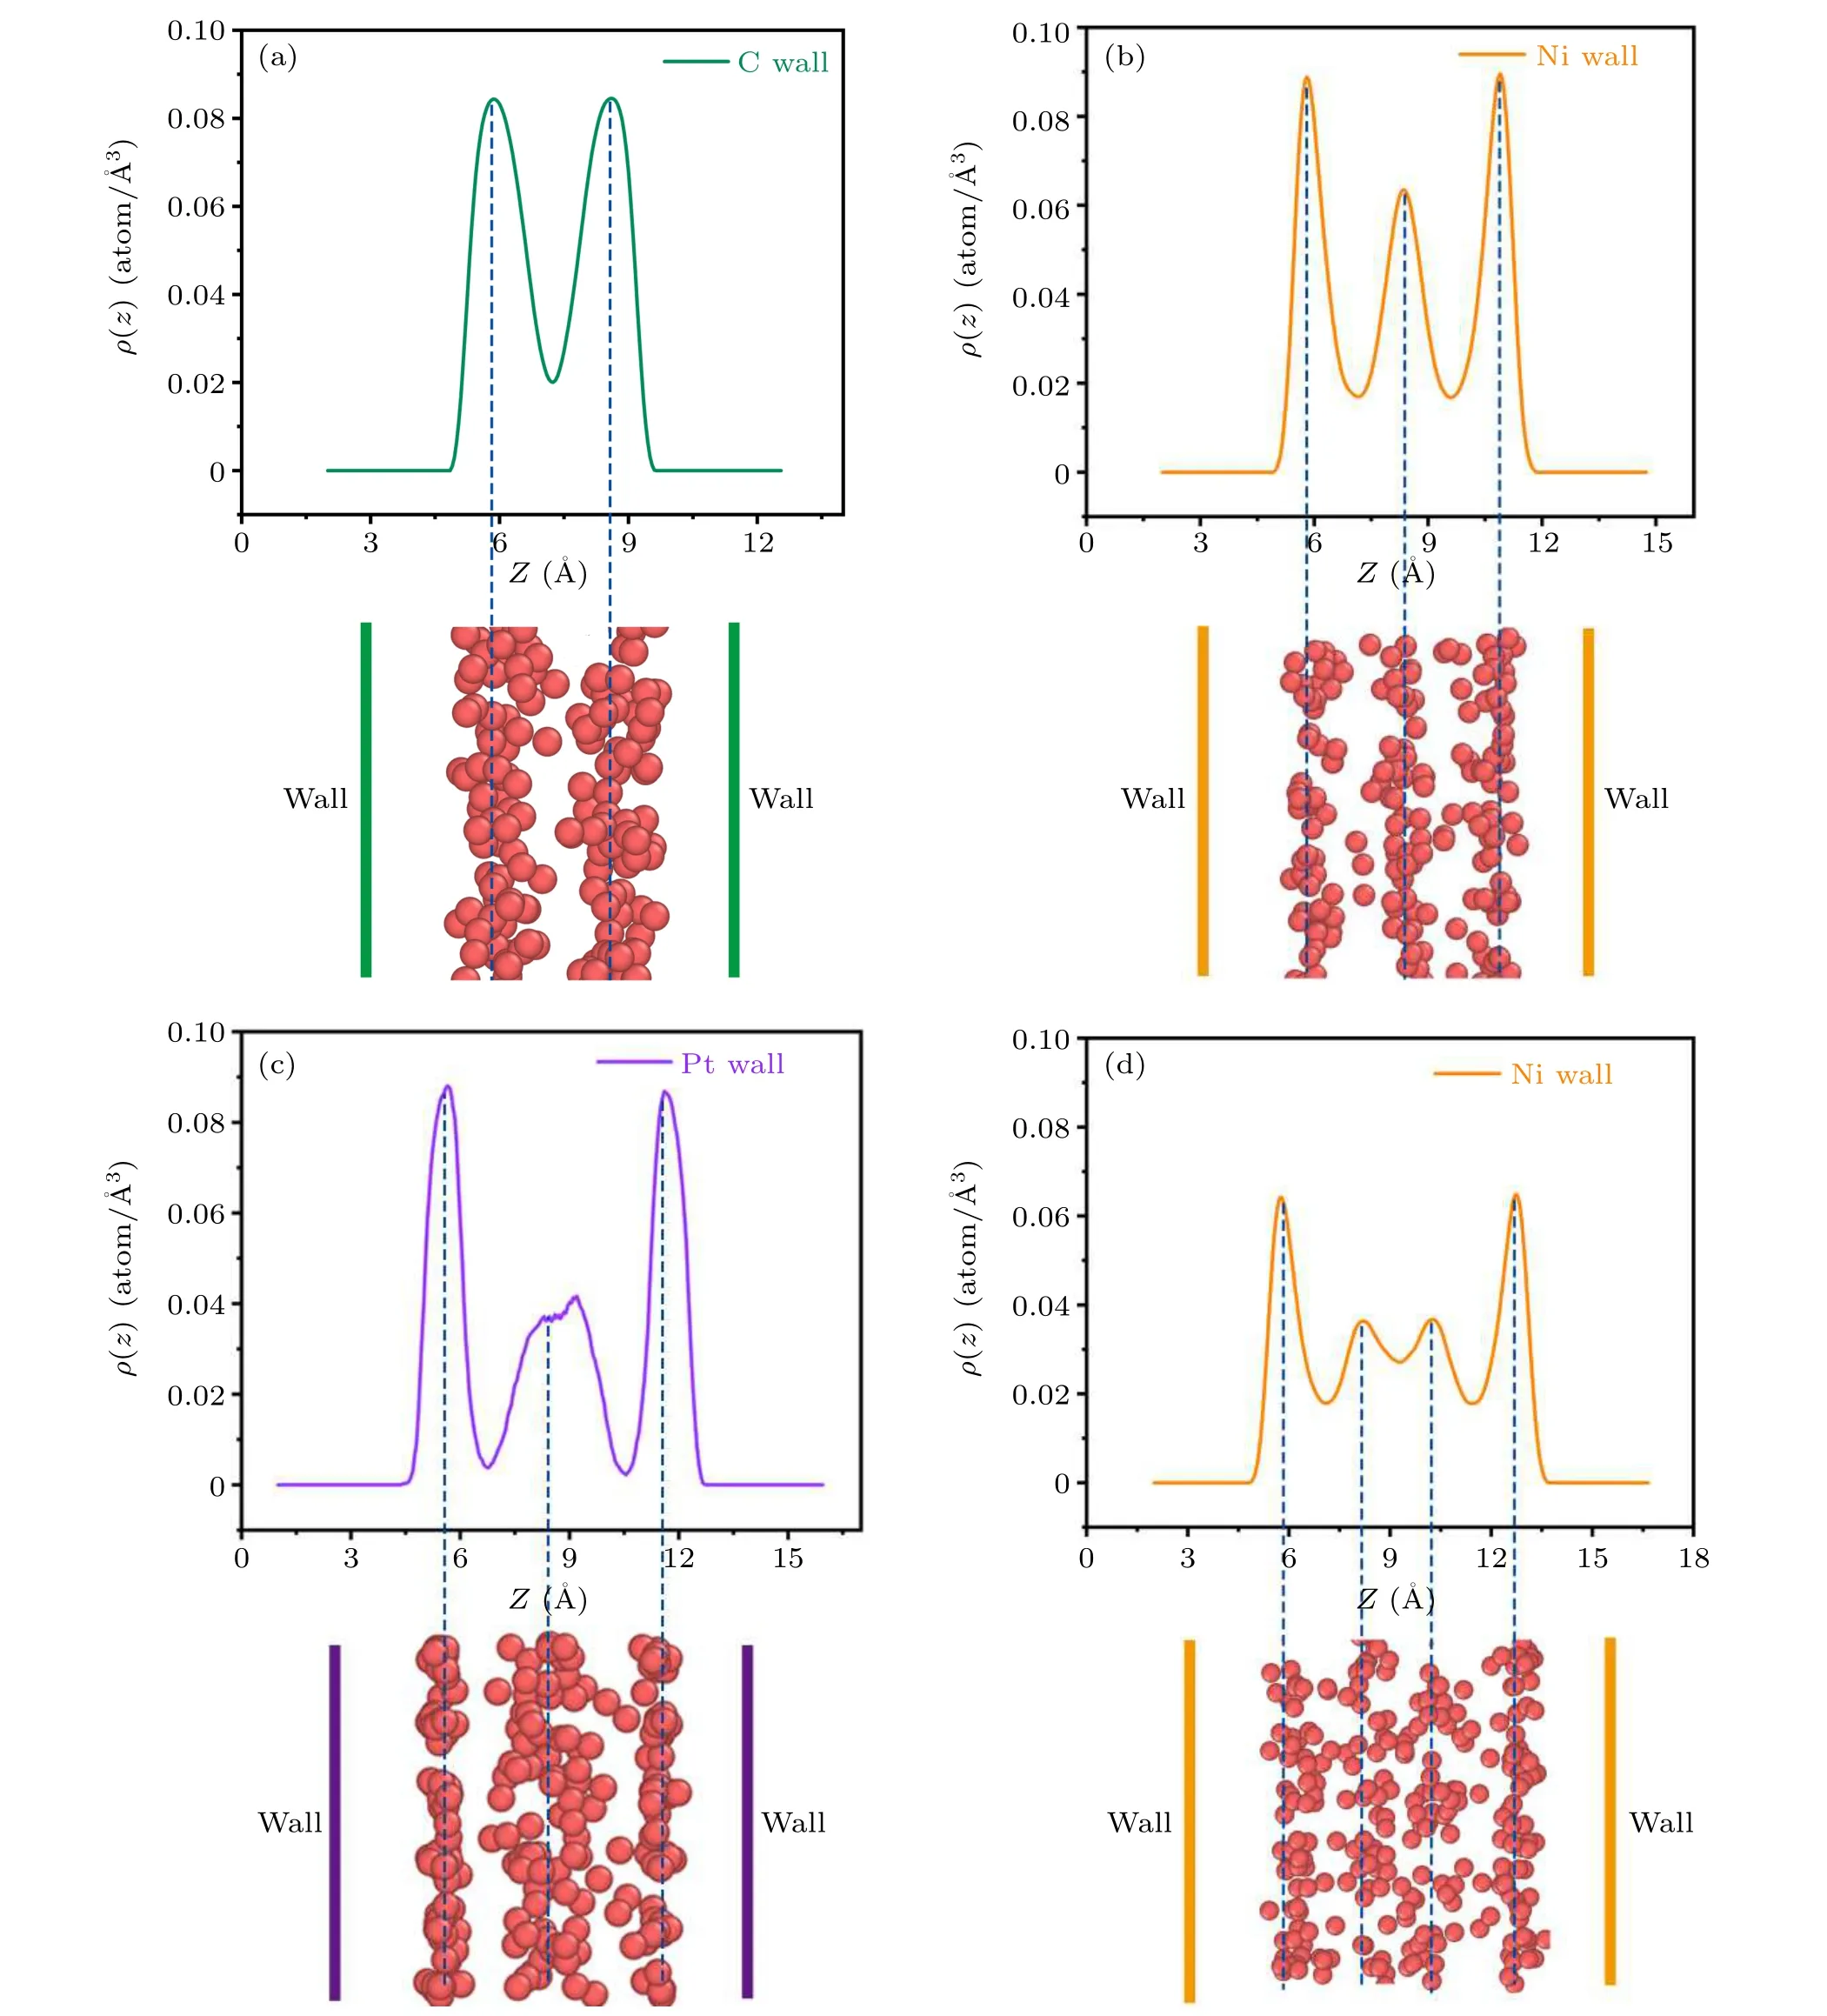
Fig.1.Density distribution functions(ρ)and snapshots along the z direction of the Ti atoms when T =2100 K,Pxy=0 bar(Pxy refers to the lateral pressure along the x and y directions): (a) the confined wall is carbon, slit size=9.5 °A; (b) the confined wall is nickel, slit size=9.5 °A; (c) the confined wall is platinum,slit size=11 °A;(d)the confined wall is nickel,slit size=11 °A.The peaks in the density profiles correspond to the layer locations in the snapshots,which are marked by a blue dashed line.The confined walls are displayed by the different colored solid lines.
Under different walls,the confined liquid titanium manifests as various layering phenomena,as shown in Fig.1,when the temperature and slit size are the same.The layering feature can be attributed to the attractive interactions between the wall and liquid titanium atoms and the wall’s geometric constraining effect, which forces the titanium atoms to order into an atomic layer near the wall.With regard to the atoms slightly away from the wall,they are still weakly attracted by the wall,but the repulsive interaction from the formed atomic layer makes them tend to group next to the nearest layer.This short-range order extends over a few atomic diameters and finally leads to a layering configuration.The layering can be characterized by a non-uniform system density distribution along theZdirection, as presented in Fig.1.The stronger confinement makes the liquid titanium have obvious layering because the greater short range interaction force from the walls makes the system become more ordered,which indicates that stronger confinement promotes the appearance of the liquidliquid phase transition.
To further prove the layering and liquid-liquid phase transition,we introduce the atomic volume and the system potential energy (Ep).Figure 2 demonstrates the variation of the atomic volume and the potential energy (Ep) of the liquid titanium atoms when the slit size ranges from 8 °A to 15.5 °A,the temperature is 2100 K and the pressure is 0 bar.The layer change is due to the alteration of the slit size.With regard to the titanium atoms confined by carbon walls,when the slit size ranges from 8 °A to 15.5 °A,the system transforms from two to four layers.The atomic volume and the system potential energy are the first derivative of the chemical potential and its mutation is usually accompanied by the phase transition, that is,the layering transition.The location of the colored rectangles,named the transition zone,indicates that the slope of the potential energy (Ep) or the atomic volume changes, which suggests that the liquid titanium becomes more unstable because of the strong atomic diffusion.For example,the system keeps two layers when the slit size ranges from 8 °A to 10 °A,which is called the two-layer zone.When the slit size ranges from 11 °A to 12.5 °A,the system finally transforms into three layers.Some intermediate regions, such as the colored rectangles from 10 °A to 11 °A,are the transition zone of the layer transition.The rest can also be deduced in this way, such as the transformation from three to four layers.
From the atomic volume shown in Fig.2(a), in the stable two-layer zone, three-layer zone and four-layer zone, the atomic volume increases with the increase in the slit size.However,in the transition zone,the atomic volume decreases with the increase in the slit size,showing a completely different trend.Due to the strong confinement in the transition zone,the diffusion ability of the liquid titanium atoms decreases and the volume decreases.When the layering transition occurs,the activity of the atoms increases, which means that the volume increases.It can be seen that, from the system potential energy in Fig.2(b),when the slit size increases from 8 °A to 10 °A,there is no big change in potential energy.However,the potential energy suddenly decreases dramatically when larger than 10 °A, indicating the occurrence of layering transition.Similarly, the potential energy at the three-layer zone also experiences a relatively stable stage and is then followed by another drop.Certainly, another layering transition takes place.With the increase in the slit size, the slope of the system potential energy curve changes in several stages.The system potential energy curves have a downward trend,indicating that the layering of the liquid titanium is not stable because its potential energy is very high.

Fig.2.(a)Atomic volume and(b)system potential energy(Ep)as a function of the slit size and the corresponding snapshots when T =2100 K,without lateral pressure applied, confined by carbon walls.The colored rectangles suggest the transition region.
It can also be seen in Fig.2 that in the first transition region the variation range of the atomic volume and potential energy is bigger than that in the second transition zone because the slit size of the first transition region is small and the confinement effect is strong, and the phase transition is obvious.Therefore, the layering transition of the confined liquid titanium accompanied by the mutation of volume and the system potential energy is a distinctive phase transition that does not exist in the bulk.The confinement effect is the necessary condition for the liquid-liquid phase transition.The smaller the slit size,the more obvious the phase transition characteristics.When the slit size becomes large, the system shows the nature of the bulk and the characteristics of the liquid-liquid phase transition become not obvious.
To further investigate the effect of the slit size on the layering phenomenon, figure 3 displays the density distribution functions along thezdirection of the liquid titanium confined in carbon walls in which the system transforms from two layers to four layers when the slit size ranges from 8 °A to 14.5 °A.As we can see in Figs.3(a)-3(c), each density peak corresponds to an atomic layer in the confined liquid titanium.The confined liquid titanium atoms aggregate at the positions of different density peaks,displaying an outstanding discontinuous distribution.Next,we investigate the influence of slit size on layering.Figure 3(a)shows that when the slit size is 8 °A,the confined liquid titanium becomes two layers.When the slit size is increased to 8.5 °A, the layering structure becomes inconspicuous.Therefore,we can draw the conclusion that the slit size will affect the layering phenomenon.With regard to other situations,Fig.3(b),for example,demonstrates that the slit size of 11 °A shows the most obvious layering.Increasing or decreasing the slit size on a small scale has little effect on the system layering.It only affects the degree of the layering rather than the number of layers.The situation in Fig.3(c)exhibits the same state as Fig.3(b).In Figs.3(a)-3(c),all the green lines represent the most obvious layering.These results show that increasing the slit size on a small scale has little effect on the system layering.
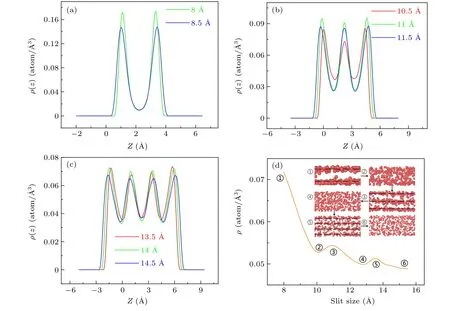
Fig.3.Density distribution functions(ρ)along the z direction of the Ti atoms confined by carbon walls when T =2100 K,Pxy=0 bar(Pxy refers to the lateral pressure along the x and y directions): (a)-(c) refer to the system from two to four layers.(d) The density of the system and the corresponding snapshots.
Figure 3(d)shows the density(ρ)of the liquid as the slit size increases from 8 °A to 15.5 °A whenT= 2100 K andP=0 bar.Theρis the density of the system, which is obtained by dividing the atom number by the system volume at different slit sizes.We observe the distinct density fluctuations as the slit sizes increase.Because the layering transition makes the confined liquid denser and diminishes the total volume of the atoms, the system density will increase during the layering transition.Subsequently,with the changes in the layer numbers,liquid layers disappear and the arrangement of atoms becomes disordered,which makes the density decrease.Thus,obvious density fluctuations can be seen in Fig.3(d)and the corresponding snapshots can also exhibit the density fluctuations.Figure 3(d) also shows that when the system density goes up and down once, the layering of the system increases one more layer;therefore,we believe that the process of liquid-liquid transition is accompanied by density fluctuation.To investigate this law, we take the layering transition from two layers to three layers as an example.When the slit size is at 8 °A,the system is two layers.When the slit size is increased to 11 °A,the system becomes three layers.Meanwhile,the system density experiences a wave trough at 10 °A.And the wave troughs are the turning point of the system chaos.Before this point, the system density continues to decrease and the system becomes disordered.And at this point,the liquid atoms rearrange and their arrangement is most confusing.Next, the system density increases,and the liquid becomes ordered and begins to form three layers.In addition, with the increase in the slit size, the system density continues to decrease, which means that the effect of the confinement becomes weak.
Besides slit size, pressure and temperature also affect the liquid-liquid phase transition.Next, we investigate how these two factors affect it.Figure 4(a) illustrates the density distribution function at different temperatures by fixing the slit
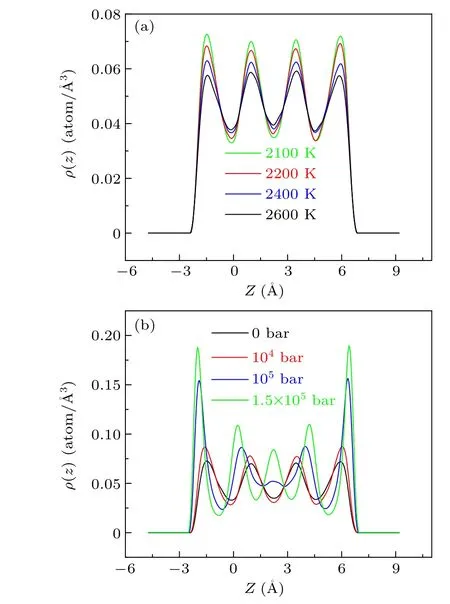
Fig.4.Density distribution functions (ρ) along the z direction for Ti atoms confined by carbon walls: (a) Pxy = 0 bar, slit size = 14 °A;(b)T =2100 K,slit size=14 °A.
size and pressure of the system.With the temperature increasing,the density peaks become lower and wider,which exhibits that the layer does not become denser when the temperature increases.This is because,at high temperatures,the liquid titanium atoms have adequate kinetic energy to overcome the confinement from the walls and activity flexibly.Therefore,lowering the temperature will make the layering denser.The effect of the variation of the temperature on the density peaks is not obvious and does not involve the change in the number of layers.This phenomenon means that the effect of the temperature on layering is weaker than the pressure.Figure 4(b)shows the density distribution function along theZdirection under different pressures by fixing the slit size and temperature of the system.As we can see, when the pressure is increased from 0 bar to 1.5×10⁵bar, the system layering becomes obvious.When the pressure is increased from 0 bar to 104bar,the density peaks become wide and low,which illustrates that the arrangement of the atoms along theZdirection is relatively loose.In addition,the numbers of the peaks always remain unchanged when the pressure increases from 0 bar to 104bar.When the pressure is increased to 105bar,the density peaks become top and sharp, which shows that the arrangement of the atoms is denser.When the pressure is increased to 1.5×10⁵bar,the layer numbers increase from four to five,indicating that the new layering transition takes place.The effect of the pressure on the layering is different from the effect of the temperature on the layering.Pressure can affect the layering in a confined space and can even cause changes in the layer numbers and their location.However, the temperature impossibly causes layer transition when the pressure and slit size are fixed.
Compared with temperature,pressure is an essential factor that affects the layering transition, which can cause the number of layers to increase.The liquid atoms in the layers are arranged very tightly when the density of the liquid layer becomes large to a certain extent,indicating that the repulsive force of the atoms increases.To decrease this repulsive force,some atoms will come out from the layers and form new layers in the gaps between layers.Finally, the number of layers increases and the liquid becomes more ordered.
According to the above analysis, slit size, pressure and temperature all affect the liquid-liquid phase transition of the liquid titanium.Therefore, to gain a better understanding of the layering transition, we draw the layering transition diagram of the liquid titanium confined in the carbon wall in Fig.5.The phase diagram is obtained by connecting the transition points(as shown in Fig.S3),and the colored areas represent the 2-layer, 3-layer, 4-layer, 5-layer, and 6-layer structures,respectively.

Fig.5.Phase diagrams of the layering transition for liquid titanium confined by carbon walls: (a)pressure=0 bar;(b)temperature=2100 K.
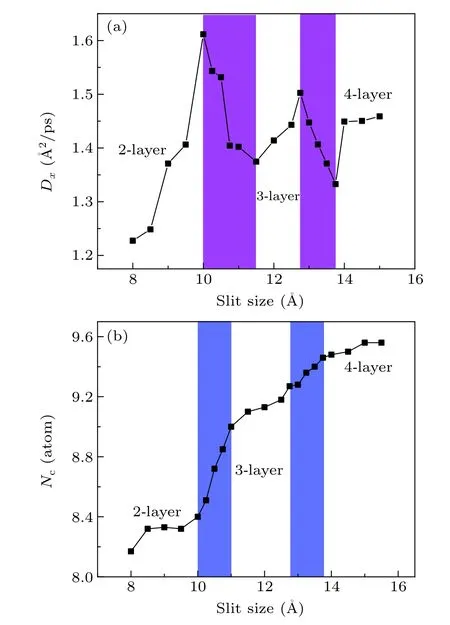
Fig.6.(a)The diffusion coefficient along the x direction(Dx)as a function of the slit size at T =2100 K,Pxy=0 bar when the confined wall is carbon.(b)The coordination number(Nc)as a function of the slit size at T =2100 K,Pxy=0 bar when the confining wall is carbon.The coordination number is calculated by counting the atom number within the first shell.The meaning of the colored rectangles is the same as in Fig.2.
Figure 5(a)shows the temperature-slit size diagram when the pressure is 0 bar.As mentioned above,the temperature has little effect on the layering transition and the layering transition line is almost parallel to thexaxis over the given temperature range.In other words, when the slit size and pressure are fixed,changing the temperature cannot cause layering transition.The pressure-slit size phase diagram is presented in Fig.5(b).Obviously, the pressure effect on the layering transition is different from the temperature.In the low pressure zone,the layering transition line is almost parallel to thexaxis, which suggests that the layering transition is mainly induced by the confinement.Meanwhile, the layering transition line is steep in the high-pressure zone,indicating that the layering transition is mainly induced by pressure.
The diffusion coefficient is used to characterize the activity of atoms, which can be computed by taking the derivative of the mean square displacement(MSD),as displayed in Fig.6(a).The diffusion coefficient along thexdirection or along theydirection is the same;therefore,we select the diffusion coefficient along thexdirection here.In the stable 2-layer,3-layer,and 4-layer regions,the diffusion coefficient increases with the increase in the slit size.When the slit size is larger,the restriction from the confinement wall on atomic motion is weaker, so the atomic diffusion coefficient increases.But in the transition region, the diffusion coefficient decreases with the increase in the slit size.The diffusion coefficient reaches its maxima when the slit size=10,12.75 °A,which shows that an increase in the atomic diffusivity favors the formation of new layers.The atomic diffusion is accompanied by the formation of new liquid layers and the diffusion coefficient curves fluctuate, which indicates the occurrence of the liquid-liquid phase transition.
Figure 6(b) shows the coordination number of the system.The coordination number is another important physical quantity used to characterize the structure of the liquid metal.Here,we calculate the coordination number of systems under different slit sizes,with the aim to further investigate the structure characteristics of the phase transition caused by the confinement.In addition,the coordination number is obtained by counting the atom number within the cutoff radius around the atom.For the titanium atoms confined by carbon walls,the coordination number changes slowly in the 2-layer,3-layer,and 4-layer zones.However, in the transition zones, it increases rapidly.Therefore, the structural features of transition zones are different from the stable layer zones, which further provides evidence of phase transition.
4.Conclusion
The layering and liquid-liquid transition of liquid titanium was evaluated using molecular dynamics simulations.As a consequence,the essential condition that causes the discontinuous distribution, named the layering phenomenon, is confined space.Different confined walls and slit sizes induce different layering phenomena.One of the typical characteristics of liquid-liquid transition is the slope of the atomic volume and the system potential energy.Slit size, temperature and pressure are all influencing factors in the layering,in which the effect of temperature on layering is minor.The slit size and pressure play an important role in layering,which will affect the number of layers.We draw two different phase diagrams of the layering transition to clearly understand the layering transition.We highlight the abnormal changes in the coordination number and the diffusion coefficient,which further verify the existence of the liquid-liquid phase transition.The direct observation of the layering of liquid titanium within the slit allowed us to characterize the liquid-liquid phase transition.These results provide a crucial simulation input to help as a guide to control the liquid structure for the application of layering materials.Moreover, these research results are valuable for a better understanding of heterogeneous nucleation in confined space.
Acknowledgments
Project supported by the National Natural Science Foundation of China (Grant Nos.U1806219 and 52171038), the Special Funding in the Project of the Taishan Scholar Construction Engineering and the Program of Jinan Science and Technology Bureau (Grant No.2020GXRC019), and Key R&D Projects in Shandong Province, China (Grant No.2021SFGC1001).
猜你喜欢
杂志排行

Chinese Physics B的其它文章
- Matrix integrable fifth-order mKdV equations and their soliton solutions
- Comparison of differential evolution,particle swarm optimization,quantum-behaved particle swarm optimization,and quantum evolutionary algorithm for preparation of quantum states
- Explicit K-symplectic methods for nonseparable non-canonical Hamiltonian systems
- Molecular dynamics study of interactions between edge dislocation and irradiation-induced defects in Fe-10Ni-20Cr alloy
- Engineering topological state transfer in four-period Su-Schrieffer-Heeger chain
- Spontaneous emission of a moving atom in a waveguide of rectangular cross section