Generation of air discharge plasma in the cavities of porous catalysts: a modeling study
2023-03-06MengjiFU符梦辑KefengSHANG商克峰BangfaPENG彭邦发NaLU鲁娜NanJIANG姜楠andJieLI李杰
Mengji FU(符梦辑),Kefeng SHANG(商克峰),2,*,Bangfa PENG(彭邦发),2,Na LU (鲁娜),2,Nan JIANG (姜楠),2 and Jie LI (李杰),2
1 School of Electrical Engineering,Dalian University of Technology,Dalian 116024,People’s Republic of China
2 Key Laboratory of Industrial Ecology and Environmental Engineering,Ministry of Education of People’s Republic of China,Dalian 116024,People’s Republic of China
Abstract A study of the behaviors of air discharge plasma inside a catalyst’s pores is important to understand the plasma catalysis mechanism; however,few articles have reported the generation characteristics of air plasma in the pores of catalysts.The production of air microdischarge in a pore was studied by a two-dimensional fluid model,mainly focusing on the effect of pore size and applied voltage.The results show that an increase in the pore size in the range of 20-100 μm facilitates the occurrence of microdischarge in the pore.In addition,at an applied voltage of 9 kV,the ionization of air mainly occurs near the topside of the pore when the pore diameter is less than 20 μm,leading to a low plasma density in the pore,but the time-averaged plasma density in the pore reaches a maximum value at a 70 μm pore diameter.Moreover,the applied voltage also has an important effect on the production of air microdischarge in the pore.The existence of a pore of 80 μm diameter on the dielectric has no obvious influence on the plasma density in the pore at 2 kV applied voltage,but the plasma density in the pore begins to sharply rise when the voltage exceeds 3 kV due to the enhanced air ionization at higher applied voltage.The study indicates that microdischarge can be generated in a pore with a size of tens of micrometers,and the microdischarge in porous catalysts will affect the catalytic degradation efficacy of gaseous pollutants.
Keywords: microdischarge in pores,plasma catalysis,pore size,applied voltage
1.Introduction
Volatile organic compounds (VOCs),including more than 120 kinds of organic gases,are one of the key carriers of PM2.5 and photochemical smog,which induce severe air pollution [1].VOCs are mainly emitted from industries such as petrochemical industries,vehicle manufacturing,electronic manufacturing,furniture manufacturing and bio-pharming,etc.For waste gas containing VOCs of low concentration,various destruction methods,including discharge plasma treatment[2-10],are used for the removal of VOCs from the gas.During electric discharge in air or at an air/water interface,reactive oxygen species including O,OH and O3are generated,and these active species can react with organic pollutants to produce CO2,H2O,etc[11-13].The degradation of pollutants by electric discharge plasma is fast and nonselective.Therefore,various discharge plasma technologies,especially plasma catalysis processes including the in-plasma catalysis (IPC) and post-plasma catalysis (PPC) processes,have been extensively studied for treating contaminated gas[14].In the IPC process,a catalyst packed in the discharge zone will remarkably enhance plasma chemical reactions via the efficient use of short-lived and long-lived species and the synergy between catalyst and plasma,etc[15].Tuet alfound that there is a combination of surface discharge and microdischarge in the packed bed plasma reactor,and the filamentary microdischarge begins to expand and diffuse to form the surface discharge with the increase in discharge power[16].Wanget alreported that the packed bed DBD reactor in atmospheric dry air may appear in the form of forward restrike,filamentary microdischarge and surface discharge.Moreover,the streamlined propagation and the generation of reactive species are faster at a higher dielectric constant [17].
The catalyst particles are usually porous.Recently,the microdischarge phenomenon in the pores of catalysts has been paid attention to.Holzeret alreported that reactive species could be generated in catalyst pores since the electric field in the pores of porous catalysts is stronger than that in the air gap [18-20].Henselet al[21-24]experimentally studied the generation of microdischarge in porous particles under a high DC voltage (2-10 kV) and found that electric discharge happens in pores of 15 μm diameter,and that the onset voltage of the microdischarge decreased with the increase in pore size.However,it is impossible to experimentally measure the plasma characteristics (e.g.the electron density and electron temperature,the ionization rate,etc) in pores.Zhanget alstudied the microdischarge characteristics in pores under a He atmosphere via numerical simulation[25-28]and found that microdischarge can occur in pores of specific sizes.Wanget alinvestigated the formation of microdischarge and the propagation of plasma flow in pores of different diameters and depths,and found that a larger voltage can make the plasma flow penetrate smaller pores,and the pore size and depth can lead to enhanced discharge in pores by influencing the surface charge of the side wall of porous catalysts [29].Zhanget alstudied the formation of microdischarge in micro- and nanocatalyst pores using a two-dimensional intracellular particle/Monte Carlo collision model and found that microdischarge can form in both microns and nanopores [30].However,the plasma catalysis process for gaseous pollutant treatment usually happens in air atmosphere,so these simulation studies on microdischarge in pores under He atmosphere [26-28]are inconsistent with the application background,or the simulation parameters are out of the actual electric discharge conditions [30].
In this work,a two-dimensional fluid model was established to study the microdischarge in a pore in air atmosphere.This study is important to understand the air plasma behavior in a catalyst’s pores,which is helpful in the design of suitable porous catalysts of special pore size for gaseous pollutant treatment in the electric discharge process.
2.Description of the model
A two-dimensional fluid model is established by COMSOL software[31].The main steps include the establishment of the model,the setting of variables,the selection of collision response equation,the setting of boundaries and the division of the network.The model adopts the usual DBD configuration,which is extensively used for gaseous pollutant treatment,as shown in figure 1.From top to bottom,the ceramic with a thickness of 1 mm is connected to the highvoltage electrode,then there is an air gap with a thickness of 2 mm,and then the ceramic with a thickness of 0.5 mm is grounded.A positive pulse voltage is applied(the rise time is 400 ns and the fall time is 400 ns).Since the experiment is basically carried out in air,we choose N2(79%) and O2(21%) as the medium in the air gap and set the gas temperature to 300 K.The gas pressure is set to 1 atm.The relative dielectric constant of the selected material is 9.Twenty-six important plasma reactions (table A1) involving e,N2,O2,,O3and O-are included in the model,and the reaction rates of the first five formulas are calculated from the collision cross-section data by solving the electron Boltzmann equation (BE) with BOLSIG+ [32-34].The required average electron energy and its transport coefficient (R1-R5) are also calculated by BOLSIG+ [35].
The required parameters are obtained through a set of coupled equations.The continuity equations of electron density and electron energy are given as equations (1) and (2),respectively.
Here,ne,nε,μeandμεare the electron number density and electron energy density,electron mobility and electron energy mobility,respectively.DeandDεare the electron diffusion coefficient and electron energy diffusion coefficient,respectively.Eis the electric field vector.ReandRεare the source terms for the electron density and electron energy,respectively.
Heavy species follow the continuity equation (3):
Here,wk,Vkand Rkare the mass fraction,velocity and source term of the heavy species (k),respectively.Drift is only suitable for electrons and ions,and neutral species contain only diffusion terms.
In addition,the Poisson equation (4) is used to solve the electric field.
Here,V is the electric potential and ρchargeis the space charge density,which is zero inside the dielectric material.ε0is the vacuum dielectric constant and εris the relative dielectric constant.
The boundary conditions of electron flux during surface scattering and absorption of electrons at the cathode and anode are as follows:
Γeand n are the electron density flux and the electrode normal vector,respectively.γeis the reflection coefficient of electrons on the electrode surface,which is 1 when the direction of the electron flux is towards the electrode,and otherwise it is 0.ve,this the thermodynamic velocity of the electron.
The boundary condition of the conservation equation for electron energy density on the electrode surface is as follows:
Γεis the electron energy flux vector andis the average electron energy.
The initial electron density is set as 1013m-3.The average electron energy follows Maxwellian distribution and the initial value of the average electron energy is 2 eV.The secondary electron emission coefficient in this model is set as 0.01 and the average energy of secondary electrons is 2 eV [36].Quadrilateral mesh is mainly used in the air gap bulk region,and the mesh size is about 12 μm.The size of the grid near the positive plate is 1-2 μm.For the grid near and in the pore,a triangular grid with a size of about 0.5-1 μm is adopted.In other areas,coarse grids are used under the condition that they will not affect the reliability of the calculation model.The nonlinear method is constant(Newtons),with a maximum number of iterations of 4 and a tolerance factor of 0.1.The solver uses PARDISO.The minimum out-of-core memory fraction is 0.99,the minimum in-core memory is 512 MB,the total memory usage ratio is 0.8,and the internal memory usage factor is 3.The selected time-stepping method is the backward difference formula.The initial step size adopted by the solver is 10-14s,the maximum backward difference formula (BDF) order is 2,and the minimum BDF order is 1.The event tolerance is 0.01,and the backward Euler method is used for uniform initialization.
3.Results and discussion
The microdischarge characteristics of a porous catalyst under different pore sizes and voltages are studied by calculating the distribution of plasma density,electron temperature,electric field,ionization rate and electric potential.During the study,the voltage amplitude is set as 9 kV,and the ratio of fixed aperture to depth is 0.51.
3.1.Effect of pore size on microdischarge generation in a pore
3.1.1.The onset microdischarge.Henselet alreported that the pore size has an important effect on the air microdischarge in pores,and the onset voltage of microdischarge in pores is lower at a larger pore aperture[22,23].However,it is difficult to directly observe the microdischarge phenomenon in pores.The ionization rate is studied as a direct basis to judge whether microdischarge occurs in pores.To understand the effect of pore size on onset microdischarge in pores,the ionization rate (figure 2) and electron density (figure A1) in and above the pore for different pore diameters (20-100 μm)at different times are numerically simulated.
Figures 2 and A1 indicate that strong ionization occurs preferentially in the pores of larger size.When the pore diameter is 20 μm,strong ionization mainly appears in the bulk region and near the pore opening,and the ionization in the pore is low(1024m-3s-1),so that the electron density in the pore is the lowest in the whole air gap.However,ionization occurs in the pore of 60 μm at 155 ns,and even at 120 ns,strong ionization occurs near the opening of the 80 μm pore and in the 100 μm pore.Moreover,strong ionization (1026m-3s-1)occurs in the bottom of the pore of 100 μm diameter,and the electron density in the pore also reaches a maximum value.

Figure 1.(a) Calculation model and (b) enlarged view of the pore.

Figure 2. Ionization rate in gas gap at different times and pore sizes.
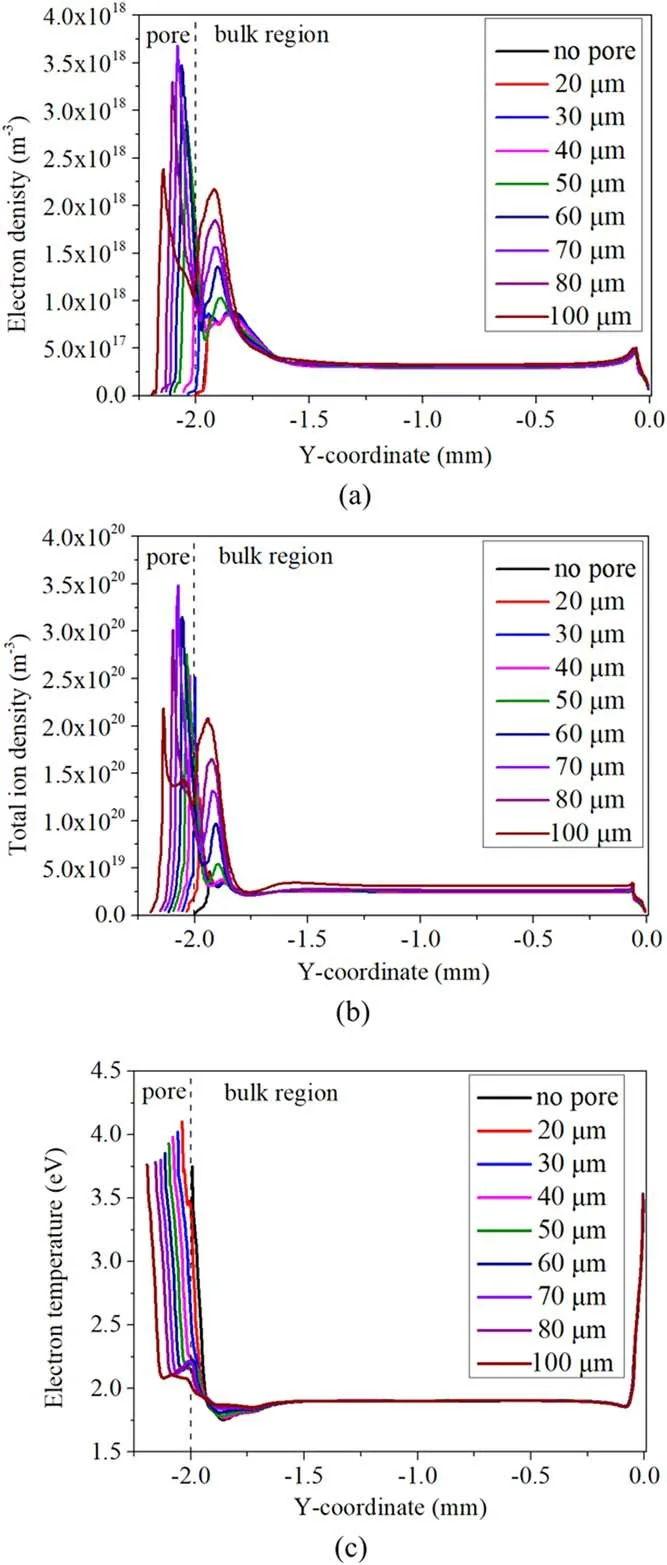
Figure 3.Distribution of the time-averaged (a) electron density,(b) total ion density and (c) electron temperature along the vertical centerline in air discharge of 9 kV for different pore sizes.

Figure 4.Distribution of the time-averaged electric potential and electric field for different pore sizes:(a)20 μm,(b)60 μm,(c)100 μm,for an air discharge sustained at 9 kV.
3.1.2.The plasma characteristics.To further understand the effect of pore size on the plasma characteristics in the air gap,the time-averaged electron density,total ion density and electron temperature are calculated,and their distribution curves along the vertical centerline from the pore bottom to the top dielectric plate (y= 0 mm) are given in figure 3.Figure 3(a) clearly shows that the distribution of electron density in the air gap is relatively uniform when there is no pore at the bottom,and the maximum value of electron density appears at the bottom of the air gap.When there is a small pore of 20 μm on the dielectric,the strong electric field in the pore(see figure 4(a))causes a large loss of particles on the wall and pushes electrons out of the pore,leading to low electron density in the pore,but the electron density in the bulk region(air gap)is hardly affected by the existence of the pore.However,the electron density in and near the pore begins to rise sharply when the pore diameter exceeds 30 μm,and the electron density in the pore with 70 μm diameter reaches a peak value of 3.7 × 10¹⁸m-3,which is about one order of magnitude higher than in the bulk region.

Figure 5. Distribution of the time-averaged (a) electron density,(b) electron temperature and (c) total ion density along the vertical centerline in air discharge with 80 μm pore at different voltages.
As indicated in figure 3(b),the distribution of total ion density in the pore is similar to that of the electron density,and the total ion density in the pore of 70 μm is also the largest(3.5 × 10²⁰m-3),which is five times higher than that without a pore.The effect of the pore size on the total ion density is different from the effect on the ionization rate,which reaches the largest value in the pore of 30 μm diameter (figure A3).The results can be explained as follows: although the ionization rate in the pore tends to decrease when the pore size is bigger than 30 μm,a large pore size is helpful for accommodating more electrons and ions,which resulted from the ionization of air in the pore,leading to a higher total ion density in the pore of 70 μm.
Figure 3(c) shows that the electron temperature in and near the pore is higher,therefore a higher energy of electrons enhances the ionization process and produces more electrons,which explains the effect of the pore on the distribution of electron density and total ion density.However,we observed that the electron density at the pore bottom decreases to a low value.The result is attributed to the special electric potential distribution in the pore(see figure(4)).Figures 4(a)-(c)show the distribution of time-averaged electric potential and electricinside and above the pore at three typical pore sizes.Figure 4 indicates that the electric potential at the bottom of the pore is low,and the strong reverse electric field pushes the electrons from the bottom to the middle of the pore and to the bulk region,resulting in a low electron density at the pore bottom [27].In addition,we can observe that the distribution of electric potential lines in and near the pore is relatively flat and dense when the pore is small (20 μm).As the pore grows larger (60 μm and 100 μm),the electric potential lines begin to bend toward the bottom medium(especially inside the pore) and are sparsely distributed in most areas of the pore,which explains the distribution of the electric field.
3.2.Effect of applied voltage
Zhanget alreported that the plasma Debye length decreased when the voltage was increased under certain conditions,making it easier to generate electric discharge in smaller pores[30].Henselet alalso found that the luminous intensity increases with the increase in discharge power when the fixed aperture is 80 μm [24].These studies show that the applied voltage notably affects the microdischarge in pores.Figure 5 shows the distribution of time-averaged electron density,electron temperature and total ion density along the vertical centerline of the pore at different voltages.As shown in figure 5(a),when the voltage is 2 kV,the electron density in the pore (y= -2.03 mm) and near the pore (y= -1.7 mm)shows two peak values,which are higher than those in the bulk region and near the top dielectric plate,but the electron density is low (1017m-3),especially at the pore bottom.When the voltage increases to 6 kV,the maximum electron density in the pore(2.1 × 10¹⁸m-3)is noticeably higher than that at the pore opening (1.2 × 10¹⁸m-3) and in the bulk region (2.5 × 10¹⁷m-3).Moreover,the electron density in and near the pore differs from that in the bulk region,and the difference is more apparent when the voltage further rises.Figure 5(b) shows that the electron temperature in the pore,near the pore and near the top dielectric plate is higher at higher applied voltage,which leads to a higher electron collision ionization rate (figure A4) and total ion density(figure 5(c)).Figure 5(c) shows that the total ion density decreases to a low value at the bottom of the pore and near the positive polar plate,and the distribution of total ion density in the whole air gap is relatively uniform (1019m-3) when the voltage is low(2 kV).The total ion density in the pore and in the bulk region begins to differ by one order of magnitude when the voltage increases (9 kV),indicating that the ionization in the pore is greatly improved at higher voltage.The stronger electric field at higher applied voltage facilitates the production of electrons of higher energy,leading to a more efficient collision of electrons with air to generate more ions.The results also prove that the generation of plasma in the pore increases significantly at higher voltage,therefore leading to different discharge behaviors.
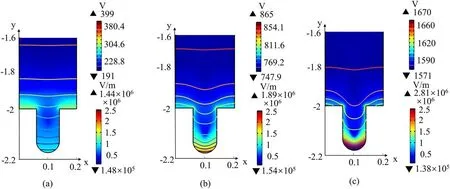
Figure 6.Distribution of the time-averaged electric potential and electric field for applied voltages of(a)2 kV,(b)6 kV and(c)12 kV,for an air discharge with an 80 μm pore.
Although it was observed that the electric field in the pore is significantly enhanced at 2 kV,the discharge behavior is still different from that at higher voltage.Figure 6 shows the distribution of time-averaged electric potential and electric fieldinside and above the pore with different voltage amplitudes and a pore size of 80 μm.It can be seen that the electric field in and near the pore is significantly greater than that in the bulk region at a voltage of 2 kV,but the electric potential lines away from the pore are flat.However,when the voltage exceeds 6 kV,the electric potential lines in the bulk region begin to bend,and they are very dense at the pore bottom (especially at 12 kV).Moreover,the influence of the pore on the electric potential in the air gap is greater at higher applied voltage,and a strong electric field can be seen at the pore bottom,which explains the low electron density at the pore bottom.Holzeret al[18]proposed that the electric field in the pore must be higher than the electric field in the body if short-lived species are produced in the pore.The simulation results agree well with the experiment.The results show that the applied voltage and aperture have important effects on the characteristics of microdischarge in the pore.
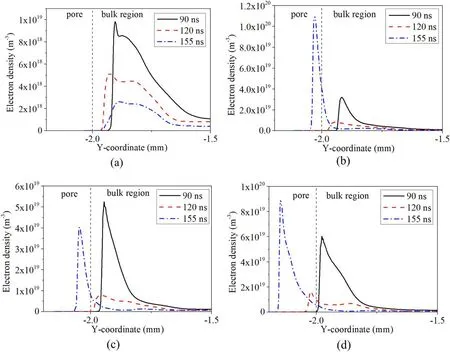
Figure A1.Electron density along the centerline of the pore,inside and above the pore,at three different times(90 ns,120 ns and 155 ns),for four different pore sizes: (a) 20 μm,(b) 60 μm,(c) 80 μm,(d) 100 μm.
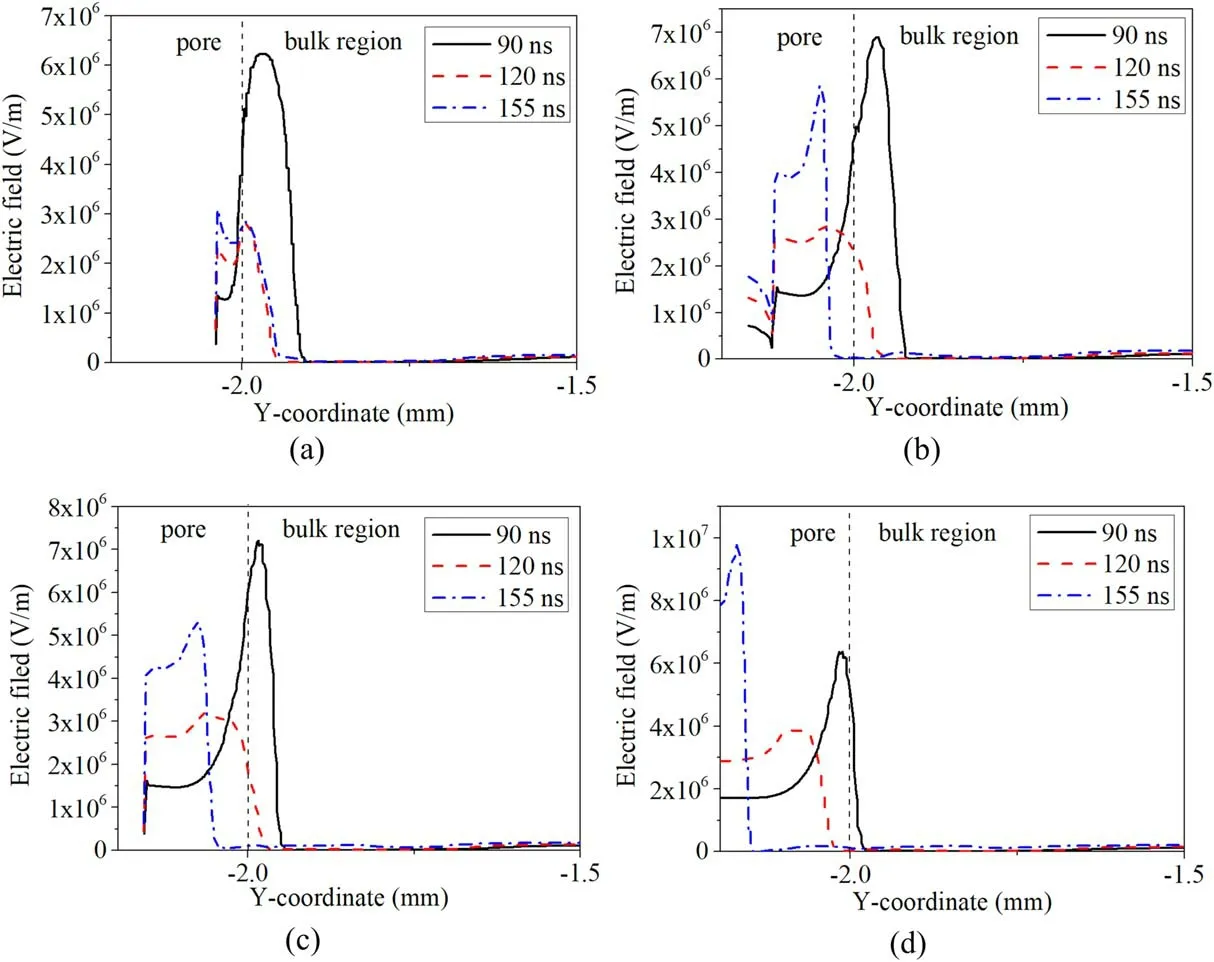
Figure A2.Electric field along the centerline of the pore,inside and above the pore,at three different times (90 ns,120 ns and 155 ns),for four different pore sizes: (a) 20 μm,(b) 60 μm,(c) 80 μm,(d) 100 μm.

Figure A3. Distribution of the time-averaged ionization rate along the vertical centerline in air discharge of 9 kV for different pore sizes.

Figure A4.Distribution of the time-averaged ionization rate along the vertical centerline in air discharge with 80 μm diameter pore at different voltages.
4.Conclusions
In this study,a two-dimensional fluid model is established to examine the discharge behavior in a pore under air dielectric barrier discharge.The pore size notably affects the microdischarge in the pore,and strong ionization and microdischarge occur in the pore with large diameter.When the pore size is less than 20 μm,the ionization in the pore does not increase significantly at 9 kV voltage,but the timeaveraged ionization rate in the pore of 30 μm diameter is the largest.However,the time-averaged plasma density in the pore of 70 μm diameter is the largest.The applied voltage also remarkably affects the microdischarge in the pore.When the voltage is greater than 2 kV,the plasma density and ionization rate in the pore of 80 μm diameter begin to change significantly,but the plasma density in the bulk region changes little with the voltage.This study is helpful to understand the air microdischarge mechanism in porous catalysts,and helps in the design of porous catalysts for plasma catalysis processes.
Acknowledgments
This work is supported by National Natural Science Foundation of China (Nos.51977024 and 21577011).
Appendix
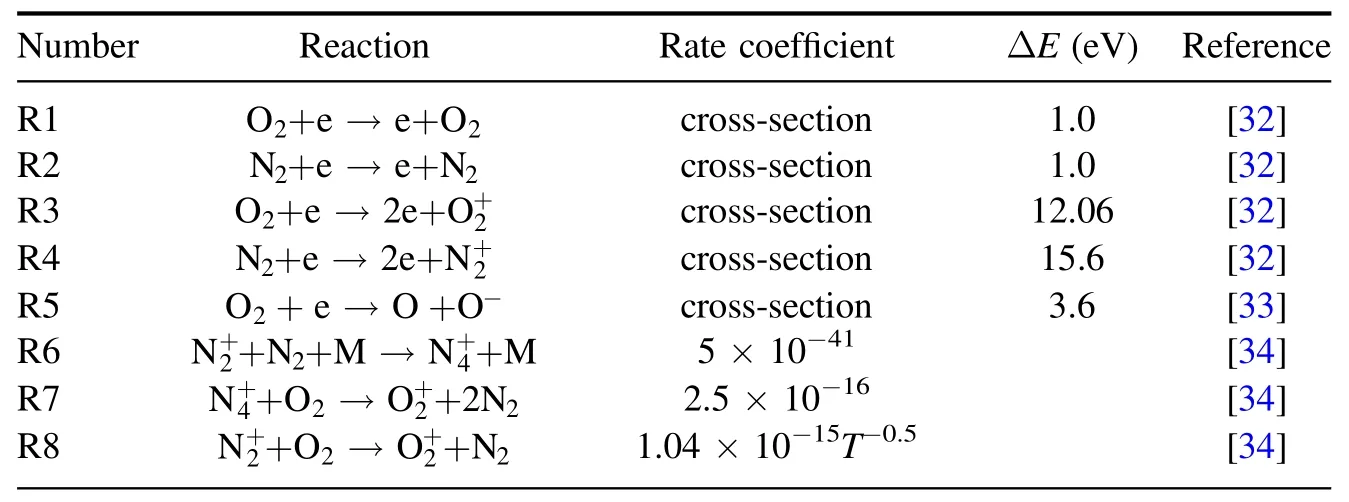
Table A1. The chemical equations included in the calculation model.
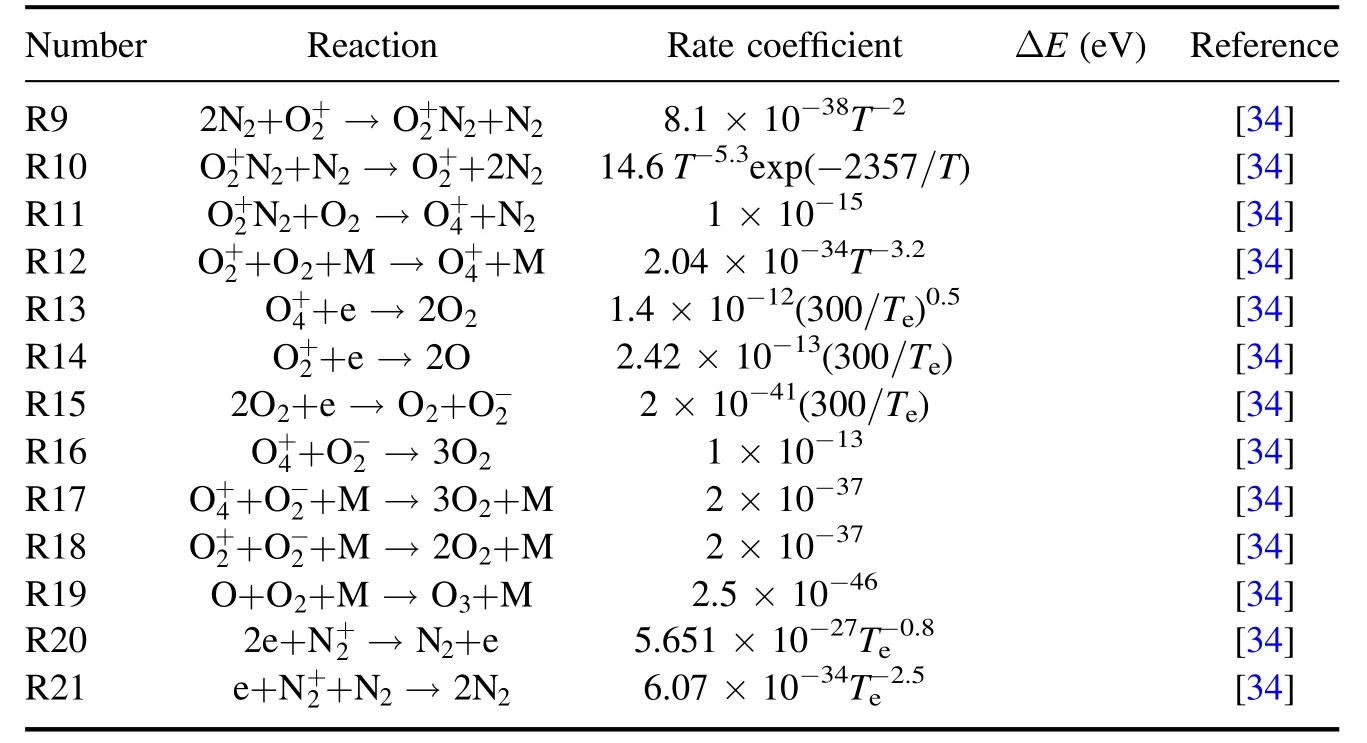
Table A1. (Continued.)
ORCID iDs
猜你喜欢
杂志排行

Plasma Science and Technology的其它文章
- Efficient combination and enhancement of high-power mid-infrared pulses in plasmas
- Realization of Te0>10 keV long pulse operation over 100 s on EAST
- Solving Poisson equation with slowingdown equilibrium distribution for global gyrokinetic simulation
- Experimental studies of cusp stabilization in Keda Mirror with AXisymmetricity (KMAX)
- BITS: an efficient transport solver based on a collocation method with B-spline basis
- Comparing simulated and experimental spectral line splitting in visible spectroscopy diagnostics in the HL-2A tokamak