Optimization of X-mode electron cyclotron current drive in high-electron-temperature plasma in the EAST tokamak
2023-03-06HanlinWANG王瀚林XiaolanZOU邹晓岚XiaojieWANG王晓洁YvesPEYSSONMiaohuiLI李妙辉ChenbinWU吴陈斌ChaoZHANG张超FukunLIU刘甫坤andJoanDECKER
Hanlin WANG(王瀚林),Xiaolan ZOU(邹晓岚),Xiaojie WANG(王晓洁),Yves PEYSSON,Miaohui LI (李妙辉),Chenbin WU (吴陈斌),Chao ZHANG (张超),Fukun LIU (刘甫坤) and Joan DECKER
1 Institute of Plasma Physics,Chinese Academy of Sciences,Hefei 230031,People’s Republic of China
2 University of Science and Technology of China,Hefei 230026,People’s Republic of China
3 CEA,Institute for Magnetic Fusion Research,Saint-Paul-Lez-Durance F-13108,France
4 EPFL,Swiss Plasma Center,Lausanne 1018,Switzerland
Abstract A discharge with electron temperature up to 14 keV has been achieved in EAST.Analysis of the electron cyclotron current drive (ECCD) efficiency at high electron temperature under EAST parameters is presented using C3PO/LUKE code.Simulation results show that the ECCD efficiency of X-mode increases with central electron temperature up to 10 keV and then starts to decrease above 10 keV,at a specific magnetic field and toroidal angle.The efficiency degradation is due to the presence of the third harmonic extraordinary (X3) downshifted absorption at the low field side(LFS);even the cold resonance of X3 mode is located outside the plasma.As the electron temperature increases from 5 to 20 keV,the X3 absorption increases from 0.9%to 96.4%.The trapping electron effect at the LFS produces a reverse Ohkawa current.The competition between the Fisch-Boozer current drive and the Ohkawa current drive results in a decrease in ECCD efficiency.ECCD efficiency optimization is achieved through two methods.One is to increase the toroidal angle,leading to X2 mode predominating again over X3 mode and the electron resonance domain of X2 mode moving far from the trapped/passing boundary.The second one is to increase the magnetic field to move away the X3 resonance layer from the plasma,hence less EC power absorbed by X3 mode.
Keywords: current drive,ECCD efficiency,EAST tokamak
1.Introduction
Electron cyclotron resonance heating (ECRH) [1-4]and electron cyclotron current drive (ECCD) [5-8]are the two effects produced by the interaction between electromagnetic waves in the electron cyclotron(EC)frequency or its low harmonics with plasma.EC systems possess a number of attractive technological features.First,since an electron cyclotron wave (ECW)propagates in a vacuum,the EC launcher can be placed distant from the plasma.Second,the power deposition can be flexibly controlled by the toroidal magnetic field,wave frequency and antenna steering angle.Third,the physics mechanism by which ECW interacts with plasma is simple,and the coupling is insensitive to the conditions at the plasma boundary.Fourth,unlike lower hybrid current drive (LHCD) and ion cyclotron resonance heating(ICRH),ECRH does not generate additional impurity.Last,the EC launchers need smaller openings in the vacuum vessel compared to other heating methods.
ECRH/ECCD is a well-established and widely used scheme for plasma localized heating and non-inductive current drive in tokamak fusion reactors[9-12].For example,electron heat transport has been studied [13]and the heat pinch has been calculated [14,15]by ECRH modulation in Tore Supra,electron temperature profile stiffness has been investigated in the Axially Symmetric Divertor Experiment(ASDEX) Upgrade [16],and impurity transport with ECRH has been investigated in HL-2A [17].Moreover,ECRH/ECCD has been used in pre-ionization/assisted start-up [18],momentum transport/plasma rotation[19]and synergy of EC and LHCD [20].Furthermore,EC power can be deposited over a wide range between the plasma center and off-axis,and ECCD can therefore be used to control the magnetohydrodynamic (MHD) instabilities [21-23],such as sawteeth control [24-26]and suppression of neoclassical tearing modes(NTMs) [27-29].
Megawatt EC systems have been implemented or planned on many fusion experiments and reactors in the last few decades,such as the International Thermonuclear Experimental Reactor (ITER) [30],ASDEX Upgrade [31],JAERI Tokamak-60 Upgrade(JT-60U)[32],Experimental Advanced Superconducting Tokamak (EAST) [33],and China Fusion Engineering Test Reactor (CFETR) [34].With increasing heating power,the electron temperature of plasma also increases.EAST achieved a discharge of electron temperature of 10 keV in the experimental campaign of 2018 [35],and achieved 14 keV in the last experimental campaign.However,ECCD is constrained by harmonic overlap at highTe[36].For example,the ECCD efficiency of ITER mid-plane injection is saturated at 30 keV due to the high harmonic parasitic absorption[21],the downshifted third harmonic absorption at the low field side (LFS) reduces the available power of the second harmonic as well as the driven current in JET,especially at low magnetic field and high temperature[37];hence,the saturation of the CD efficiency at high temperature due to increasing parasitic absorption becomes a key factor to be considered in the design of the DEMO EC system [38].Therefore,it is necessary to study the ECCD configuration optimization in high-electron-temperature plasma in the EAST tokamak.
Simulation and study of ECCD efficiency at high electron temperature are presented in this paper,providing theoretical guidance for EAST tokamak experiments in the future.The paper is organized as follows.Section 2 describes the main parameters of the plasma and EC system in EAST.The basic theory of ECCD and the C3PO/LUKE codes are briefly introduced in section 3.The simulation results and discussion of ECCD efficiency at high electron temperature are presented in section 4.The optimization of ECCD performance by changing the launch angle is addressed in section 5.Finally,a conclusion is given in section 6.
2.Main parameters of ECRH system in EAST
High central electron temperature and high-confinement,long-pulse,steady-state discharge are the main goals of the EAST operation [39].In the experimental campaign of 2018 on EAST,more than 10 MW heating power was injected into plasma; the auxiliary heating power consisted of 1 MW ECRH power,2.2 MW ICRH power,5 MW lower hybrid(LH) heating power and 4.5 MW neutral beam injection(NBI) power.Under the heating of auxiliary power,the central electron temperature of the plasma reached 10 keV[35],as shown in figure 1.EC powers of 5 s pulse width were injected into the plasma center by two gyrotrons starting from 2.5 s and 3 s respectively.
EAST is a non-circular cross section and full superconducting tokamak.The following parameters of EAST are used for simulations in this study:major radiusR0= 1.85 m,minor radiusa= 0.45 m,plasma currentIp= 500 kA,aspect ratioR/a= 4.1,triangularity δ = 0.6-0.8 and elongation κ = 1.6-2 [33].In recent experimental campaigns,B0has mostly operated between 2.0 T and 2.5 T;two values of 2.2 T and 2.5 T are analyzed in this paper,whereB0is the vacuum toroidal magnetic field in the center atR0.
The EC system is one of the most important plasma heating and current driver schemes in EAST,which consists of a radiofrequency source,transmission line and EC launcher as shown in figure 2.The microwave source consists of four gyrotrons each with 1 MW output power and pulse length of 1000 s.The operational frequency of the gyrotrons is 140 GHz.An ECW of 4 MW power is injected into the plasma from the LFS through the horizontal port EC launcher by using the second harmonic extraordinary (X2) mode.The EC launcher mainly consists of four pairs of focusing and steering mirrors.The location of EC power deposition can be changed by adjusting the poloidal or toroidal angles of the steering mirror to achieve the desired physical objectives at different magnetic surfaces.As shown in figure 3,the poloidal angle θ is the angle between the vertical positive direction and EC rays,and the toroidal angle φ is the angle between the major radius positive direction and EC rays[40,41].It should be noted that φ = 180° corresponds to the case where EC wave injection is perpendicular to the magnetic field,and in this case,there is no ECCD.For typicalB0= 2.5 T,ECW power is deposited on the magnetic axis when poloidal angle θ = 75° and toroidal angle φ = 180°.
The relationship of wave frequency and toroidal magnetic field satisfies
wherefce(GHz) is the ECW frequency,nis the electron harmonic number,andBt(T)is the magnetic field.According to equation (1),Bt= 2.5 T whenfce= 140 GHz forn= 2.
All simulations are based on the plasma equilibrium and kinetic profiles of the EAST baseline scenario.For simplifying the simulations,the effective charge number is set toZeff= 2.The profiles of the electron density and electron temperature are written as follows:
which are plotted in figure 4.The central electron densityne0= 5 × 10¹⁹m-3,edge densitynea= 1 × 10¹⁹m-3.The central electron temperatureTe0is varied from 1 to 40 keV and the edge electron temperatureTeais fixed at 0.1 keV.The coefficients α1= α2= 3,β1= β2= 1.
3.ECCD theory and LUKE code
ECW can be absorbed by electrons with cyclotron frequency or its low harmonics,which satisfy the resonance condition for wave-particle interaction:
where ω is the frequency of ECW,nis the harmonic number,ωceis the EC frequency,γ= (1 -v2/c2)-1/2is the relativistic factor,andcis the velocity of light in a vacuum.The first term of the right-hand side of equation(4)considers the relativistic correction of the electron mass[7].The second term corresponds to the Doppler shift effect,where‖vis the parallel component of the velocity of the resonant electrons,andk‖=ωn‖/cis the parallel component of wave vector of the ECW.The parallel refractive index‖nis positive in the direction of the magnetic field.The ECW interacts with electrons satisfying the EC resonance condition,and the electrons are accelerated to higher energy resulting in less collision frequency in velocity space.This leads to an asymmetrical distribution of electrons in the velocity space,and forms a net current.
ECCD efficiency can be written in the form
whereIECis the total driven current,neis the electron density,R0is the major radius of the plasma,andPECis the injected EC power.Definition (5) is more suitable for measuring the effect of temperature variation onIEC[38].
The code used in this study is C3PO/LUKE.C3PO is a ray-tracing code which considers the weak damping approximation [42-44].LUKE is a code for solving the threedimensional (3D) relativistic bounce-averaged electron drift kinetic equation [45].
The calculation processes of C3PO/LUKE are as follows.The wave propagation in the plasma is calculated by solving the ray equation using C3PO code,and the variation of EC power with trajectory is given simultaneously.Based on the wave parameters determined along each ray,the quasilinear diffusion coefficient in momentum space is evaluated self-consistently with the electron distribution function in the LUKE code,by solving simultaneously the 3D linearized relativistic bounce-averaged Fokker-Planck equation and the wave power equation until all the power carried by each ray is transferred to the particles.Then,the electron distribution functionf(r,p,ξ,t) is obtained.Finally,the power density and driven current density are calculated.
4.ECCD efficiency of X-mode
To evaluate the ECCD efficiency in high-electron-temperature tokamak plasmas,simulations of ECCD efficiency versus different electron temperatures are carried out as shown in figure 5.Here,the central densityne0= 5 ×10¹⁹m-3,poloidal angle θ = 75°,toroidal angle φ = 200°,B0= 2.2 T,PEC= 1 MW and wave frequencyf= 140 GHz for X-mode.Theoretically,the ECCD efficiency is proportional to electron temperature [46].However,the ECCD efficiency presented in figure 5 is reduced afterTe0> 10 keV,even if the power absorption coefficient is almost constant.
To understand why the driven current decreases,the current and power density profiles with differentTe0for X-mode ECW are presented in figures 6(a) and (b),respectively.WithTe0increasing from 5 to 40 keV,both the radial positions of current and the power density peak shift towards the LFS,and the current decreases rapidly.In addition,asTe0increases from 5 to 25 keV,the width of the power density profile increases.It can be concluded that with increasing electron temperature,the position of power deposition shifts from the plasma center to the LFS,while the driven current keeps decreasing.Here,ρ is the normalized poloidal fulx.
To analyze the reason of the power deposition shift toward LFS,the power absorbed at each minor radius is separated into two fgiures with different harmonics presented in figure 7.WithTe0increase from 5 to 20 keV,the X2 component decreases gradually,while the third harmonic extraordinary(X3)component appears at the LFS and becomes to dominate.It means that the resonance condition is progressively moving from X2 mode to X3.In addition,the radial positions of power density peak shift towards the LFS both in X2 and X3 mode,which is caused by the upshift effect (ω>nωce) [3,4].
Figure 8 presents the transition from second harmonic absorption to third harmonic absorption with increasingTe0.The blue and red solid lines correspond to the power absorbed by the X2 and X3 components respectively,and the yellow dashed line corresponds to the total absorbed power,while the injected EC power is 1 MW.WhenTe0is less than 5 keV,almost all the EC power is absorbed by the X2 component.WhenTe0is progressively increased above 5 keV,the EC power becomes absorbed by the X3 component at the LFS,while the rest is completely absorbed by the X2 component.AsTe0increases,the X3 absorption begins to dominate.WhenTe0> 25 keV,the EC power is almost completely absorbed by the X3 component.During the whole process,the EC power is completely absorbed.

Figure 1.10 keV electron temperature discharge in the experimental campaign of 2018 on EAST (shot No.78841).(a) Plasma current(blue) and line-integrated electron density (red),(b) storage energy of plasma(blue)and central electron temperature(red),(c)auxiliary heating power of low hybrid wave (blue) and ECW (red).
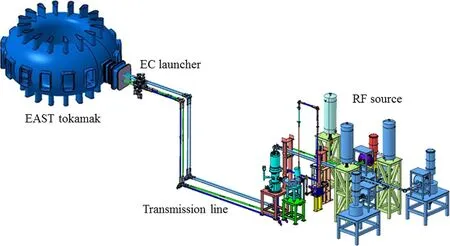
Figure 2. Layout of the EC system in EAST.
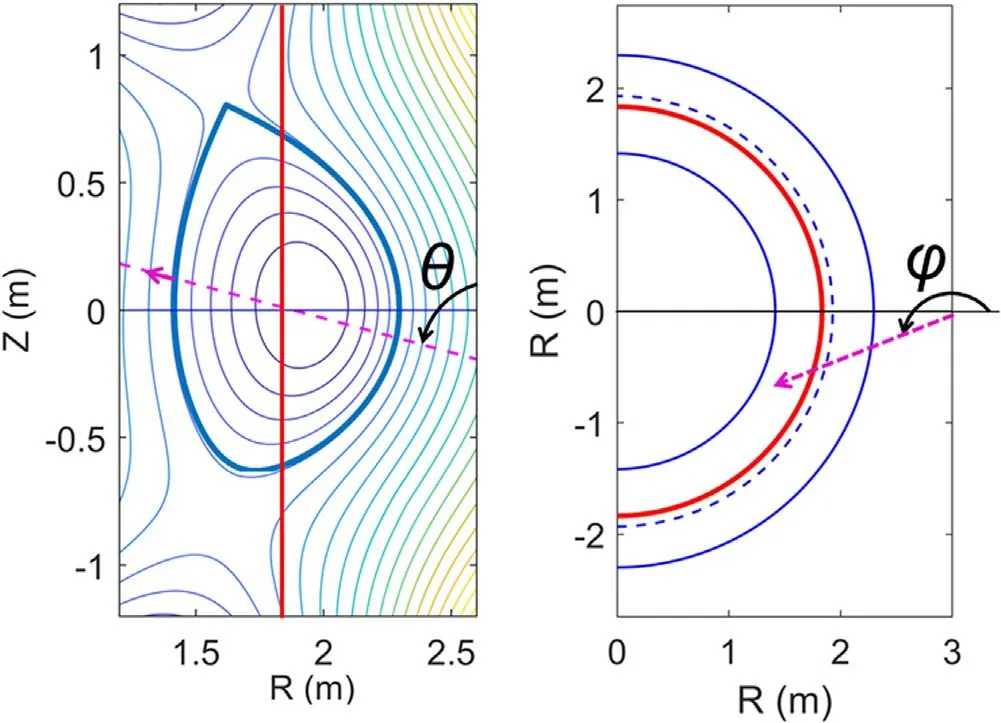
Figure 3. Definitions of poloidal angle (left) and toroidal angle(right)of ECW.The red solid lines correspond to the cold resonance layer(CRL),the pink dashed lines to the ECW incident path and the blue dashed line to the magnetic axis.The contour lines on the left are the plasma equilibrium shape,and the blue solid lines on the right are the last closed flux surface.
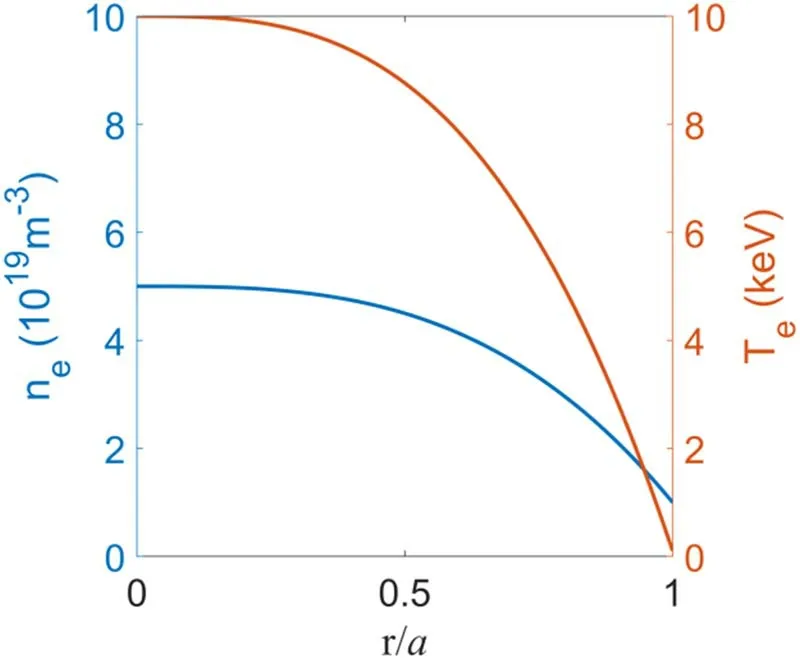
Figure 4.Electron density (blue) and electron temperature (red)profiles.
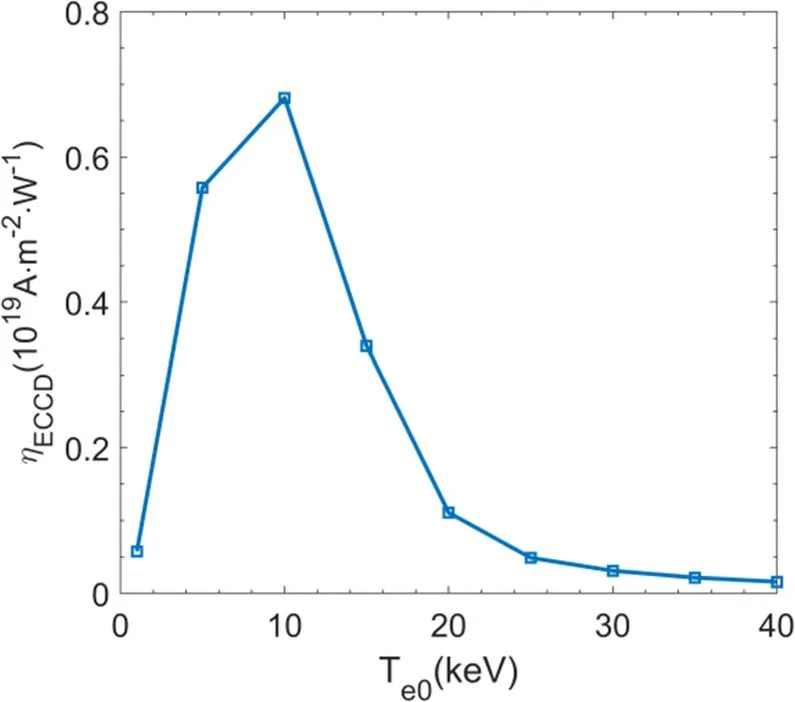
Figure 5. Te0 versus ECCD efficiency.Here,θ = 75°,φ = 200°,ne0 = 5 × 10¹⁹ m-3, B0 = 2.2 T,and PEC = 1 MW with X-mode.
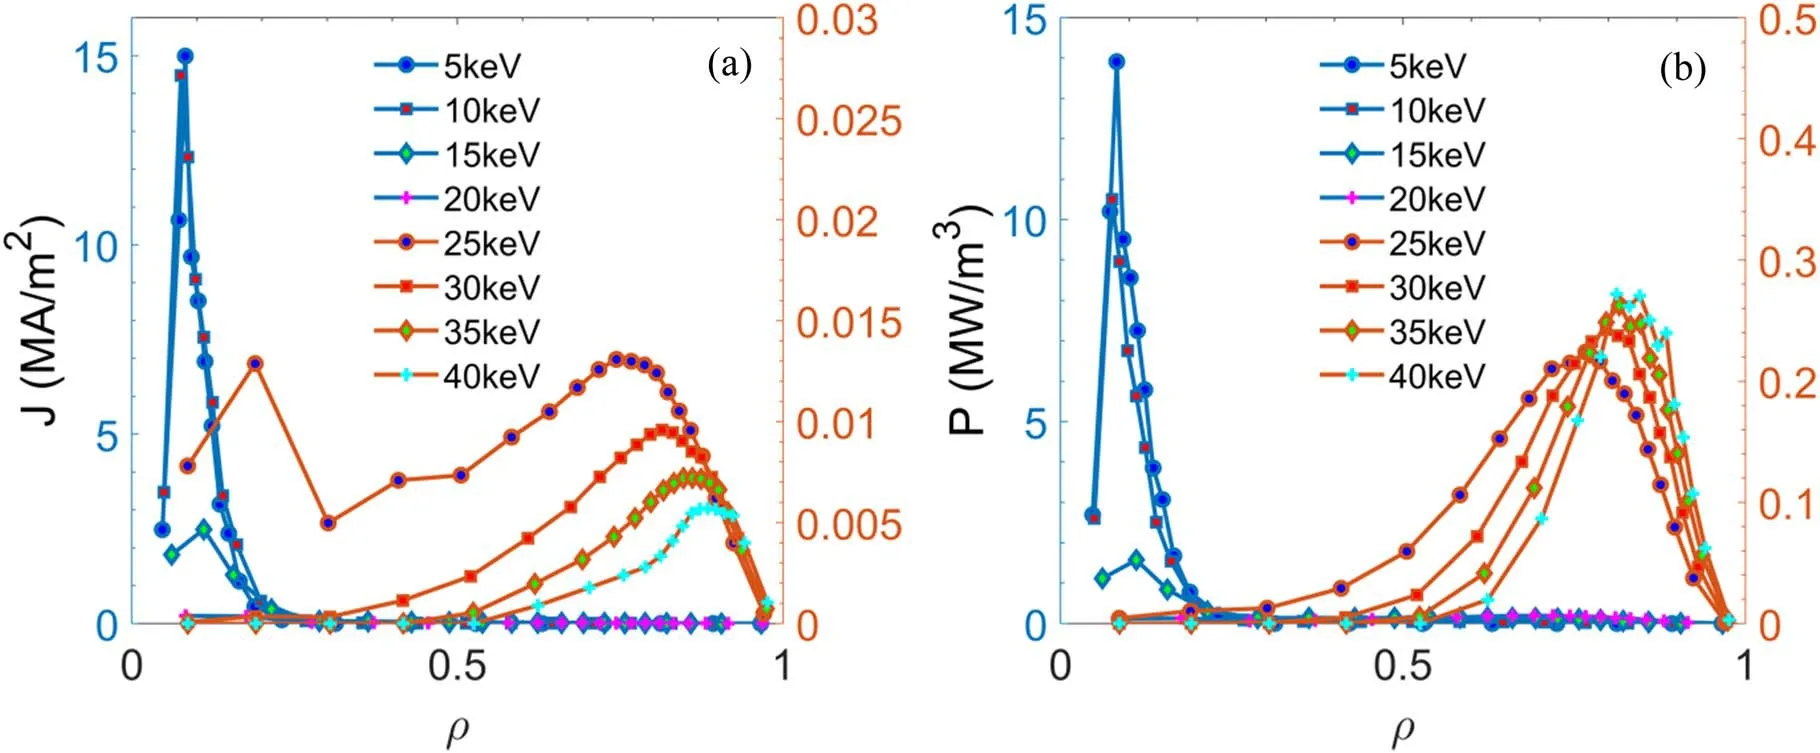
Figure 6. (a) Current and (b) power density profiles with different Te0.
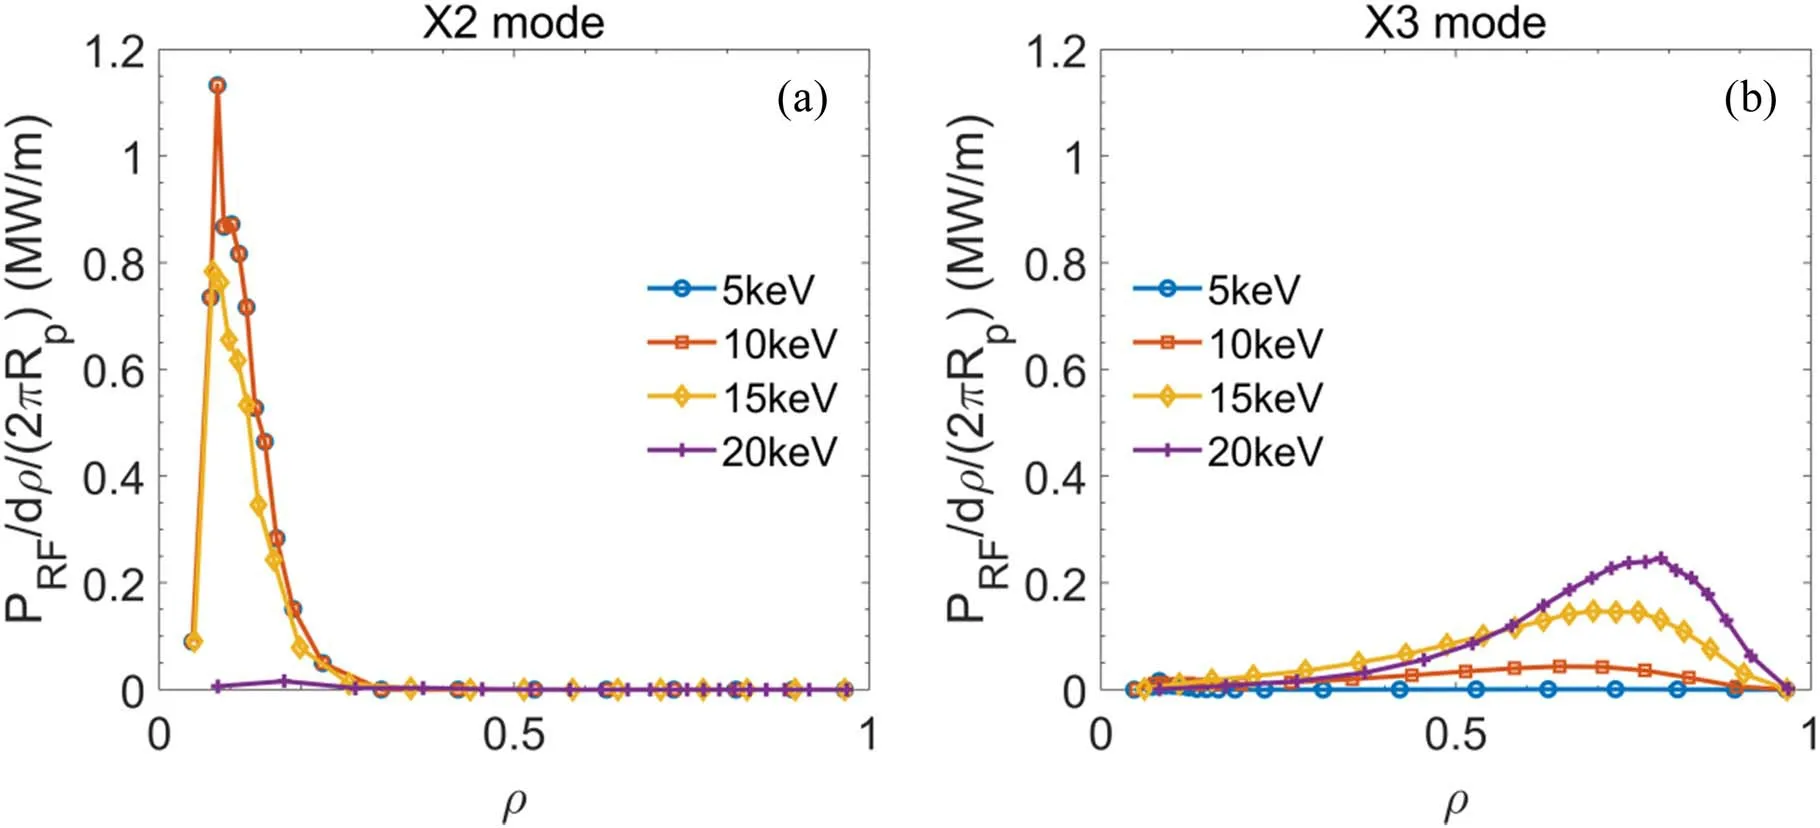
Figure 7.(a) X2 and (b) X3 components of the power absorbed at each minor radius with different Te0.
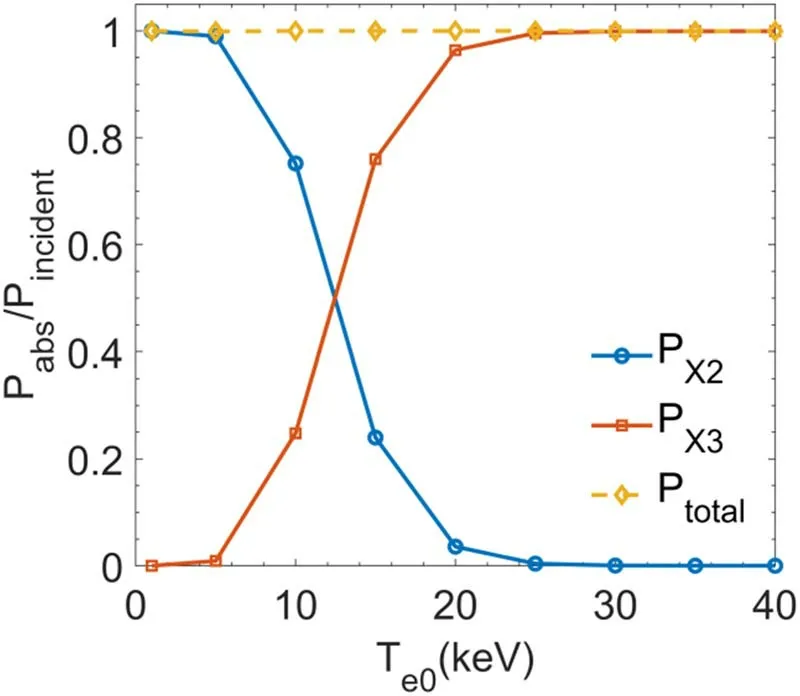
Figure 8.Te0 versus normalized power absorption index of X2(blue circle),X3 (red square) components and total power (yellow diamond).
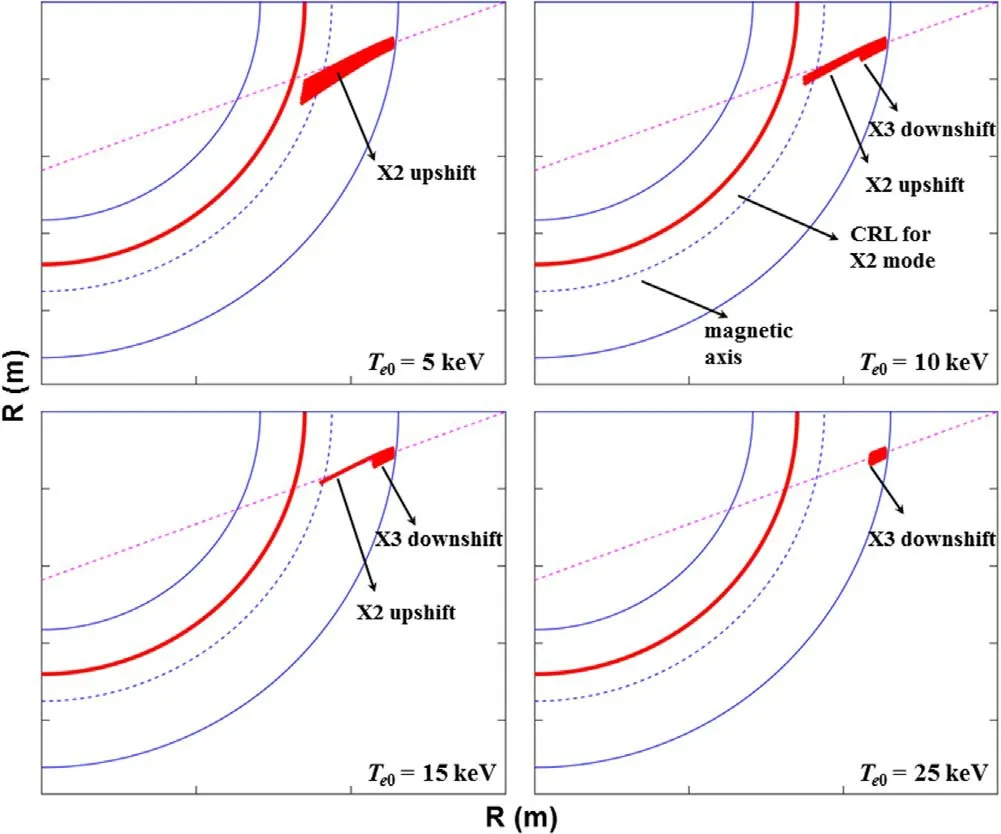
Figure 9.Ray trajectories in toroidal view with Te0 increased from 5 to 25 keV.The red solid lines correspond to the CRL of X2 mode,the pink dashed lines to the ECW incident path,the blue dashed lines to the magnetic axis and the blue solid lines to the last closed flux surface.
Figure 9 shows the toroidal view of ray trajectory withTe0of 5-25 keV.It can be observed that whenTe0rises to 10 keV,X3 absorption occurs at the LFS,corresponding to the X3 component in figure 7(b),which is the result of the downshift effect (ω<3ωce) [3,4,21].WhenTe0is further increased to 25 keV,the EC power is completely absorbed by the X3 component.
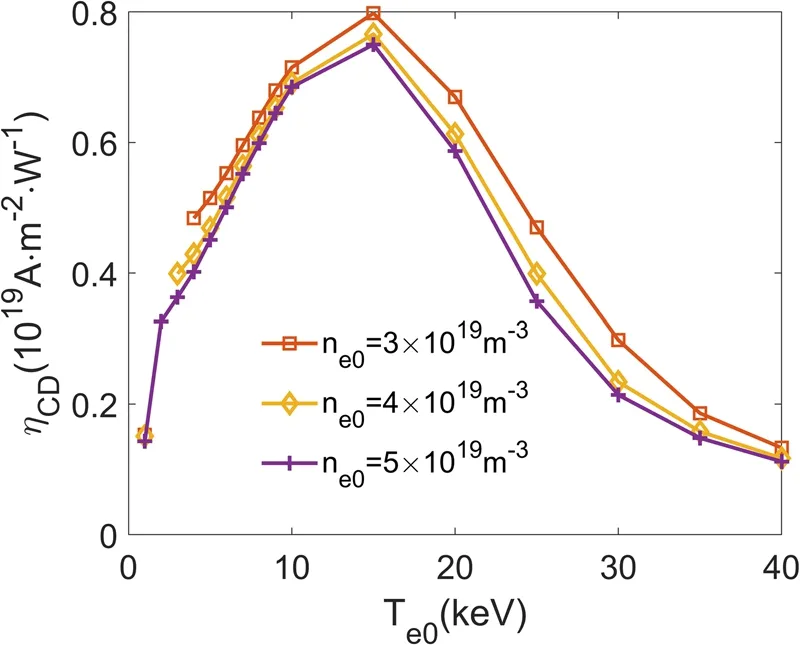
Figure A1.Te0 versus ECCD efficiency for three different electron densities at B0 = 2.5 T and φ = 200°.
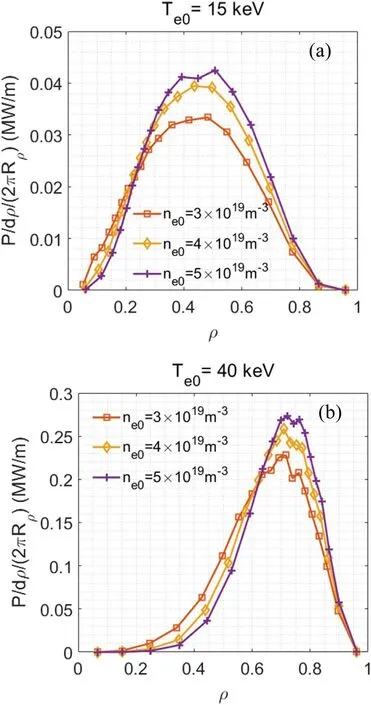
Figure A2. X3 component of the power absorbed at each minor radius for three different electron densities when Te0 = 15 keV and 40 keV respectively.

Figure 10.Ray trajectories in poloidal (left) and toroidal (right)views at Te0 = 15 keV.The red and green solid lines correspond to the CRL of X2 and X3 modes respectively.
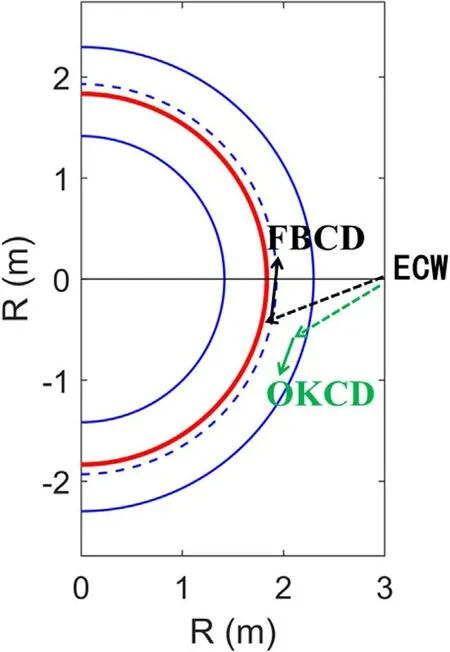
Figure 11.Schematic of the direction of current driven by FBCD and OKCD mechanisms.The dashed lines are the ECW incident path and the solid lines are the direction of the driven current.

Figure 12.Electron distribution in momentum space at the radius corresponding to the maximum of the power absorption when (a)Te0 = 1 keV,(b) Te0 = 10 keV,(c) Te0 = 15 keV and (d) Te0 = 25 keV.
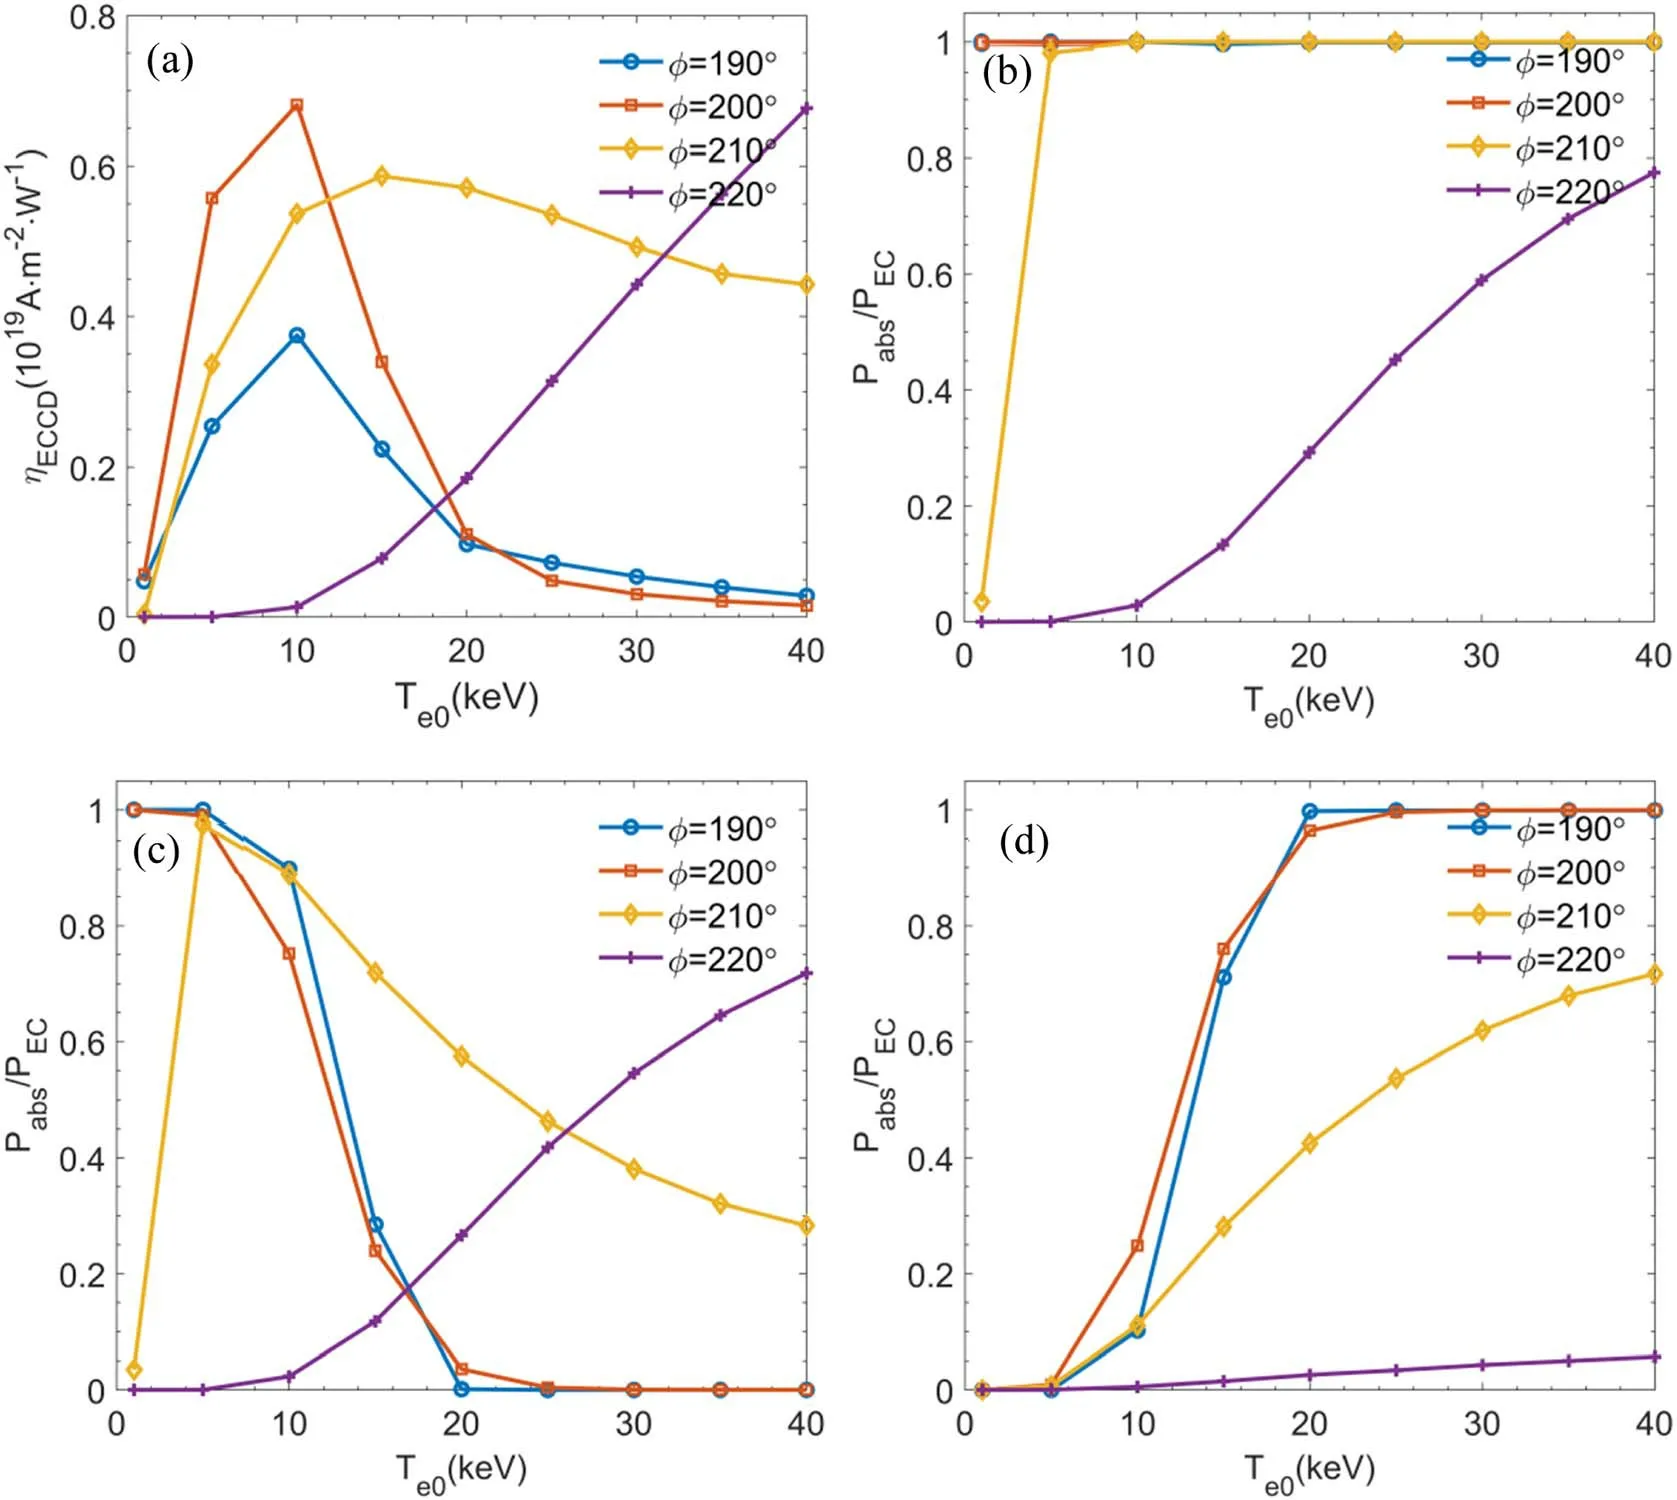
Figure 13.Te0 versus(a)the ECCD efficiency;and the power absorption coefficient for(b)total EC power,(c)X2 and(d)X3 components at different toroidal angles φ.Here,θ = 75°, ne0 = 5 × 10¹⁹ m-3, B0 = 2.2 T, PEC = 1 MW.
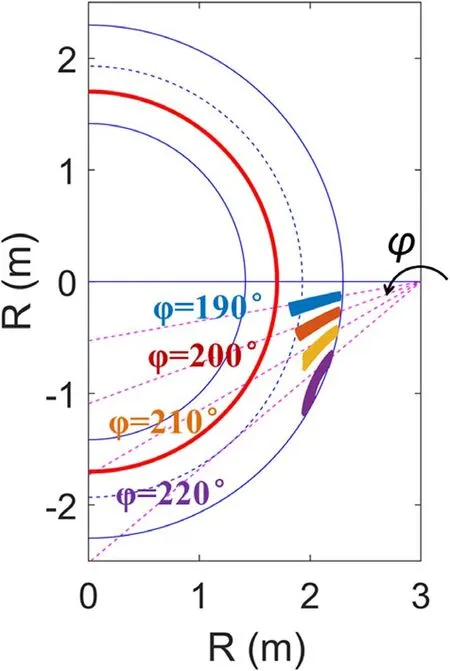
Figure 14.Ray trajectory with different toroidal angles atTe0 = 6 keV.

Figure 15.2D electron distribution function at φ = 210° and Te0 = 15 keV.
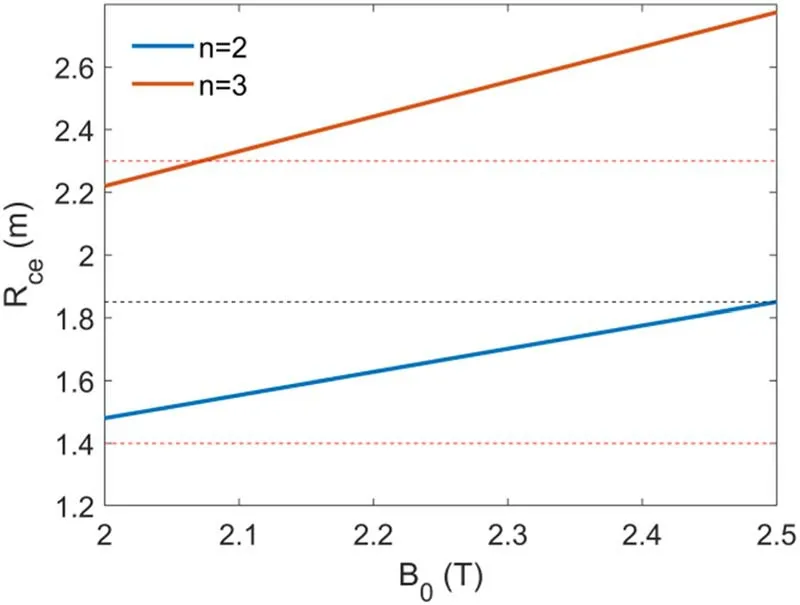
Figure 16.Major radius of EC cold resonance location as a function of the vacuum toroidal magnetic field in the center for EC frequency f = 140 GHz.The blue and red lines refer to the second and third harmonics,respectively.The horizontal black dotted line denotes the major radius of vessel center R0 = 1.85 m.The upper and lower red dotted lines delimit the last closed flux surface of the LFS and HFS,respectively.
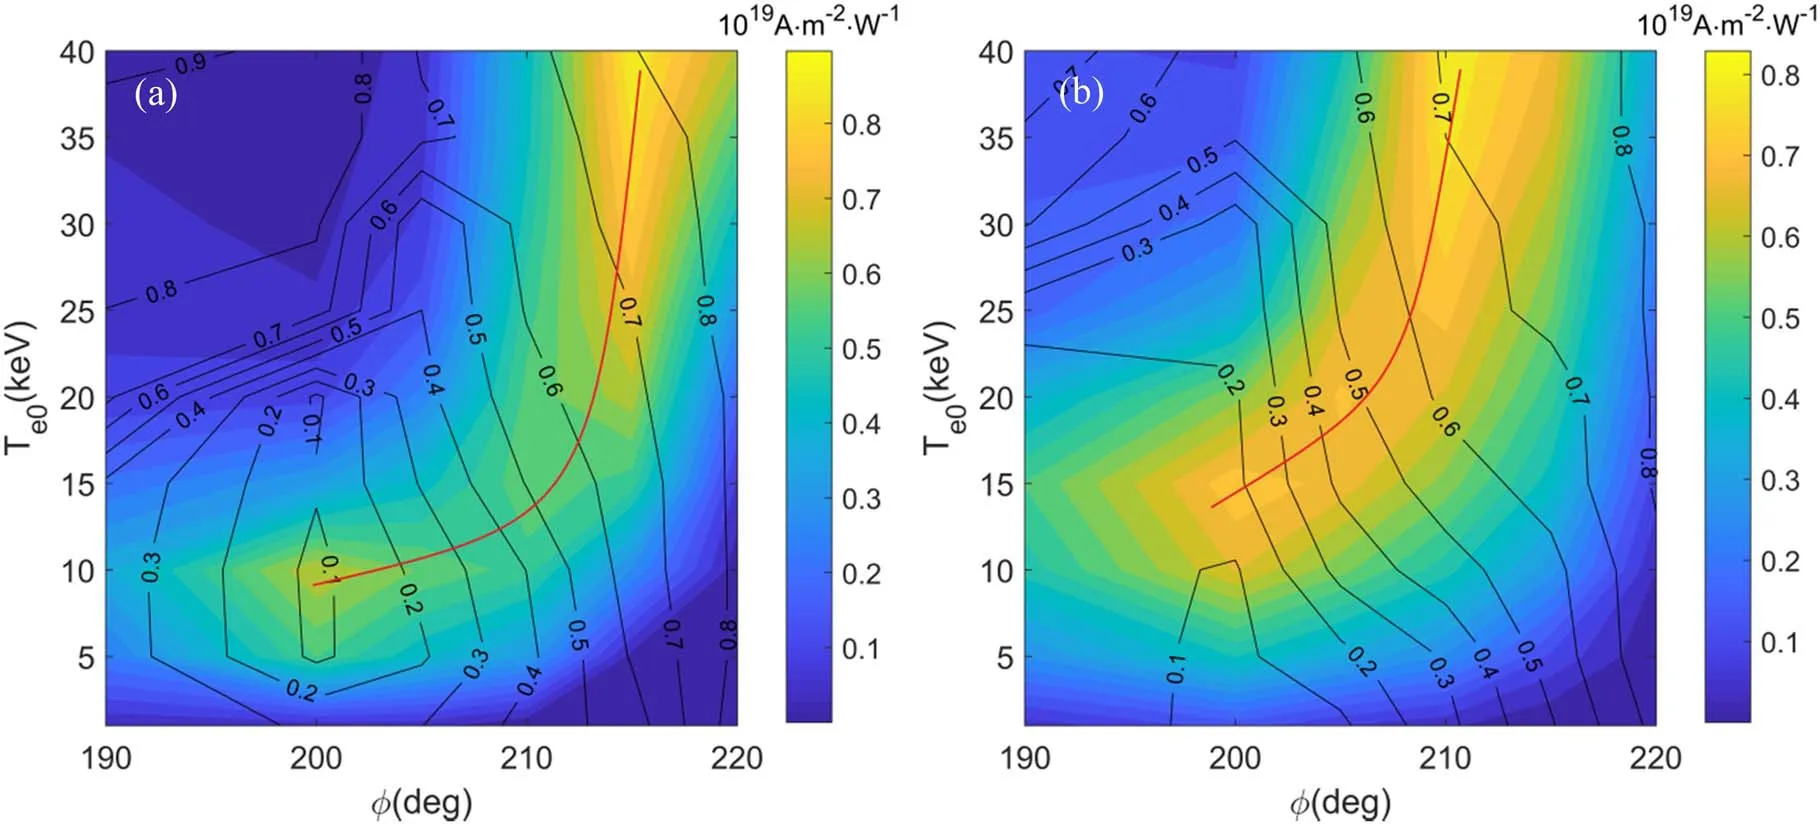
Figure 17.ECCD efficiency (color scale) and radial location of driven current peak (black contour lines)as a function of the toroidal angle and central electron temperature.Figures(a)and(b)refer to B0 = 2.2 T and B0 = 2.5 T,respectively.The red solid lines denote the optimal ECCD efficiency at each normalized radius.
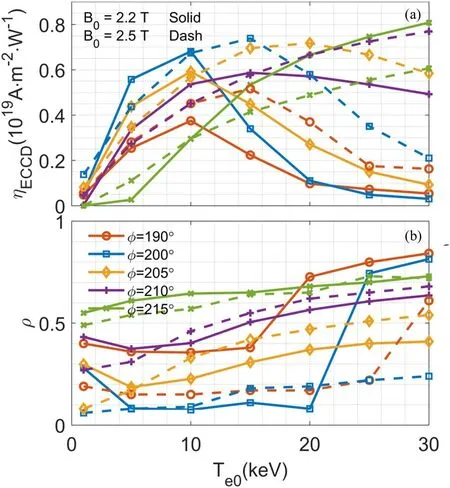
Figure 18.Te0 versus(a)ECCD efficiency and(b)normalized radius of current peak at the B0 = 2.2 T(solid line)and B0 = 2.5 T(dashed line) from five toroidal angles.
The ray trajectories in poloidal and toroidal views atTe0= 15 keV are presented in figure 10.The cold resonance layer (CRL) of X3 mode is located atR= 2.44 m as shown by the green solid line,which is theoretically outside the plasma.However,the local resonance condition with a tail of fast electrons is more important for resonant electrons.The factors affecting the local resonance condition include not only the direct thermal effect but also the relativistic mass effect.When the electron temperature is increased high enough,the actual X3 resonance is located at the LFS due to the downshift effect,which is illustrated by the ray trajectory in the poloidal view.Correspondingly,the actual X2 resonance is shifted due to the upshift effect,as shown by the ray trajectory near the plasma center.
ECCD contains currents generated by two different physical mechanisms,namely the Fisch-Boozer current drive(FBCD) [6]and the Ohkawa current drive (OKCD) [47],which are in opposite directions [48].
The directions of toroidal magnetic fieldB0and plasma currentIpon EAST are usually set to anti-clockwise.In the steady state without ECW,electrons parallel to the magnetic field are symmetrically distributed in the positive and negative directions.Once the ECW is injected clockwise as shown by the dashed black and green lines in figure 11(‖nis positive in the direction ofB0,hence here the‖n0< ),the electrons with same direction are accelerated to higher energy and reduce the collision rate.Then the total velocity of electrons increases,hence an anti-clockwise current(co-ECCD)is driven,found by Fisch and Boozer,as illustrated by the black solid line in figure 11.On the other hand,due to the velocity drift caused by the ECW deposited on the LFS,a part of the electrons with clockwise direction are trapped from the passing region into the trapped region.However,the trapped electrons do not generate a toroidal current,thus the symmetrical distribution of electrons is lost,forming a clockwise current (counter-ECCD),namely the Ohkawa current,as shown by the green solid line.
Actually,these two currents can be described by a simple formula in a continuous way [49].Based on the above physical mechanism,the decrease in driven current with increasing electron temperature can be analyzed through the electron distributions in momentum space,as illustrated in figure 12.It can be observed that:
(1) WhenTe0= 1 keV,the power is totally absorbed by the X2 component,and the resonance domain is far away from the trapped/passing boundary(TPB),so there is no Ohkawa current.Hence,,there is only current driven by the X2 mode FBCD mechanism.
(2) WhenTe0= 10 keV,about 25% of EC power is absorbed by the X3 component,and the current driven by X3 mode is relatively weak.The remaining 75% of EC power is absorbed by X2 mode near the plasma center,hence the current driven by the FBCD mechanism of X2 mode (IOKX2) is dominant.
(3) AroundTe0= 15 keV,the resonance condition of X2 mode is near the plasma center,OKCD of X2 mode(IOKX2) is still negligible,so the FBCD dominates in X2 mode.About 75%power is absorbed by X3 mode,and the resonance domain is close to the TPB.The passing electrons just below the TPB enter the trapped region after being accelerated by ECW,forming OKCD.Simultaneously,another part of the electrons form FBCD.These two currents in opposite directions counteract with each other.The total currentIEC=IFBX2+IFBX3+IOKX3,and theIOKX3< 0,hence theIECis reduced.
(4) WhenTe0> 25 keV,the EC power is almost completely absorbed by the X3 component;the current driven by X2 absorption is negligible.The deposition of X3 mode is at the LFS,and the resonance domain is close to the TPB,so the OKCD of X3 mode is significantly increased.The total current therefore drops dramatically.

Table 1.Sign of each current component at different electron temperatures.
The signs of all parts of the currents are listed in table 1.As mentioned above,with increasing electron temperature,the current decreases because the resonance domain of the ECW falls in the trapped region [50],which is caused by an X3 downshift effect.In addition,the effect of electron density on the third harmonic absorption is less than that of electron temperature,which is briefly described in the appendix.
5.Optimization of the ECCD efficiency
5.1.Alteration of toroidal angle φ
A large number of tokamaks attempt to achieve higher ECCD efficiency to stabilize MHD modes or generate a high noninductive toroidal current.To improve the driven current,the ECCD efficiency and power absorption coefficient at different toroidal angles φ are studied as a function of electron temperature as shown in figure 13,and the corresponding toroidal angles are illustrated with the ray trajectory in toroidal view in figure 14.As mentioned above,there is no EC driven current when φ = 180°.
Since the injection angle is almost perpendicular,the ECCD efficiency at φ = 190°is lower than that at φ = 200°.The X2 absorption dominates whenTe0≤ 10 keV and the resonance condition is almost central,so there is almost no OKCD effect.The X3 downshifted absorption becomes dominant afterTe0> 10 keV,which results in a resonance condition shift towards the LFS; hence,the OKCD becomes significant.The total currentIEC=IFBX2+IFBX3-∣IOKX3∣.
For φ = 210°,asTe0increases from 15 to 40 keV,the X3 absorption becomes dominant.The ECCD efficiency decreases after 15 keV,which is the result of competition between the OKCD and FBCD.
When φ = 220°,it can be observed from figure 13(a)that the ECCD efficiency keeps rising with increasingTe0,and the X3 component is negligible.The result of φ = 220°is different to those of the other three angles,and the main reason is that the ECW is experiencing the low-temperature part of the plasma,as shown by the purple ray trajectory in figure 14.X3 mode is very sensitive to the local electron temperature,andTeis locally lower as φ increases.By increasing the toroidal angle to 220°,X2 mode therefore dominates again over X3 mode as shown in figures 13(c)and(d).On the other hand,the Ohkawa effect of X2 mode seems less efficient even with the deposition at the LFS.
To identify the role played by OKCD at highTe0and large toroidal angle,the electron distribution in momentum space is analyzed.The 2D electron distribution at φ = 210°andTe0= 15 keV is illustrated in figure 15.Compared with that for φ = 200° andTe0= 15 keV as seen in figure 12(c),the TPB is more open so OKCD should in principle be more effective.However,the resonance domain of φ = 210° is moving towards a higher parallel velocity‖vin neither X2 nor X3 mode,which is increasingly far from the TPB.This indicates that the FBCD effect is more dominant over the OKCD,so more EC power is coupled to the passing particles and restores better efficiency.
5.2.Alteration of toroidal magnetic field B0
The EC cold resonance is located atRce= 28nR0(m)B0(T)/f(GHz) =R0B0/Bt.In figure 16,Rceis plotted versusB0for the second and third harmonics withf= 140 GHz.It can be observed that the EC cold resonance of the second harmonic shifts from the high field side (HFS) to the center of the vacuum vessel whenB0increases from 2.2 to 2.5 T,while the EC cold resonance of third harmonic moves further away from the plasma edge.At the same electron temperature,such asTe0= 15 keV,the EC power absorbed by the third harmonic atB0= 2.5 T should be less than that at 2.2 T.This indicates that the ECCD efficiency will be optimized by increasingB0to 2.5 T in high-electron-temperature plasma due to the decreasing X3 absorption.
Shear reversal,NTM stabilization and edge localized mode control are among the goals of EAST EC system.In the practical application of ECCD in EAST experiments,it is necessary to clarify the ECCD performance at a range of radial positions and plasma parameters.Here,the ECCD efficiency and the radial location of the current peak obtained by means of a wide scan of the electron temperature and toroidal angle are presented in figure 17 (a) for 2.2 T and figure 17(b) for 2.5 T.Note that the results presented in figure 17 are scanned by aiming the poloidal angle to the plasma center,so the radius in these figures denotes the minimum that can be reached.The figures provide a clear view to maximize the ECCD efficiency on a specific radial position by choosing the toroidal angle and magnetic field at a given electron temperature.The overall results for both magnetic fields are similar,that is,the variation of ECCD efficiency with toroidal angle and electron temperature is approximately the same as that of the red solid line,although the values are different.This difference is due to the resonance condition ofB0= 2.5 T being more outwards;hence,the electron temperature that triggers the third harmonic downshift effect is higher.For example,the radial position of MHD control (ρ ~ 0.5) can be reached atTe0= 10 keV or 15 keV for bothB0,even with different performances: the ECCD efficiency ofB0= 2.2 T is about 1.2 times that of 2.5 T whenTe0= 10 keV,but the ECCD efficiency ofB0= 2.5 T is about 1.6 times that of 2.2 T whenTe0= 15 keV.
The ECCD efficiency and the peak of the current density profile as a function of the electron temperature for magnetic fields 2.2 T and 2.5 T are shown in figure 18 for toroidal angles from 190° to 215°.From these plots,the following general conclusions can be drawn.The ECCD efficiency forB0= 2.2 T is higher than that of 2.5 T at each toroidal angle except φ = 190°and 215°whenTe0< 10 keV,and the ECCD efficiency forB0=2.2 T is lower than that of 2.5 T at each toroidal angle except φ = 215°whenTe0> 15 keV.For a specific physical object such as the non-inductive toroidal current near ρ = 0.4,ECCD can be optimized by choosingB0= 2.2 T and φ = 210° withTe0=5 keV,orB0= 2.5 T and φ = 205° withTe0= 15 keV.
6.Conclusions
EAST has achieved a discharge of electron temperature of 14 keV.The ECCD efficiency in high-electron-temperature plasmas is simulated.It has been found that the ECCD efficiency is greatly affected by high electron temperature,and the value of ECCD efficiency decreases by about 50% withTe0increasing from 10 to 15 keV whenB0= 2.2 T and φ = 210°.The main reasons for this degradation are as follows: (1) The X3 downshifted absorption at the LFS reduces the EC power available for the second harmonic.(2)The ECCD efficiency is proportional to electron temperature,and the rays of X3 mode experience the low-temperature part of the plasma leading to a lower ECCD efficiency.(3) The X3 absorption at the LFS produces a reverse Ohkawa current due to the electron trapping effect,which is in opposite direction to the Fisch-Boozer current.The competition between these two currents leads to a decrease in the total current as well as the ECCD efficiency.Among them,the first and third reasons are the main factors.
The optimization of ECCD efficiency is achieved by decreasing the X3 absorption through two methods.One is to change the toroidal angle φ at a fixed magnetic field in hightemperature plasma.Because the X3 mode is sensitive to the local electron temperature,by increasing the toroidal angle φ to 215°,the electron temperature is locally lower as φ increases;hence,the X2 mode dominates again over the X3 mode.Meanwhile,the increase in φ results in the electron resonance domain of X2 mode moving far from the TPB,which leads to the FBCD effect being more dominant again over the OKCD.The ECCD efficiency at high electron temperature is therefore optimized.The second one is to increase magnetic fieldB0and change toroidal angle φ appropriately.The increase in magnetic fieldB0causes the X3 resonance region to move far away from the plasma,which means that the appearance of X3 downshift absorption requires a higher temperature.Thus,by increasing the magnetic fieldB0to 2.5 T,the power absorbed by the X3 mode at the same temperature is reduced.
Acknowledgments
One of the authors(Hanlin Wang)would like to acknowledge the helpful suggestions by Dr G.Giruzzi.This work is supported by the National Key R&D Program of China (Nos.2017YFE0300500 and 2017YFE0300503) and the Comprehensive Research Facility for Fusion Technology Program of China (No.2018-000052-73-01-001228).
Appendix
For the case ofB0= 2.5 T and φ = 200°,the ECCD efficiency decreases afterTe0> 15 keV.The ECCD efficiency versusTe0for three different electron densities is shown in figure A1.It is shown that the ECCD efficiencies of three different electron densities have the same variation trend with electron temperature.In addition,the EC power absorbed by X3 mode for three different electron densities is shown in figure A2.It can be observed that the third harmonic absorption is related to electron temperature more than electron density.
猜你喜欢
杂志排行
Plasma Science and Technology的其它文章
- Efficient combination and enhancement of high-power mid-infrared pulses in plasmas
- Realization of Te0>10 keV long pulse operation over 100 s on EAST
- Solving Poisson equation with slowingdown equilibrium distribution for global gyrokinetic simulation
- Experimental studies of cusp stabilization in Keda Mirror with AXisymmetricity (KMAX)
- BITS: an efficient transport solver based on a collocation method with B-spline basis
- Comparing simulated and experimental spectral line splitting in visible spectroscopy diagnostics in the HL-2A tokamak