Influence of magnetic filter field on the radiofrequency negative hydrogen ion source of neutral beam injector for China Fusion Engineering Test Reactor
2021-11-30YingjieWANG王英杰JiaweiHUANG黄佳伟YuruZHANG张钰如FeiGAO高飞andYounianWANG王友年
Yingjie WANG (王英杰), Jiawei HUANG (黄佳伟), Yuru ZHANG (张钰如),Fei GAO (高飞)and Younian WANG (王友年)
Key Laboratory of Materials Modification by Laser, Ion, and Electron Beams (Ministry of Education),School of Physics, Dalian University of Technology, Dalian 116024, People’s Republic of China
Abstract In the design of negative hydrogen ion sources, a magnetic filter field of tens of Gauss at the expansion region is essential to reduce the electron temperature, which usually results in a magnetic field of around 10 Gauss in the driver region,destabilizing the discharge.The magnetic shield technique is proposed in this work to reduce the magnetic field in the driver region and improve the discharge characteristics.In this paper,a three-dimensional fluid model is developed within COMSOL to study the influence of the magnetic shield on the generation and transport of plasmas in the negative hydrogen ion source.It is found that when the magnetic shield material is applied at the interface of the expansion region and the driver region,the electron density can be effectively increased.For instance,the maximum of the electron density is6.7× 1017 m−3 in the case without the magnetic shield,and the value increases to9.4× 1017 m−3 when the magnetic shield is introduced.
Keywords: radio-frequency negative hydrogen ion sources, three-dimensional fluid model,neutral beam injection
1.Introduction
A neutral beam injection (NBI) prototype is designed for the China Fusion Engineering Test Reactor (CFETR) in the Southwestern Institute of Physics.The neutral beam power of the CFETR NBI prototype is expected to be higher than 4 MW, and the hydrogen ion beam is expected to reach 20 A with an energy of up to 400 keV for 3600 s[1,2].Compared to positive ion sources, the neutralization efficiency of the negative ions is strikingly higher, especially when the ion energy is higher than 100 keV [3, 4].Therefore, the radiofrequency (RF) negative hydrogen ion source (NHIS) was chosen for the CFETR NBI prototype.
In the NHIS,there are two main mechanisms of negative hydrogen ion production, i.e.surface production and volume production.When energetic hydrogen atoms and positive ions bombard low-work-function surfaces,negative hydrogen ions are formed in the surfaces, and this is the so-called surface production [5, 6].In the volume production process, lowenergy electrons collide with vibrationally excited hydrogen molecules, and dissociative attachment occurs [7]:

In order to increase the density of negative hydrogen ions,a transverse magnetic field generated by a magnetic filter is applied downstream of the expansion region to create lowenergy electrons.The magnetic field in the expansion region is usually about a few tens of Gauss,and it is about 10 Gauss in the driver region[8].When the magnetic field in front of the electrode was stronger than 24 Gauss,the temperature decreased strikingly to 1 eV, and the plasma homogeneity downstream of the expansion region became much better at the magnetic field of 61 Gauss[9].Although the magnetic field(dozens of Gauss)effectively reduces the electron temperature, especially downstream of the expansion region,the electron density in the driver region also declines, and the plasma distribution becomes asymmetric [8, 10–12].Furthermore, the position of the magnetic filter field in the NHIS has also been proven to affect the plasma characteristics.As the magnetic filter moves towards the driver region,the penetration of the magnetic field into the driver region is enhanced, leading to significant plasma asymmetry[8, 10, 11, 13].
Although the magnetic filter field is helpful for increasing the extraction probability of negative ions[14]and decreasing the electron temperature, the negative ion density is almost unchanged because of the decreased electron density [15].Furthermore,a higher value of plasma density near the plasma grid is helpful for the surface production[15–17].Hence,it is of significant importance to control the magnetic field topology to increase the plasma density.
In this work, the distribution of the magnetic field topology is optimized by replacing the driver–expansion region interface of the reactor by magnetic shield materials with high relative permeability.In order to exactly take the magnetic field topology and the reactor geometry into account,a three-dimensional(3D)fluid model is employed to simulate the NHIS prototype for the CFETR NBI system.The work is organized as follows.Section 2 introduces the 3D fluid model.In section 3, we investigate the influence of the magnetic field topology on the plasma parameters, with the optimal solution proposed.Finally, a brief summary is given in section 4.
2.Model description
The single-driver NHIS prototype designed for CFETR NBI system is shown in figure 1(a).The NHIS consists of a cylindrical driver region and a cuboid expansion region.A 3D Cartesian coordinate system is employed in the fluid model,with the origin fixed at the driver–expansion interface, as shown in figure 1(a).The driver region has a diameter of 28 cm and height of 14 cm, with five turns of RF coils surrounding.The length, width and height of the expansion region are 60 cm, 50 cm and 25 cm, respectively.When the magnetic field is applied, five permanent magnets, with remanent magnetization of 2.1 T for each, are arranged in a row along the x-axis downstream of each xz-plane of the expansion region.The length, width and height of each magnet are 9 cm, 5 cm and 2 cm, and they are placed 2 cm apart from each other.The RF current is flowing through the coil and the frequency of RF power is 2 MHz.It is worth mentioning that the gas pressure is 0.6 Pa and the absorbed RF power is 40 kW.
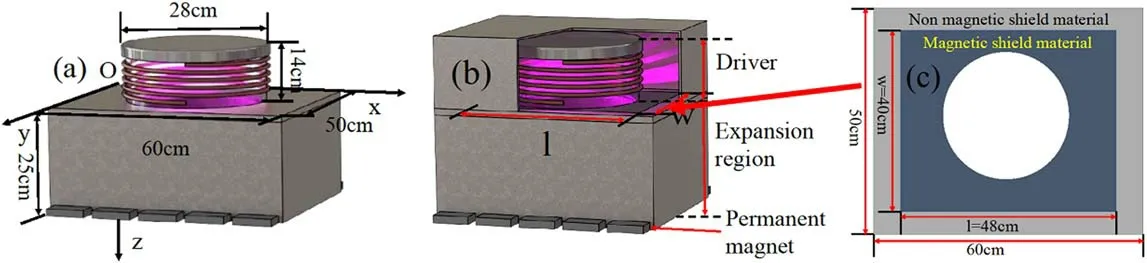
Figure 1.NHIS structures: (a) a single-driver NHIS prototype, (b)a single-driver NHIS prototype with magnetic shield, (c) the structure of the driver–expansion region interface.
In this work,the magnetic field topology is optimized by the magnetic shield.The magnetic shield is realized by applying high relative permeability materials(i.e.103,such as iron, whose relative permeability is 4× 10³) to the reactor walls to reduce the penetration of the magnetic field in the driver region.In order to clearly investigate the influence of the magnetic shield on the plasma generation and transport,a magnetic shield case is performed, i.e.the application of magnetic shield materials in the driver–expansion region interface.The case of the applied magnetic shield materials is shown in figures 1(b) and (c) (i.e.w = 40 cm, l = 48 cm).
In the simulations,eight different species are considered,i.e.electrons, ground-state moleculesH2,ground-state atoms H,and excited-state atoms H (n= 2) and H (n= 3) ,as well as H+,ions.Although the generation of negative hydrogen ions plays an important role in the NHIS, the corresponding reactions are ignored in this work, as the emphasis has been put on the influence of the magnetic shield on the distribution of the magnetic field and the plasma properties.In our future work,the negative hydrogen ions will be taken into account for more accurate simulations.The reactions considered in the model, as well as the references where the cross-sections are adopted from, are listed in table 1.
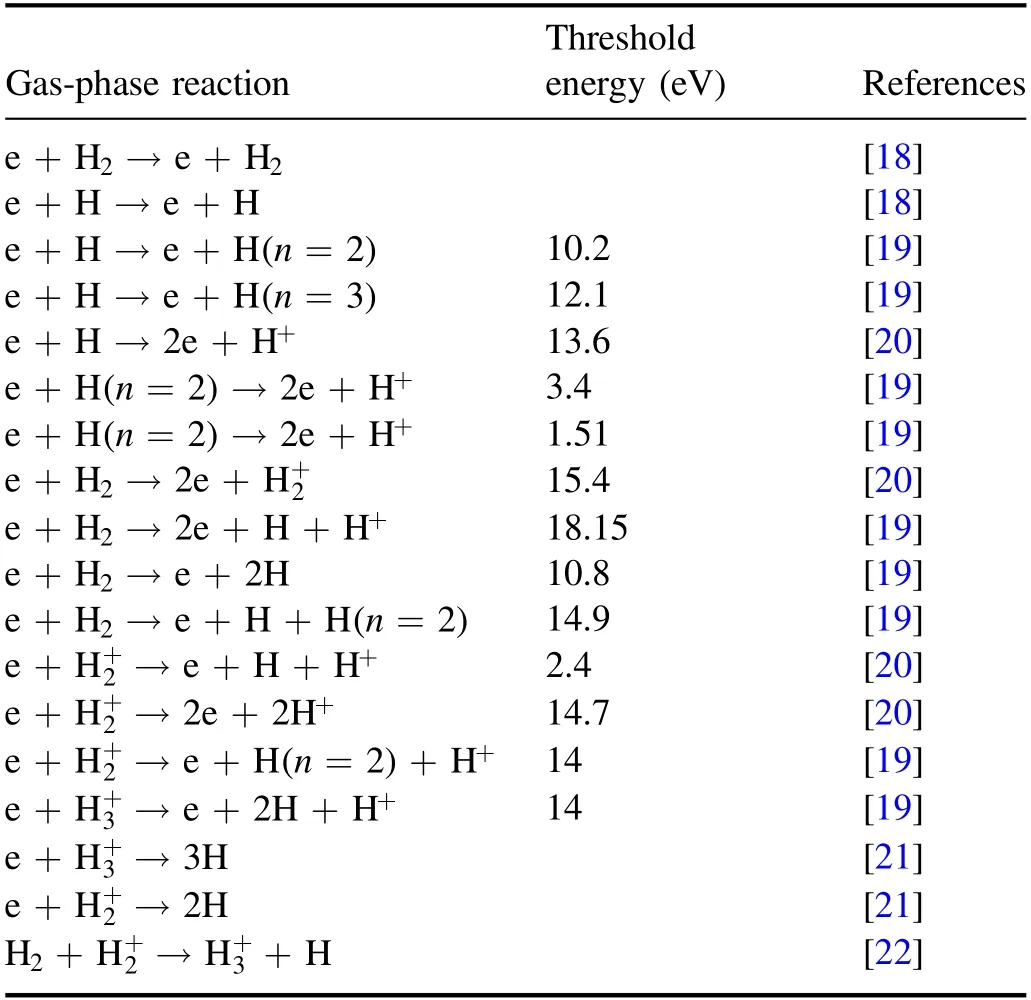
Table 1.Gas-phase reactions considered in this work.
2.1.Fluid model
A 3D fluid model for magnetized plasmas is developed within COMSOL Multiphysics.For electrons, the particle balance equation, momentum conservation equation and energy conservation equation are included.
The particle balance equation for electrons is given by
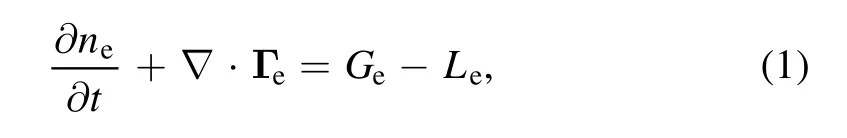
whereneand Γeare the electron density and electron flux,andGeandLerepresent the generation and loss due to collisions.
For the momentum conservation equation, the temperature gradient, inertial and convection terms are omitted:
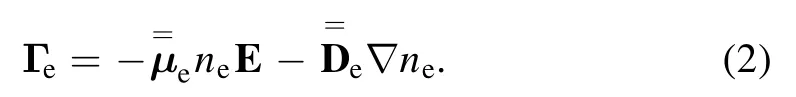
Here,E is the electrostatic field,andare the electron mobility tensor and electron diffusion coefficient tensor
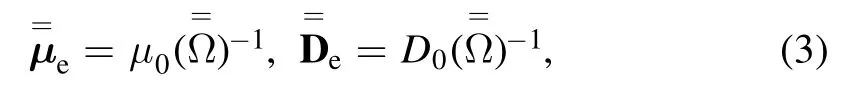
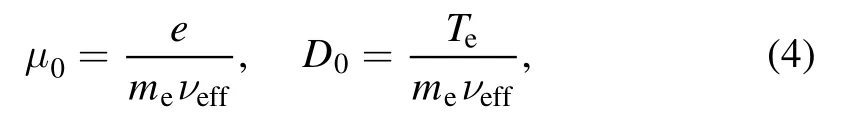
whereμ0andD0are the electron mobility and electron diffusion coefficient without external magnetic field
The electron energy conservation equation is
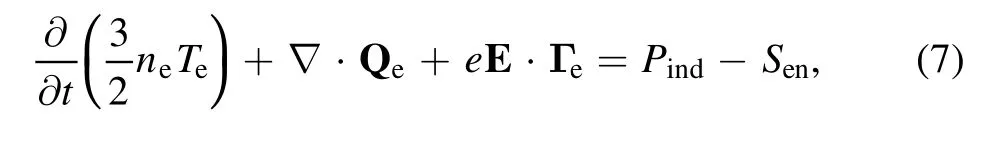
wherePindis the absorbed power density,as will be discussed in subsection 2.2,andSenis the energy loss term.The flux of energy Qeis given by
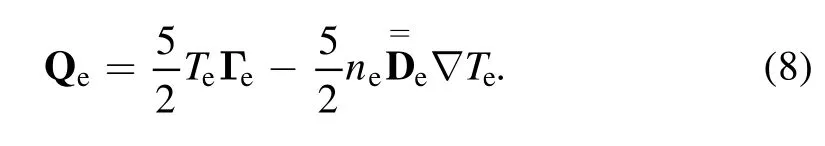
The boundary conditions of Γeand Qeat the walls are
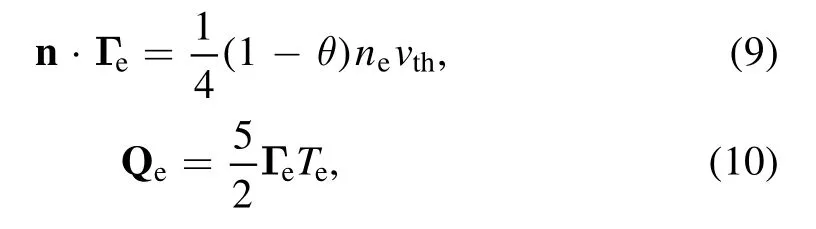
where n is the normal vector of the walls,vthis the thermal velocity of electrons, andθis the electron reflection coefficient [26].
Since ions and neutral species are often assumed to be at room temperature, only the particle balance equation and momentum conservation equation for ions and neutrals are considered.In future work, the temperature of neutral particles and ions will be calculated self-consistently.
We assume that ions are not magnetized, then the transport equations can be expressed as

whereniand Γiare the ion density and ion flux,andGiandLiare the generation and loss terms of ions.The ion mobilityμiand diffusion coefficientDiare adopted from [27].
For neutral particles, the transport equations are as follows
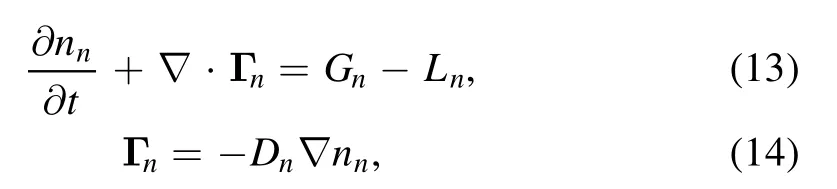
wherennand Γnare the density and flux of speciesn,GnandLnare the generation and loss terms, andDnis the diffusion coefficient from gas kinetic theory [28, 29].The boundary conditions of Γiand Γnat the walls are [10]
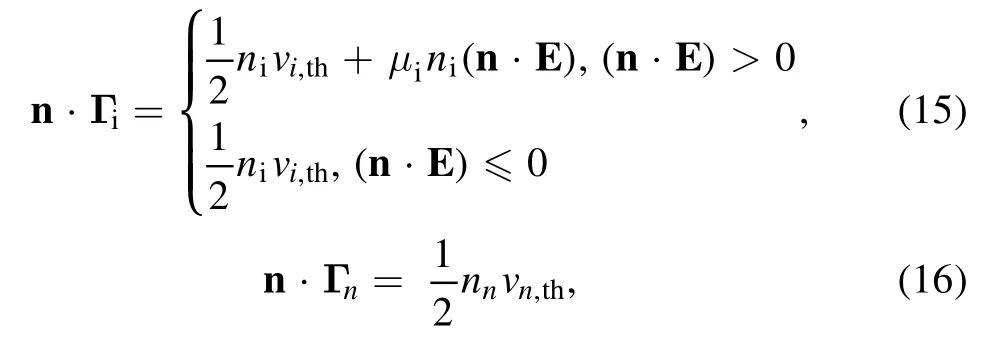
where Γi,and Γnare the flux of ions and neutrals,andvi,thandvn,thare the thermal velocity of ions and neutrals.
The electrostatic field is obtained by solving the Poisson equation
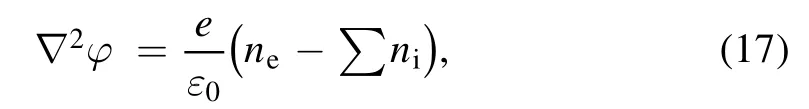
whereε0is the vacuum permittivity andφis the electric potential.At the walls, the electric potential is set to zero.
2.2.Electromagnetic model
In the electromagnetic model, the Maxwell equations are solved in the frequency domain, and then the electric field is described by
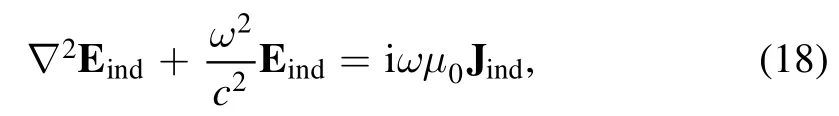
whereJindis the inductive current density,Eindis the inductive electric field, andi andμ0are the imaginary unit and permeability of the vacuum.
The absorbed power densityPindis given by
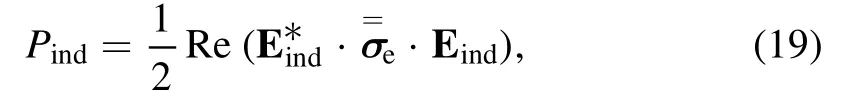
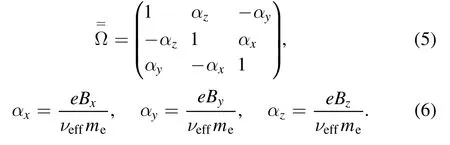
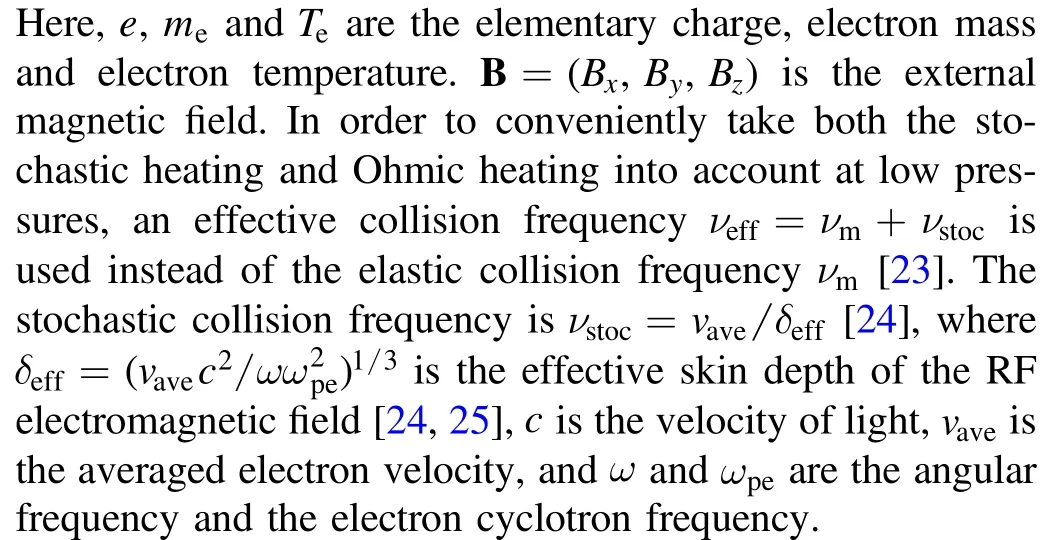
indThe conductivity tensor of the magnetized plasma is
where
At the walls, the inductive electric field satisfies ∇×Eind=0.
2.3.Magnetostatic model
The external transverse magnetic field is calculated by the magnetostatic model.In this model, the electric currents are not included, implying that the magnetic field is generated in a current-free region where ∇× H= 0 (H is the magnetic field intensity).By introducing the magnetic scalar potentialVm,the magnetic field intensity is expressed as H = -∇Vm.Since it is difficult to set the boundary conditions for the static magnetic field in the plasma region, the simulated region is expanded, i.e.the length, width and height of the region are 300 cm,300 cm and 200 cm.The NHIS is placed at the center of the region to maintain the symmetry of the original magnetic field.In the whole region, the static magnetic field can be obtained by solving -∇ (μ0∇Vm+μ0M) =0,with the boundary conditions of ∇Vm=0,whereM is the magnetization intensity.
3.Results and discussion
In order to optimize the magnetic field topology to increase the plasma density, the magnetic shield material is applied at the side walls of the expansion region and at the driver–expansion region interface.By comparisons, it is concluded that the plasma density can be enhanced efficiently when the magnetic shield is only applied at part of the driver–expansion region interface (indicated by the dark color in figure 1(c)),i.e.the length and width of the magnetic shield region are 48 cm and 40 cm.In order to illustrate the influence of the magnetic shield, the spatial distributions of the plasma parameters in three different cases are presented; i.e.case I: an NHIS without magnetic filter field and magnetic shield; case II: an NHIS with magnetic filter field and without magnetic shield; case III: an NHIS with magnetic filter field and magnetic shield at part of the driver–expansion region interface (l = 48 cm and w = 40 cm).
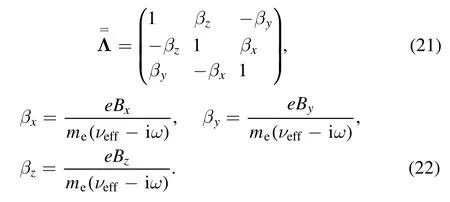
First, the influence of the magnetic field topology is illustrated by comparing the axial distributions of the electron density and the electron temperature along the reactor centerline (i.e.x = 30 cm and y = 25 cm) obtained in cases I, II and III, as shown in figure 2.In case I, the electron density first increases and then decreases along the z-direction, with the maximum appearing at the driver–expansion region interface.When the magnetic filter field is introduced in the NHIS (case II), the maximum of the electron density significantly decreases and shifts towards the driver region.From figure 2(a),it is clear that when the magnetic shield is applied(case III), the axial distribution of the electron density is similar to that of case II,but the absolute value is much higher[9],and is comparable to case I.This is because the magnetic shield reduces the magnetic field in the upper expansion region and in the lower driver region (figure 2(c)).With the application of a weak magnetic field, electrons tend to spiral around the magnetic field lines, which increases the collision probability with neutral particles, and thus the plasma generation is enhanced.Similar results were observed in [9].
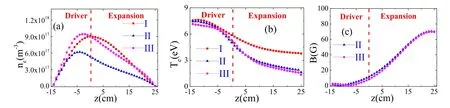
Figure 2.Axial distributions of the electron density (a), the electron temperature (b) and the magnetic field in case I, case II and case III.
In addition, the electron temperature in case I exhibits a slight increase at the top of the driver region, and then it decreases gradually along the axial direction, whereas the electron temperature in case II reduces monotonically from the driver region to the expansion region.In contrast to case I,the decline of the electron temperature in case II becomes more obvious,i.e.the electron temperature downstream of the expansion region decreases from 4–5 eV in case I to about 1–2 eV in case II [13].Moreover, the electron temperature downstream of the expansion region in case III becomes slightly lower than that in case II, due to the greater energy loss at higher electron density.
Figure 3 exhibits the distributions of Byand Bxin the 40 cm × 32 cm region of the xy-plane at a distance of 1 cm downstream of the expansion region in case II.By applying the high relative permeability material at the driver–expansion region interface (case III, not shown here), both Byand Bxdownstream of the expansion region are almost the same as those in the case without the magnetic shield (case II).In addition,Byis symmetric with respect to the lines x = 30 cm and y = 25 cm, whereas Bxis symmetric with respect to the center point (i.e.x = 30 cm and y = 25 cm).
Figure 3.Distributions of By (a) and Bx (b) in the xy-plane at a distance of 1 cm downstream of the expansion region in case II.
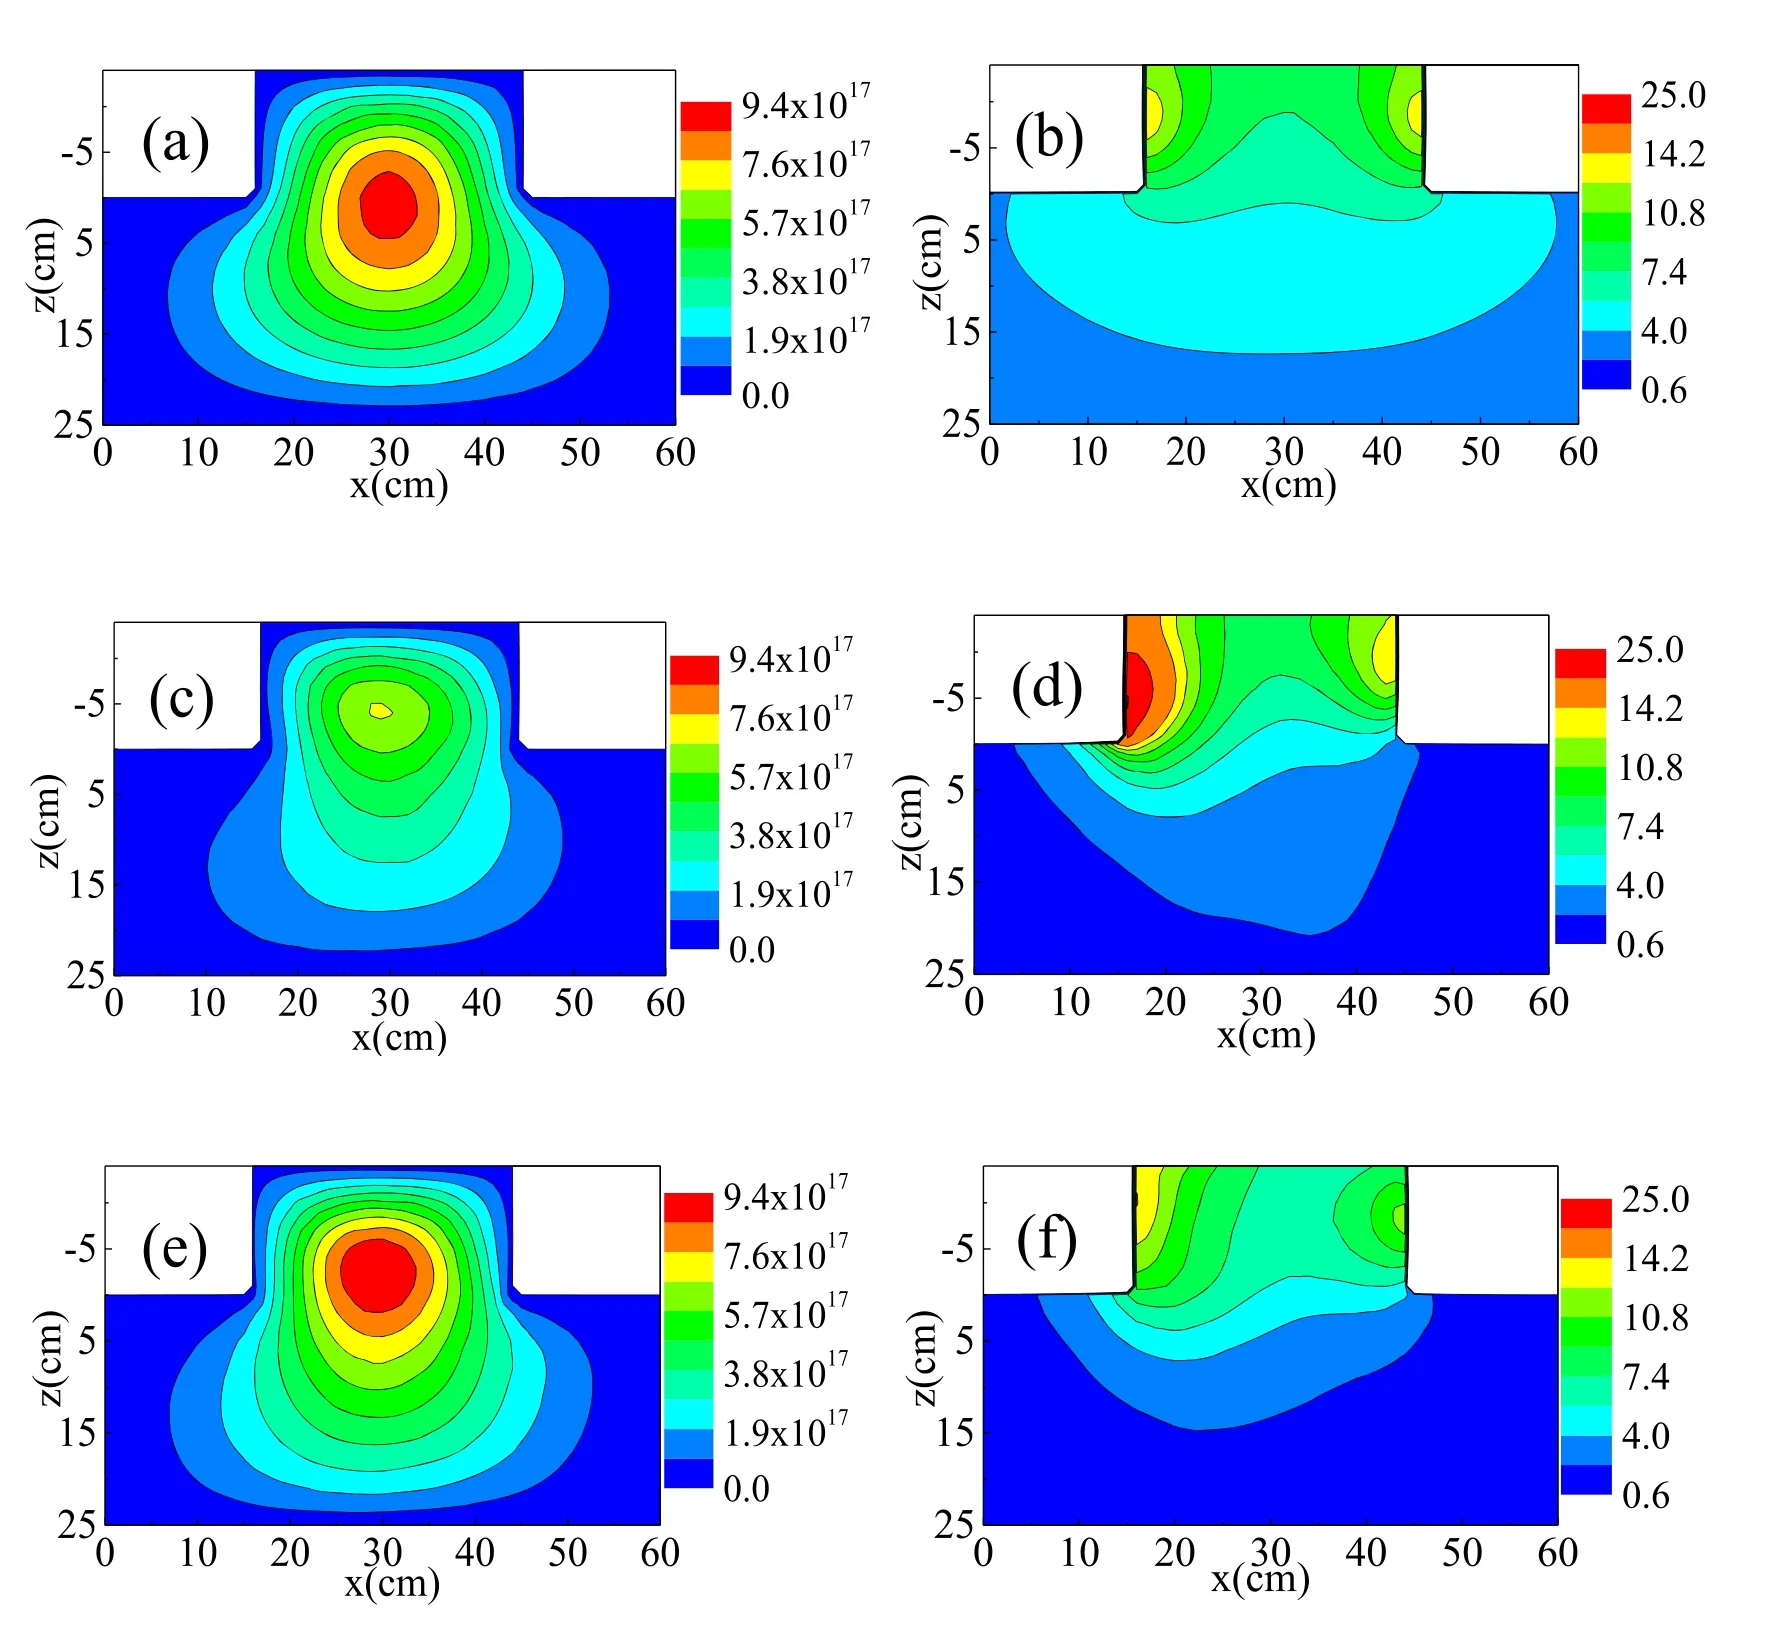
Figure 4.Distributions of the electron density (first column) and the electron temperature (second column) in the xz-plane (y = 25 cm) in case I (first row), case II (second row) and case III (third row).
The electron density and the electron temperature in the xz-plane (y = 25 cm) in cases I, II and III are presented in figure 4.It can be seen that the electron density in case I is symmetric with respect to x = 30 cm, and the distributions become asymmetric when the magnetic filter field is taken into account (case II and case III).This is because of the E × B drift along the x-direction, i.e.the electric field is mainly in the z-direction and the magnetic field is mainly in the y-direction.The evolution of the electron temperature is similar.For instance, the maximum of the electron temperature in case I appears at the side wall of the driver region,and the value is 13.5 eV (figure 4(b)).In case II, the electron temperature at the right side wall of the driver region is almost unchanged, whereas the value at the left side wall increases dramatically to about 25 eV (figure 4(d)).This is because when the magnetic field is applied, the electron mobility tensor and the electron diffusion coefficient tensor become asymmetric, and this gives rise to asymmetric power deposition [10].When the magnetic shield is considered, the magnetic field at the top of the driver region becomes stronger(see figure 2(c) above), which enhances the asymmetry.Therefore, the maximum of the electron temperature appears at the top left side wall of the driver region, with a much lower value (case III, figure 4(f)).
Figure 5 illustrates the distribution of the electron density and the electron temperature in the yz-plane (x = 30 cm) in cases I, II and III.It is clear that the electrons drift in the ydirection when the magnetic field is introduced (figures 5(c)and (e)), due to the existence of Bx, and the maximum of the electron density shifts to the driver region, as we mentioned above.In addition, the electron density distribution in the yzplane is always symmetric whether the magnetic filter field is applied or not, which is different from the results in the xzplane.In the case without magnetic field, the electron temperature distribution in the yz-plane is the same as that in the xz-plane, and the minimum value in the expansion region is 3.4 eV(figure 5(b)).When the magnetic field is included,the distribution of the electron temperature becomes strikingly different, and the minimum in the expansion region declines to 1.65 eV (figure 5(d)).In case III, the application of the magnetic shield decreases the minimum of the electron temperature, but the spatial distribution is almost the same.
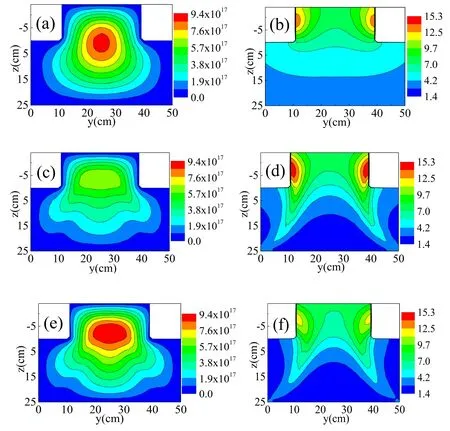
Figure 5.Distributions of the electron density (first column) and the electron temperature (second column) in the yz-plane (x = 30 cm) in case I (first row), case II (second row) and case III (third row).
Figures 6(a), (c) and (e) represent the distribution of the electron density in the xy-plane (z = 24 cm).Again, the electron density is asymmetric with respect to x = 30 cm in case II and case III,but it is always symmetric with respect to y = 25 cm in the three cases.Compared with case I, the maximum of the electron density moves to the negative x-direction when the magnetic field is applied, again because of the drift caused by By.The influence of the magnetic field on the spatial distribution of the electron temperature in the xy-plane is more obvious.For instance, when the magnetic field is applied,the electron temperature at the center declines significantly (i.e.from 3.8 eV to 2 eV), and the maximum moves from the center to y = 0 cm and y = 50 cm(figure 6(d)).This may be because the magnetic field Byis weaker at the center (i.e.y = 25 cm, see figure 3(a) above),thus only the low-energy electrons can be constrained to rotate around the magnetic field lines there.When the magnetic shield is introduced, the electron temperature exhibits a similar distribution, but the value drops, i.e.the maximum varies from 3.7 eV to 3 eV (figure 6(f)).
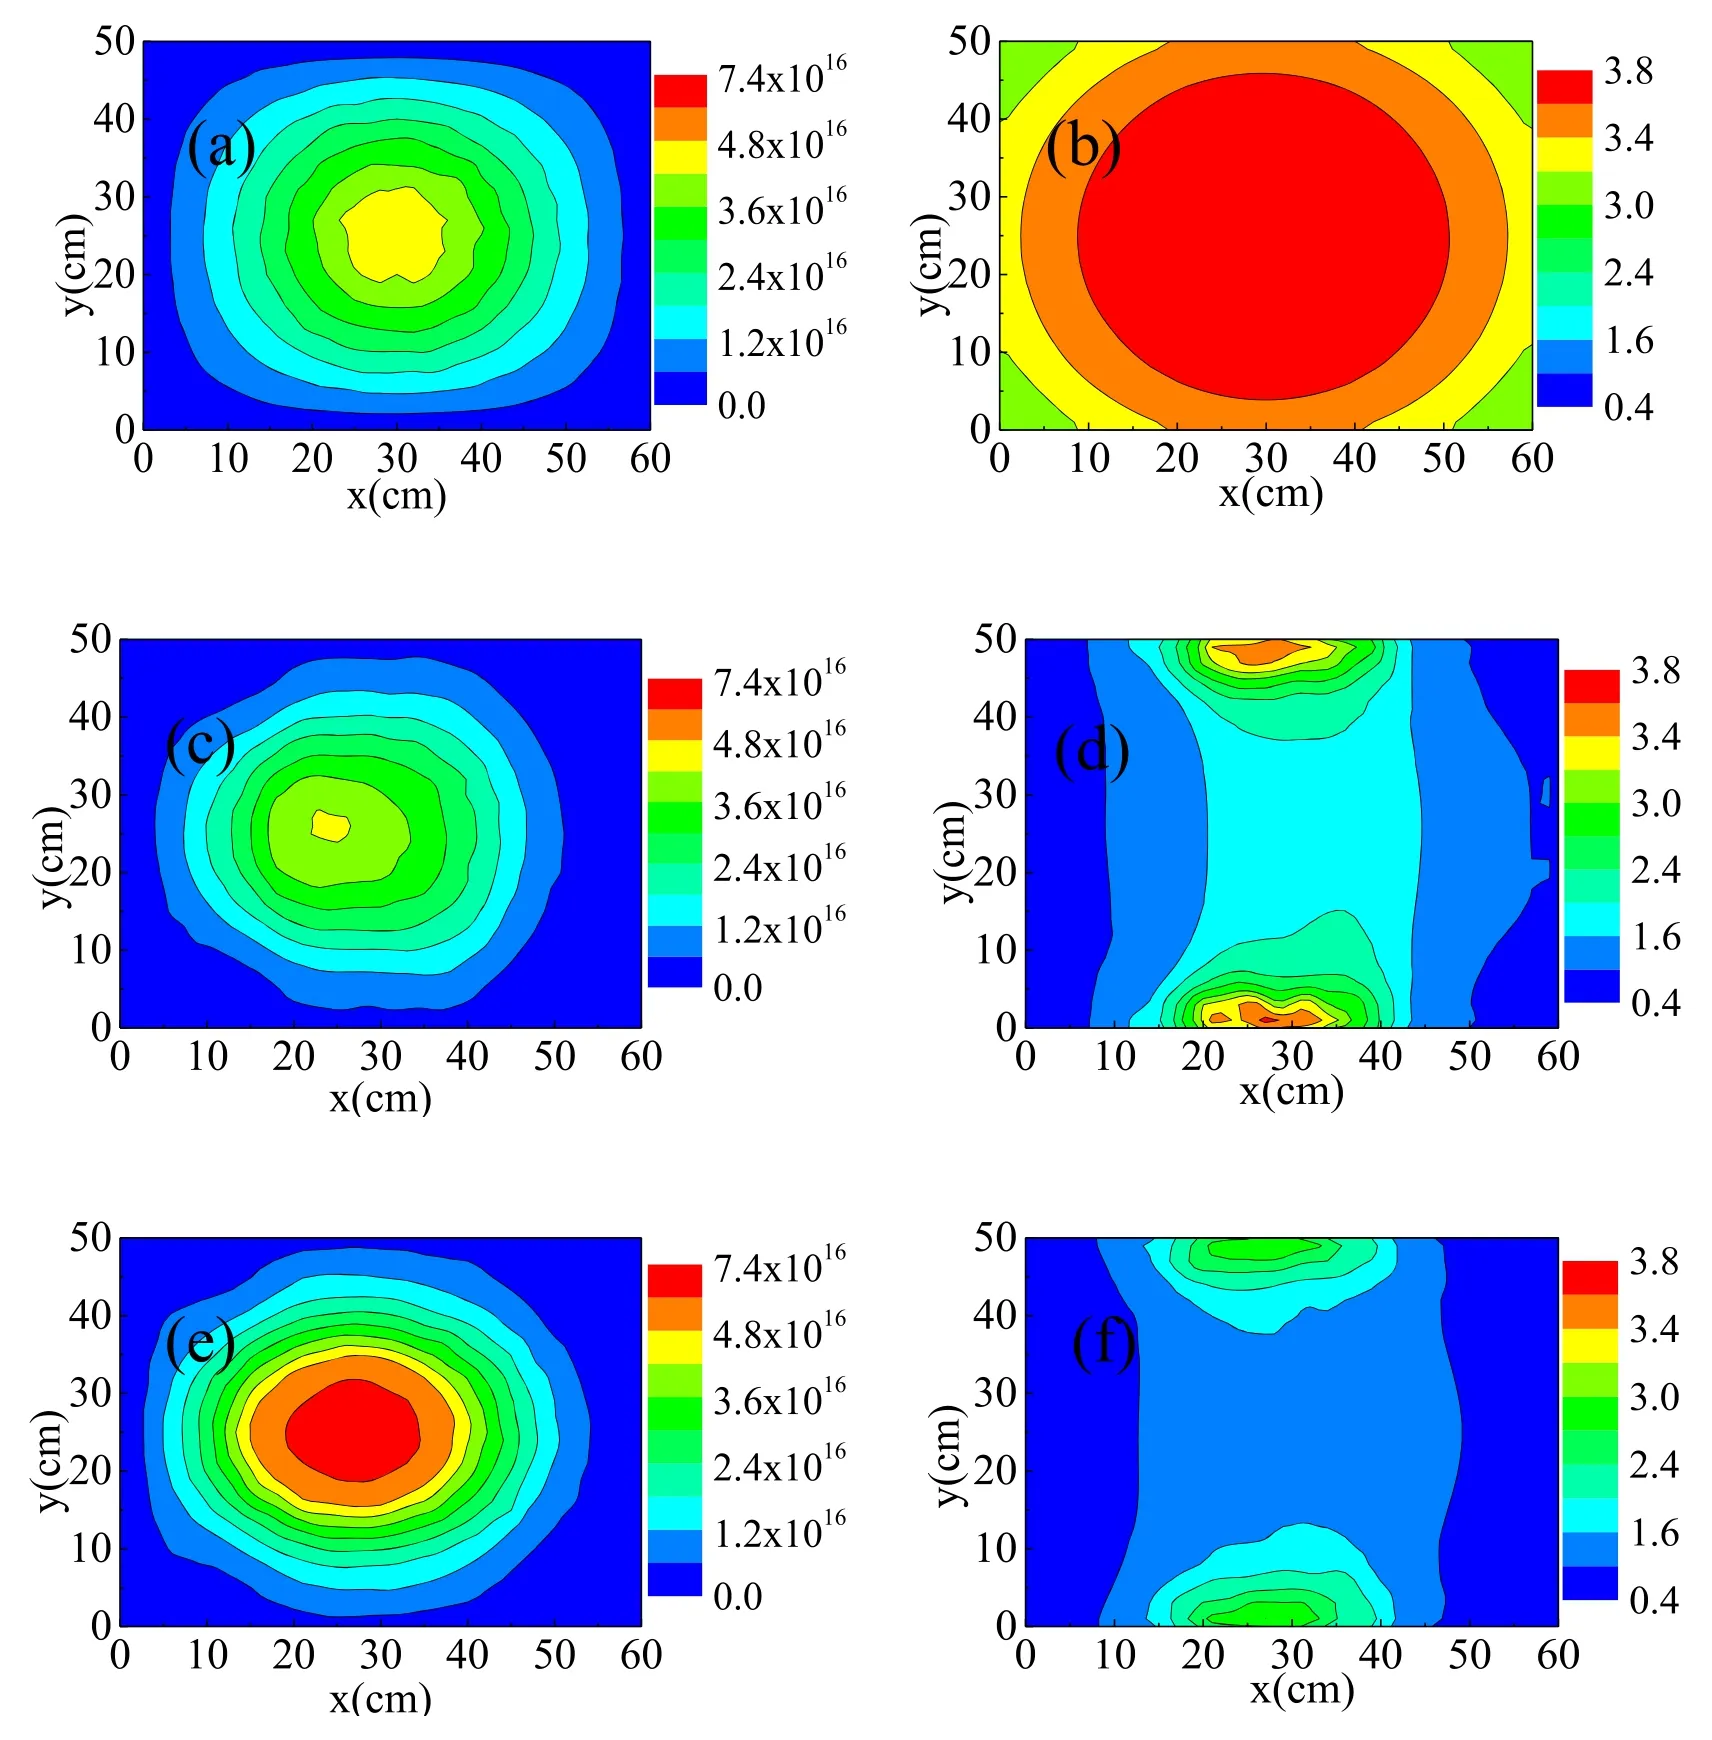
Figure 6.Distributions of the electron density (first column) and the electron temperature (second column) in the xy-plane (z = 24 cm) in case I (first row), case II (second row) and case III (third row).
4.Conclusions
In this work,a 3D fluid model is developed to investigate the effect of the magnetic field topology on the plasma properties.The magnetic field topology varies by introducing the magnetic shield, which is realized by applying magnetic shield material to the driver–expansion region interface.
The results indicate that when the magnetic field is applied,both the electron temperature in the expansion region and the electron density decrease rapidly.By introducing the magnetic shield at the driver–expansion region interface, the magnetic field topology is affected, and thus the plasma properties are modulated.Although the electron temperature downstream of the expansion region stays low, the plasma generation is enhanced effectively.For instance, the maximum of the electron density downstream of the expansion region rises from4.3× 1016m−3in case II to7.4× 1016m−3in case III.It is concluded that by applying the magnetic shield at the driver–expansion region interface, the electron temperature remains low and the plasma density increases significantly,which is important for enhancing the generation of negative hydrogen ions in the NHIS.
Acknowledgments
This work was supported by the National Key R&D Program of China (No.2017YFE0300106), National Natural Science Foundation of China (No.12075049) and the Fundamental Research Funds for the Central Universities (Nos.DUT20LAB201 and DUT21LAB110).
猜你喜欢
杂志排行

Plasma Science and Technology的其它文章
- Spatial and temporal evolution of electromagnetic pulses generated at Shenguang-II series laser facilities
- Numerical study on the loss of fast ions produced by minority ion cyclotron resonance heating in EAST
- Machine learning of turbulent transport in fusion plasmas with neural network
- Observation of coherent mode induced by a molybdenum dust on EAST
- Investigation of stimulated Raman scattering in longitudinal magnetized plasma by theory and kinetic simulation
- The influence of magnetic field on the beam quality of relativistic electron beam long-range propagation in near-Earth environment