基于空间句法的城市发展及空间结构演变
——以里斯本为例
2019-05-18特雷莎埃托尔约翰皮奈罗希尔瓦
特雷莎·埃托尔 约翰·皮奈罗·希尔瓦
引 言
空间句法研究领域以比尔·希列尔(Bill Hillier)、朱利恩·汉森(Julienne Hanson)及其同事于20世纪70年代早期在伦敦大学巴特利特建筑学院开展的开创性工作为基础。其起源可追溯至题为《人类—环境范式及其不一致性》的文章[1],但在文章《空间句法》[2]中首次提到发展至今日的空间句法的名称和理论基础,而此后在《空间的社会逻辑》(The Social Logic of Space)[3]和《空间即机器》(Space is the Machine)[4]这两本书中则展开了更为详细的叙述。
空间句法以空间的合成和表现性视觉表征(即所谓的轴向地图)为基础,除了能够解释人类空间系统,还具有对其社会意义和形式—功能影响的深刻推论能力。轴向地图由覆盖整个空间系统的最小轴系—轴线构成。这种表征形成“句法模型”的基础,在此基础上进行句法分析,构成了空间系统构形方式从表面上看较为抽象的表征。虽然句法表征有时被批评为简单化或简化,但其排除其他城市或建筑特征、现象和事件,而仅仅专注于空间构形,因此可以说恰恰相反,句法表征非常丰富,因为其中涵盖了对空间信息认知处理的各个方面。
不同于典型的以图形表征物理现实的方式(如在绘图或制图中),句法表征不是旨在再现度量和几何属性。相反,在某种程度上,它体现了占据空间的物理和视觉体验,即身处城市环境空间网络中导航人所经历的连续度。因此,轴向地图本身并不描绘视觉障碍物(例如建筑物、树木等),而是描绘基于持续视觉感知的空间网络及其潜在可达性。通过这种方式,空间句法表征并未简化,反而更加丰富,因其对观察者(用户)看到/体验空间(街道)网络的方式在认知上没有惰性,从而引导、创建用户可能用于导航的构形。句法表征可以说是“具体图”,因其反映了空间中的具体存在。
句法分析基于严格的数学描述,使用在图论中开发的一组算法。在轴向地图中,顶点或节点对应于轴线,并且当且仅当相应轴线相交时,两个顶点相邻。轴向图包含有关每条轴线与构成系统的所有其他轴线的连接信息,并可用于分析每条线相对于所有其他线的相对位置。以这种方式获得的属性不随每条线各自的条件而变化,而是随其在系统中的插入位置(拓扑)而变化。
在空间句法学术界内,已经创建并测试了几种句法算法。通过评判每项算法反映(关联)城市和建筑现象(例如行人或机动活动、土地使用类型、租金价值)的能力来评估其是否成功。尽管轴向地图在将模型与实际可测量现象联系起来方面具有良好表现,但总是明显地与城市形态不匹配,因为一条轴线可以越过几个区块,这有时意味着产生与比较现象大相径庭的观点。解决方案是在轴线交叉点处将其打破。由此,今天被认为是代表城市空间最佳方式的线段地图即诞生于空间句法背景下。然而,这引发了另一个问题:由于算法基于拓扑深度,当轴线被转换成线段时会产生深度,这会导致结果不够理想。空间句法学术界解决此问题最常见的方法是线段角度分析[5,6]。该分析计算从一个线段移动到下一个线段的“成本”,但不是从拓扑方面(即每段意味着成本的增量),而是从角度方面(较大的角度对应于较高成本)。因此,在相同方向上移动具有零成本,即模拟轴线的连续度。如上所述,该程序的理论基础与在城市环境中的感知和导航有关。
在空间句法学术界已开发和测试的所有算法中,有两个因其分析城市构形的能力脱颖而出:“选择度”和“整合度”。选择度(在图论中称为“中间中心性”)可以称之为对潜在通过流量的度量,并且通过计算所有可能的起点/终点(OA)对之间的最小成本(角度;方向的累积变化)路径来进行测量(将地图/图表的每个元素视为可能的起点和终点)。累积较多地在所有起点/终点对之间的最低成本路径上出现的那些元素,通常将呈现更高的选择度值(注意,该总和除以可能的行程的总数)。相反,在所有最低成本路径上总计累积出现次数较少的元素将具有较低的选择度值。
“整合度”(在图论中称为“紧密度中心”)是用于分析城市构形的第二个相关算法。该算法衡量中心性程度,通常强调城市中普通市民称之为主要街道的空间,也即大部分专业化商业的所在地,通常与城市中心的功能概念相关联。通常,在轴向地图上进行整合度分析。但是,由于在线段地图中使用此算法会有优势,因此必须更新轴向地图中使用的算法。与“选择度”的情况一样,当从对轴向地图的分析转移到对线段地图的分析,而不是从拓扑方面“计算”深度,则要从角度方面进行(其中较大角度意味着更高成本)。
这两种句法算法也与“自然活动”的概念有关,即由网格构形本身决定的城市行人活动的比例[7],并可用于建立空间的“整合度”值及其被理解为随机活动终点潜力之间的平行关系(到达活动)以及“选择度”的值与空间被用作其既不作为起点也不作为终点的旅程交叉点的概率之间的平行关系(穿越活动)。
为了说明如何使用空间句法方法论以探索城市扩展如何改变现有空间结构的潜力,我们研究了里斯本市。该分析遵循基于历史地图的历时过程,回溯到旧中世纪城市中心(即市中心)被地震活动大规模摧毁的日期,此后该地在1755年发生火灾和海啸。虽然在此次地震前里斯本已延续了诸多世纪,但从空间结构的角度来看,18世纪的市中心重建已经产生了某种类似于“归零地”的清理情况[8]。地震前的中世纪网格被一个正交网格所取代,该网格合理而实用地重新布置了新的“市中心”区域。到目前为止,这种结构网格几乎完好无损(图1)。
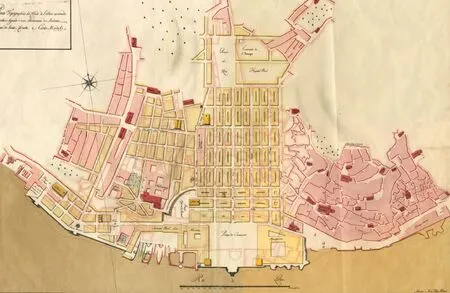
图1 / Figure 11755年地震后的1758年里斯本市中心重建计划The 1758 Plan for the reconstruction of the Lisbon downtown after the 1755 earthquake
该研究参考了一套(共8张)里斯本地图的“重绘地图”,这8张地图分别于1785年、1855年、1871年、1911年、1948年、1970年、1997年和2005年(2017年更新)出版,对应了大约230年时间跨度内城市演变的不同阶段。这些地图被分解为轴向和线段地图,因此通过结合轴向和线段角度分析,可以对城市结构演变进行时空分析。空间句法工具包(Space Syntax Toolkit)[9]是深度地图(Depthmap)[10]的前端,用于计算全局和局域尺度下的整合度和选择度模式,并获得城市空间中心性条件的一般情况。这些地图的颜色范围从蓝色到红色,蓝色代表最低值,红色代表最高值。根据等间距分类法,在所呈现的类之间进行阅读。
基于对8个轴向地图的视觉检查,即以定性而非定量方式,我们展示了城市增长过程的一般“规则”。全局尺度分析用于表示城市网格的收敛和分散程度。然后,我们展示了当代城市形态的一些新兴属性,应用基于不同半径的局域尺度分析来掌握邻域尺度上的局域结构。在此基础上,我们建议对里斯本市的一般结构进行重点澄清。
城市发展过程的一般规则
1785年的地图(图2)显示“市中心”正交网格为中心(即城市网格中最综合的区域,此地具有更高的整合值),以及对应于旧中世纪区域(城堡所在地)东部区域的高强度隔离水平。从方法论的角度来看,这些观察结果也很重要。一方面,更综合的区域与城市网格的几何中心不对应;另一方面,城堡周围的区域几乎与“市中心”一样具有中心性,只是隔离程度更高。因为东侧与中心的拓扑距离较小,类似的隔离水平仅可在网格西侧达到。需要注意的是,河岸是以市中心以东的海湾形式构形,不允许直接的东西向连接,这必然导致产生拓扑距离并因此产生隔离。此外,还要注意在“市中心”区域内,东西轴线和南北轴线之间存在差异。东西线的较低值是缺乏连续度和连接的结果,在此特定案例中,这是由地形条件造成的。
1855年的地图(图3)遵循类似的层次模式。在城市东北部建立的新联系对空间结构没有重大影响。
另一方面,在1871年的地图上可以清楚地看到已有结构的变化(图4)。在“市中心”西侧立即修建了一条新堤坝,以防止河水淹没邻近地区,并且沿河边地区开辟了一条新轴线。此新轴取代了现有轴,并创建了更直接的与南北轴的新连接。这一变化使城市网格西部的整合度值显著增加。尽管这似乎有点不可思议,但由于构形发生显著变化而系统没有成比例增长,所有整合度值都略有下降(包括所有红线)。简单来说,这种现象可以解释为对整个系统空间整合的再分配和稀释。
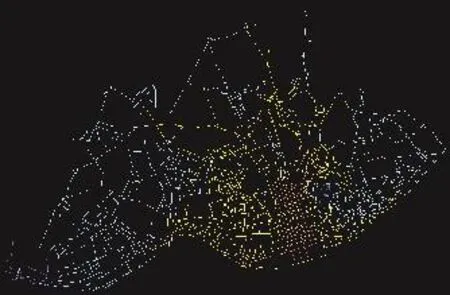
图2 / Figure 21785年轴向地图:整合度;全局半径1785 axial map: Integration; Global radius

图3 / Figure 31855年轴向地图:整合度;全局半径1855 axial map: Integration; Global radius
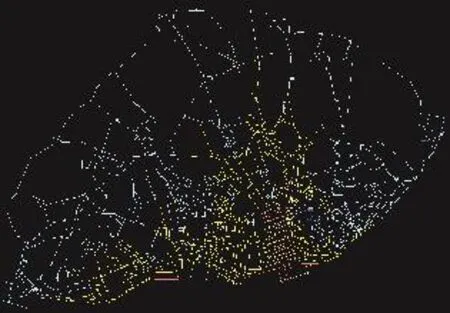
图4 / Figure 41871年轴向地图:整合度;全局半径1871 axial map: Integration; Global radius

图5 / Figure 51911年轴向地图:整合度;全局半径1911 axial map: Integration; Global radius
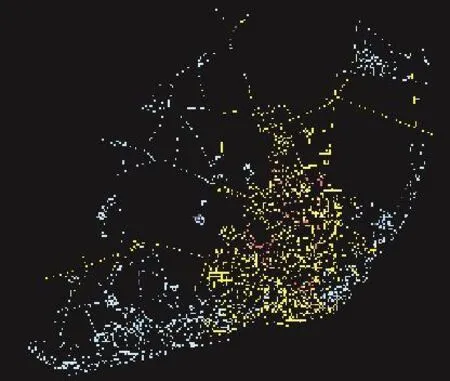
图6 / Figure 61948年轴向地图:整合度;全局半径1948 axial map: Integration; Global radius
1911年的地图(图5)首次显示了穿过垂直于河流的两条“动脉”开口的腹地渗透,将市中心区与北部和西北部周边地区联系起来,后者被证明是现代化城市的象征,即现代化蓝图。根据城市的两个中心山谷,这些轴按照自然景观布局。
城市组织的致密化是通过围绕这两个轴进行一系列干预来实现的,此类干预将集成核推向北方,同时与外部保持强大联系,并使新兴的变形网格成形。城市结构向西的扩张保持了周边特征,也被低整合度值转化,而未对当时的空间构形产生明显影响。
1948年的地图(图6)显示了两个结构性南北轴线的北部扩展,并显示了集成核如何沿这些轴线扩展,并与外部保持很强的联系。在东北部山谷中确定的轴线变得至关重要,其在城市中心附近的区段人口密集。然而,此轴线的扩张相比城市中心区北部山谷的扩张程度较轻。
网络的东西向扩展虽然在外围,但增加了核心的整合度(在地图上显示为红色结构)。从现在开始,关键集成核的形状就像变形的轮胎花纹边缘。然而,由于城市的地形,连接到这些边缘的长半径不会在焦点处向内完全会聚,以形成坚固的内部中心。变形网格致密化需要建造新的住宅区才能实现,并伴随网络向北和东北的扩展。
从现在开始,城市进入了一个动态扩张时期,从而推动了战略基础设施的发展。这一增长包括开辟了几条“动脉”,房地产开发商和私营建筑商推动的住宅区和其他设施的建设,以及从1940—1970年开展的大规模公共运营。
1997年的地图(图7)显示了城市结构的规模越来越大、城市网格的密集化以及新城市网格的多样化。“市中心”区域第一次大大降低了其中心性特征。全局集成核首先偏向北方,然后略微漂浮到西侧和东侧,并进一步向东北方向漂移。
这种扩张和重新定位的模式符合希列尔[4]所描述的“中心性悖论”,因为天然屏障的存在限制了边缘到中心链接的效果。
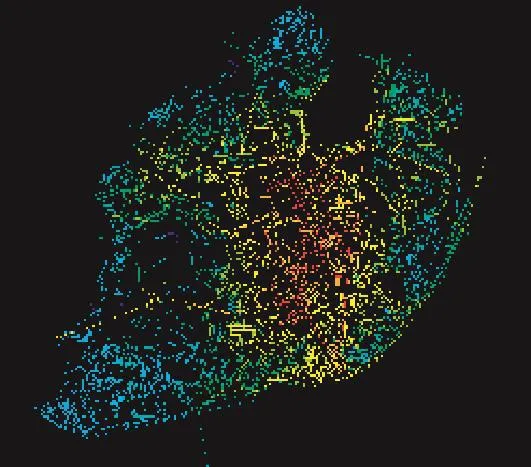
图7 / Figure 71997年轴向地图:整合度;全局半径1997 axial map: Integration; Global radius
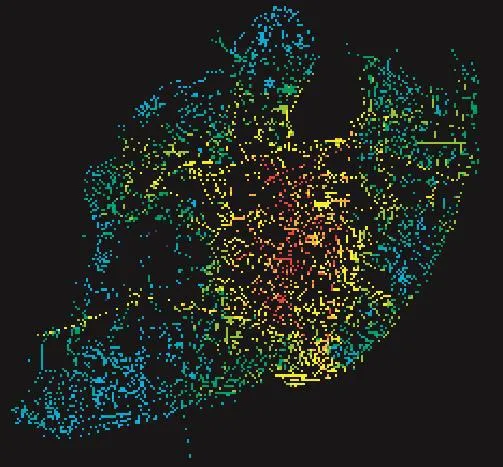
图8 / Figure 82017年轴向地图:整合度;全局半径2017 axial map: Integration; Global radius
如2017年地图(图8)所示,1997年之后发生的主要变化是已有结构的东北向扩张,此前一处废弃和贫困的海滨因世博会(1998年世博会)在当地举办而改造为混合功能类开发项目。该世博会展览区成为城市的新交汇点和长廊区。然而,从整个城市空间结构来看,此地的作用微不足道,不会导致自1948年以来已建立的中心移位或增长。
城市结构向西的扩展保持了周边特征,也是由低整合度值转化而来,对空间构形没有结构性影响。城市网格的逐步致密化过程也减少了周边区域的隔离程度,同时提高了中心核心整合度。
集成核的规模增加并且其结构得到加强(虽然并不显著),向北略微移动,大大降低了市中心的中心性。然而,中心核心与城市其他部分之间缺乏结构连续度,表现为与城市网格连接为一体的中心轴和局域轴之间缺乏连续度。
第2部分:城市形态的新兴属性
对这些地图的历时分析表明,里斯本的拓扑中心性在18世纪地震后由有些不规则的网格模式演变为更线性的结构和变形的网格,这是由于19世纪末在两个南北轴上建立了更深的腹地渗透。城市结构的北扩推动了南北轴线而不利于东西轴线,并推动集成核向北推进,促使城市活动远离海滨地区。南北轴既是里斯本城市转型过程中的里程碑,也对20世纪发展起来的新城市扩张起到支持作用。尽管这些结构轴具有战略性特征,但似乎该城市已经发展成为各种城市网格的独特大杂烩。对当前城市地图(2017年地图)局域空间结构的分析将证实这一假设。

图9 / Figure 92017年线段地图:选择度—半径1(r1)1分钟/80m距离2017 Segment map: Choice - radius 1 minute1 (r1) 1 minute / 80 meters distance

图10 / Figure 102017年线段地图:整合度—半径3(r3)3分钟/240m距离2017 Segment map: Integration - radius 1 minute3(r3) 3 minutes / 240 meters distance
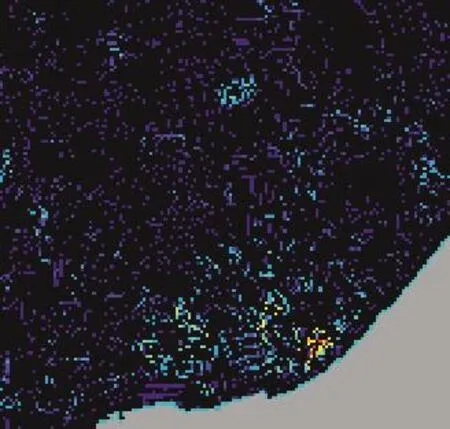
图11 / Figure 112017年线段地图:选择度—半径3(r3)3分钟/240m距离2017 Segment map: Choice - radius 1 minute3 (r3) 3 minutes / 240 meters distance
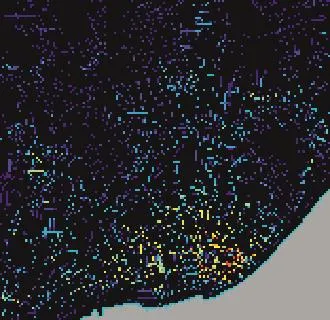
图12 / Figure 122017年线段地图:选择度—半径10(r10)10分钟/800m距离2017 Segment map: Choice - radius 1 minute10 (r10)10 minutes / 800 meters distance
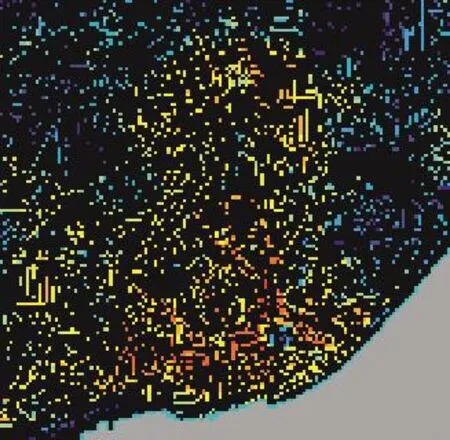
图13 / Figure 132017年线段地图:整合度—半径10(r10)10分钟/800m距离2017 Segment map: Integration - radius 1 minute10(r10) 10 minutes / 800 meters distance
可以就各种半径进行局域分析。出于该解释性研究的目的,使用80m、240m、400m、800m、1,200m和2,400m半径,分别对应于表1所示步行时间。此后,将根据时间而非距离描述半径值。图9显示1分钟距离内的“选择度”值(r1)。请注意,在此分析半径范围内,只有历史悠久的中世纪地区中心线段才有一定的“选择度”。这些区域呈现几何不规则的结构,并且线段长度(和街区大小)小于平均值。虽然从典型句法分析的角度来看r1作用不大,但在此示范性语境中引人注意,因其代表了穿越活动在极短旅程(80m)中的潜力。考虑到半径如此之窄,所有长度小于160m的线段都无法提供超出其自身的可达性。唯一具有一定有效能力、在提供差异化可达性(接近度或选择度)方面能力较为突出的线段对应于长度小于160m的线段。同时,考虑到分析算法的性质,长度不是唯一决定因素,因为连接度亦是关键因素。因此,该半径将突出显示尺寸减小但具有显著连接度的线段。显然,这种情况会更频繁地发生在城市较旧的地区,因为那里街区面积较小。
当分析半径变为3分钟(240m)时,差异是显而易见的。一些地区在此规模上呈现出显著的整合度(图10)。此外,其中一些地区具有明确规定的核心。还应该指出的是,北部地区内其他较新地区的整合度变化程度较小,尽管其具有显著的整合度值。
图11显示了基于相同半径(3分钟,240m)的“选择度”值。同样,只有中世纪的区域包含在引导本地流动方面能力较为突出的线段。
现在让我们考虑基于更大半径(半径800m/10分钟)但仍在这些区域范围内的活动潜力(图12、图13)。
最古老的区域再次在“选择度”方面突出体现为具有一致的值分布(图12),而在整合度方面(图13)则失去相关性。新兴结构覆盖了位于“市中心”区域和紧邻区域的较旧的轴。这种结构保证了两个中心谷的连接。但是,请注意中世纪地区现在是如何被显著地隔离,尽管其地理位置或连接度未变化。
此分析先前支持的观点是中世纪地区有自己的结构和明确的层次,这在分析半径较低时可见。然而,应注意,当半径较大时(即使仍在步行距离内),这些特征会消失(图14和图15以及30分钟半径)。
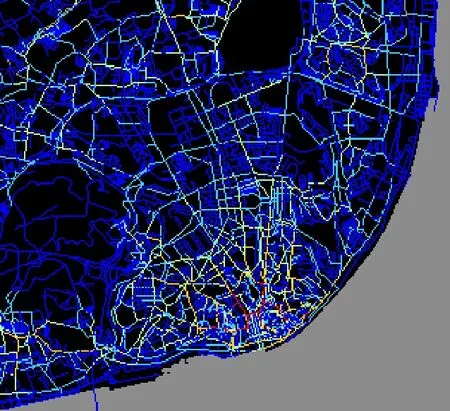
图14 / Figure 142017年线段地图:选择度—半径30(r30)30分钟/2,400m距离2017 Segment map: Choice - radius 1 minute30 (r30) 30 minutes / 2,400 meters distance
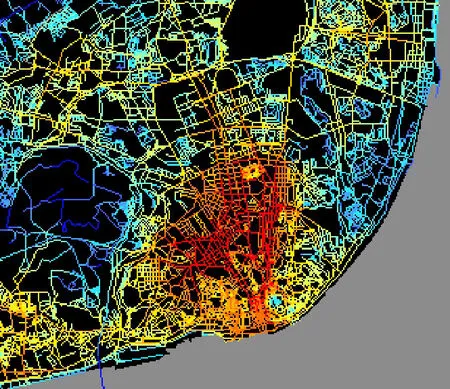
图15 / Figure 152017年线段地图:整合度—半径30(r30)30分钟/2,400m距离2017 Segment map: Integration - radius 1 minute30(r30) 30 minutes / 2,400 meters distance
半径30分钟范围内的“选择度”值表明该区域(图14)几乎完全不具备活动潜力。虽然这些区域的隔离变得明显,但此隔离与此类区域的地理中心性形成对比(图15)。这并不意味着这些区域已经失去了任何属性,但是考虑到整个城市网络,在半径较大时的隔离程度意味着这些区域在某种程度上失去了作为到达活动和穿越活动载体的作用。城市网格的增长并没有加强这些区域与其核心的联系,因此使其自身闭合。这是一种经常出现的现象,可以将城市结构转变为一系列不可思议且几乎是排他的小型当地现实面貌。当基于更大半径进行分析时,这种现象会加剧。
现阶段,我们将澄清这一分析,旨在说明空间句法的方法论,并尽可能地强调其在城市规划和设计中的作用。毋庸置疑,这些街区应该消除隔离,或者应该进行改造,以在半径更大时起作用。尽管如此,此分析仍可用于重新考虑其全局整合度状况,同时保留特定本地特征和优势。此外,应该注意的是,提高整合度并不一定意味着从城市网格的中心点开启直轴,但这一点最终可以通过一系列小的变化来实现,这些变化重新定义了视觉和物理可达性的一些对齐方式。
图15显示了可以视为里斯本市当前中心的区域。中心核心几乎完全与城市其他地方分离。可看到由与城市网格连接为一体的局域结构支持的连续度轴线。与“选择度”值(图14)相比,可以看出,在20世纪初建造的两个结构轴的南部各区段普遍作为穿越活动元素。随着半径较低时的可达性/移动性增加,这可以解释市中心区商业活动的持续性(而房地产的主要区域已经向北迁移),同时服务集中度越来越高,从而导致这些区域周围出现专业化趋势。
通过对里斯本大都市区(AML)进行简要分析,可以清楚地看到,其集成中心位于里斯本市,该市大部分区域与其集成中心相吻合。然而,如图16所示,在局域半径(15分钟)内,出现了具有单个可见集成核的多个区域,从而形成了局域中心。这表明里斯本的自治权有所下降,说明许多此类局域中心有其自身的当地城市生活。
该地图还突出强调了里斯本市为主要局域中心的地位。图17描绘了全局半径的算法,显示了具有最大到达活动潜力的路径。应该注意的是,突出显示的线条如何与AML的高速公路和其他结构可达性相一致。此外,在此层面上,里斯本的位置似乎并没有显得特别突出。然而,通过更详细的分析可以发现,与其他中心不同,基于全局半径的这些选择度元素与基于局域半径的选择度元素以及局域和全局半径整合度突出元素一致。这种空间一致性是一项基本特征,揭示了有关城市群功能和韧性的一个非常重要的因素:协同作用,其通过以下互连实现:①各种类型的活动,即分别通过整合度与选择度算法表征的到达活动和穿越活动;②每种活动各自不同的空间范围(半径)。
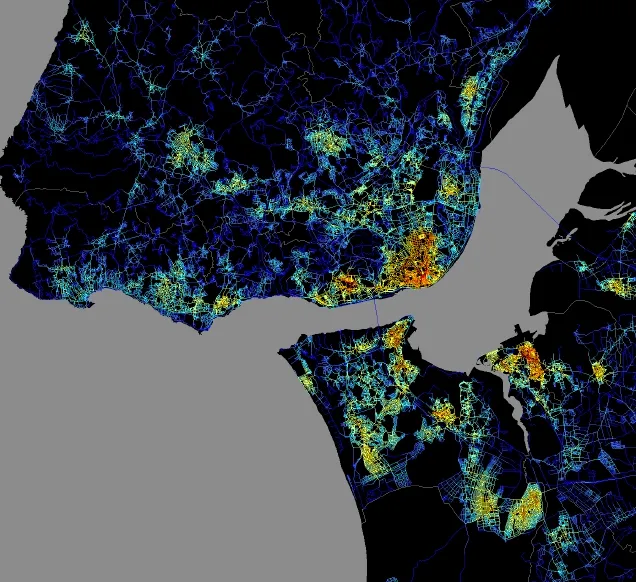
图16 / Figure 16里斯本大都市区—线段地图:整合度—半径15(r15)15分钟/1,200m距离Metropolitan Area of Lisbon - Segment map: Integration - radius 1 minute15 (r15) 15 minutes / 1200 meters distance1 minute
结 语
该分析完全依赖于城市构形,并突出城市主要结构及局域子结构,以及与构形本身直接相关的主要和局域循环轴。但是这种分析方法本身效用有限。事实上,该算法缺乏证据,即尚未采用适用于空间使用,并可用于评估句法(理论)模型实际适应性的“真实”算法。
没有有效的城市交通系统,城市就无法生存。活动对人们的生活至关重要,是当今城市宜居性和效率的关键组成要素。大多数城市正在努力实现的宜居性以及与之相应的城市经济健康状况都取决于其适应和管理流动性的能力。为实现此目标,城市设计师再也不可忽视城市交通系统与城市构形的相互作用。
获得实证性证据后,句法分析即可为战略中长期目标的短期决策提供信息。通过识别在引导活动方面具有最大潜力的线段,可以整改城市构形以响应需要客流量的商业活动的需求。此外,如果特定区域内的交通流量应处于较低水平,则可以通过更改构形来实现。同样,有关区域在整合度(及其使用)方面的理论潜力知识可用于规划和管理城市空间,以强调或减轻这一特征,而无论其是否对城市运作有影响。此外,句法方法论还可以用于预测构形变化的影响,从而促进城市规划和城市设计策略的实施。
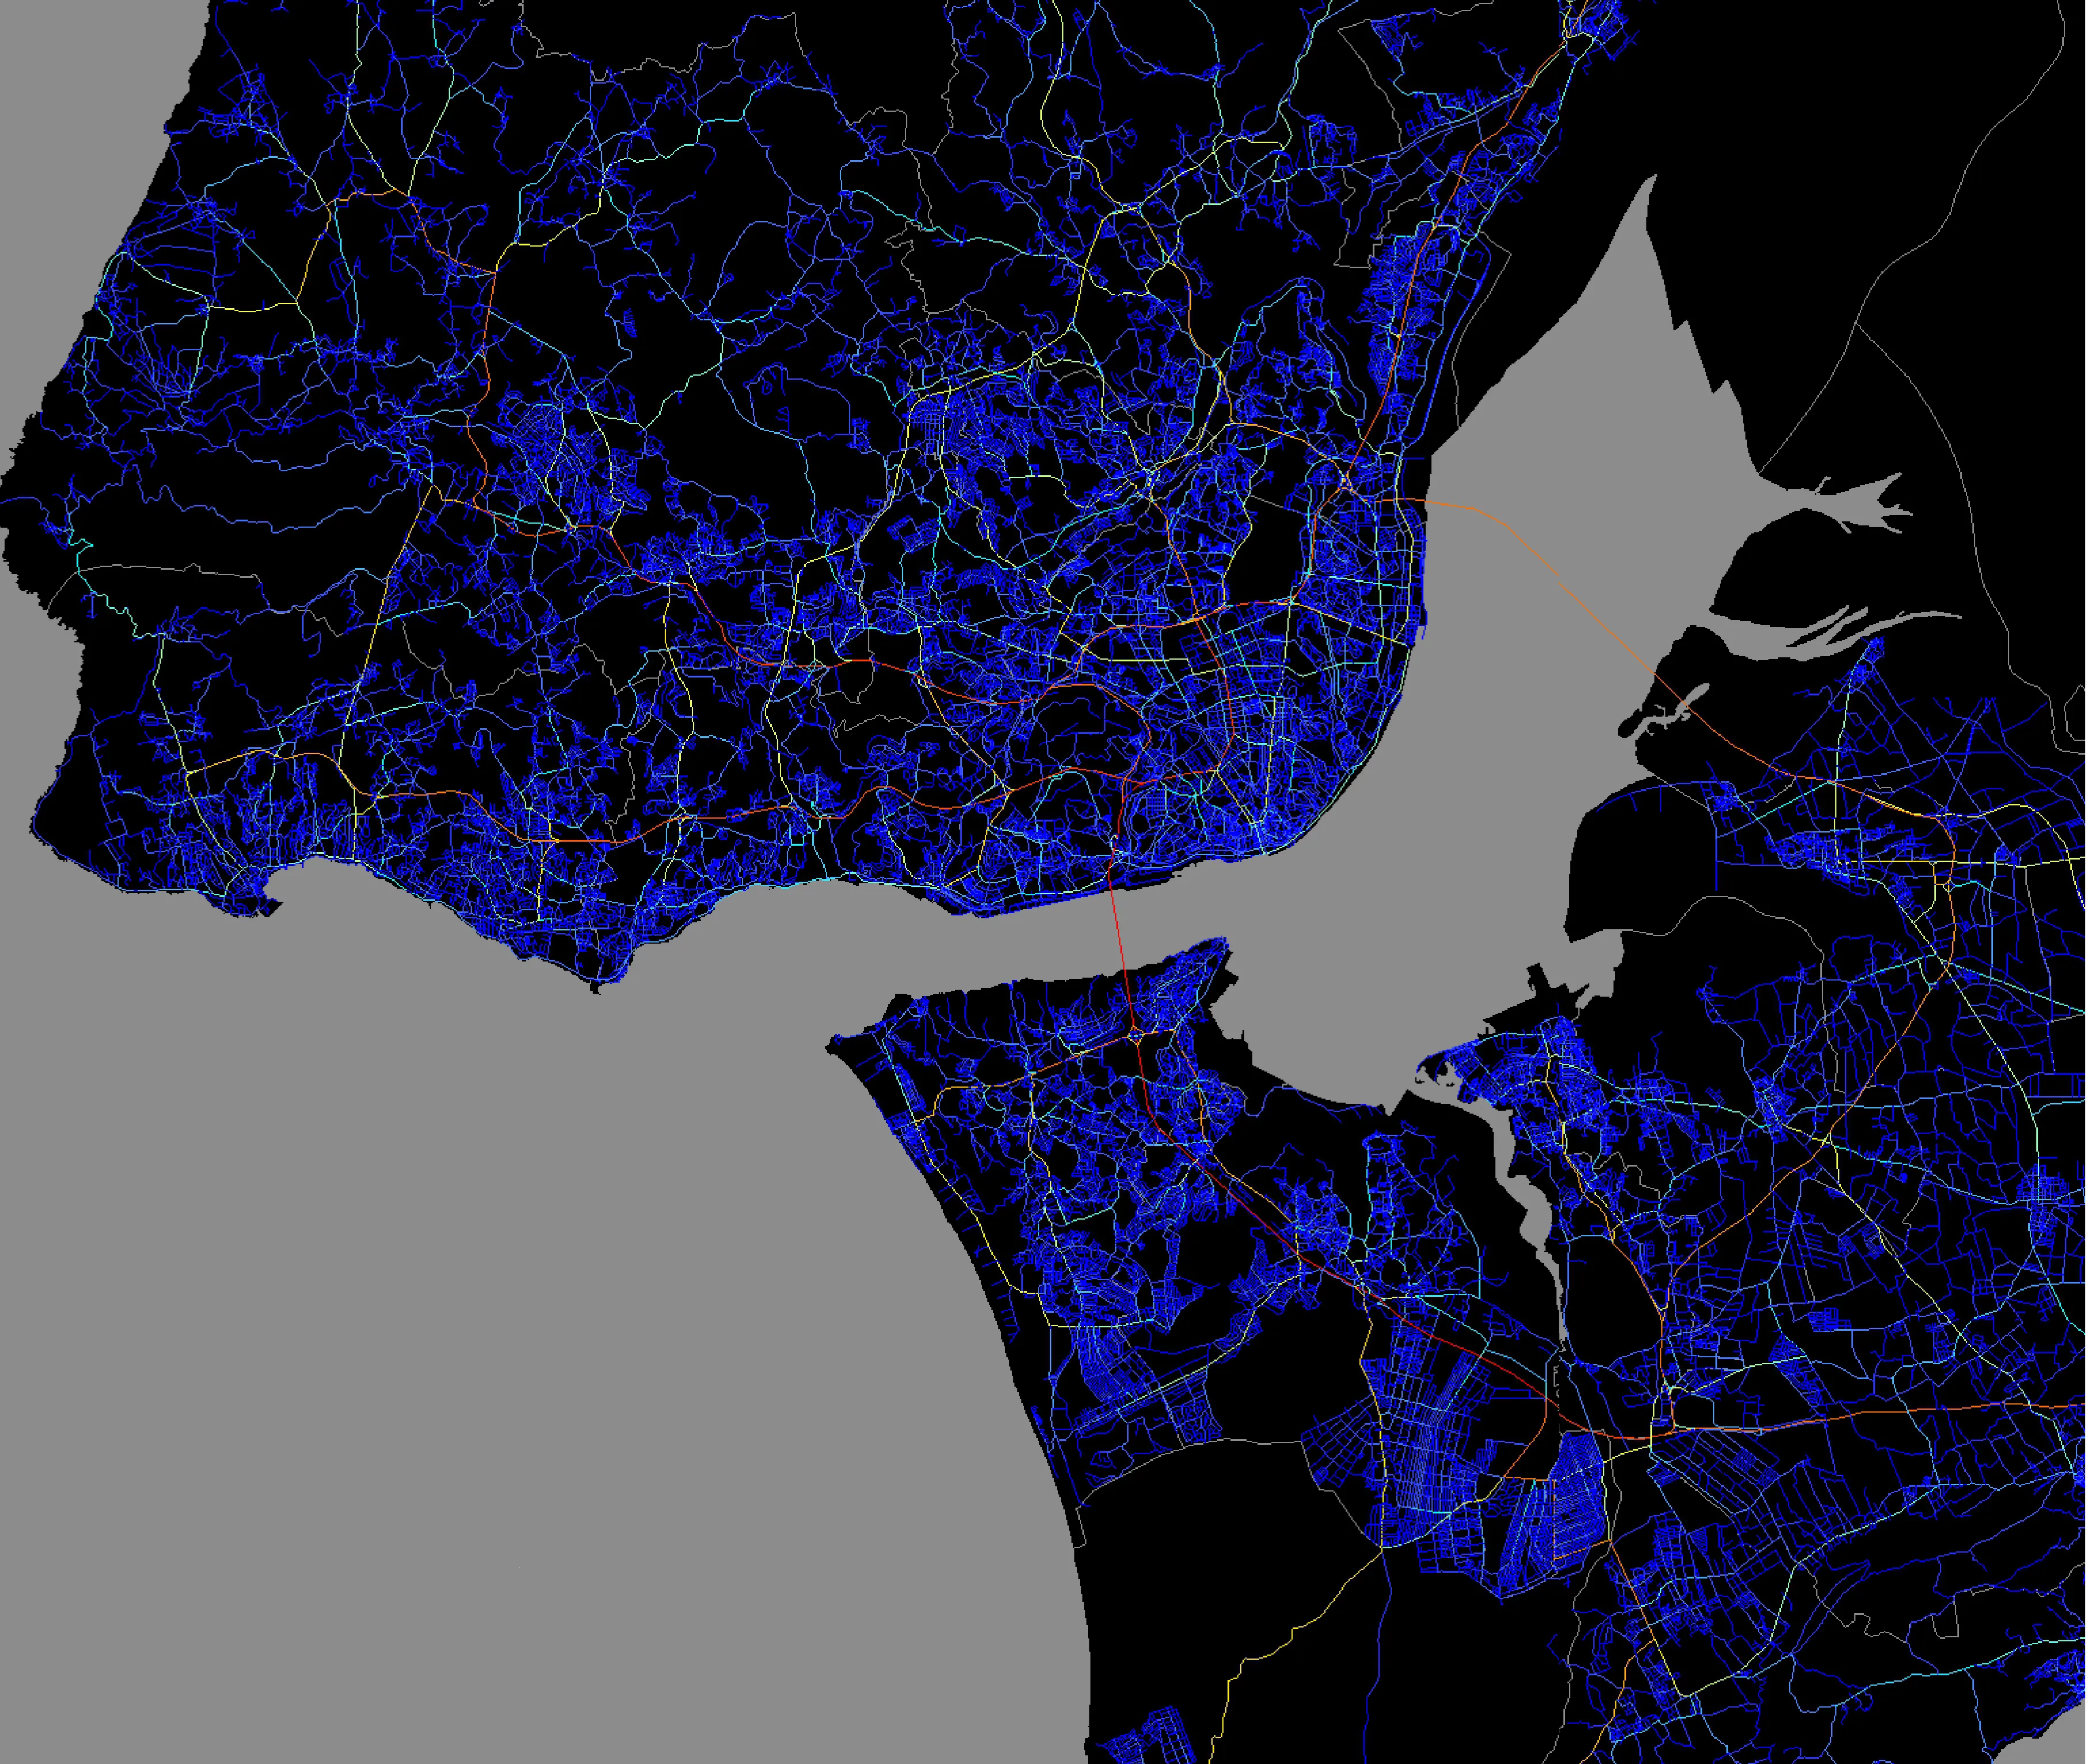
图17 / Figure17里斯本大都市区—线段地图:选择度—全局半径Metropolitan Area of Lisbon - Segment map: Choice -global radius 1 minute
Understanding Urban Changes Through Space Syntax:The Case of Lisbon
Teresa V. Heitor, João Pinelo Silva
Introduction
The space syntax research field is grounded on the pioneering work of Bill Hillier, Julienne Hanson and colleagues, developed in the early 1970's at the Bartlett School of Architecture,University College London. Its origins can be traced back to the article entitled “The man-environment paradigm and its inconsistencies”(Hillier, 1973). But it was the article “Space Syntax” (Hillier et al., 1976) that fi rst mentioned the name and theoretical basis that was to be developed with space syntax, later detailed in the books The Social Logic of Space (Hillier and Hanson, 1984) and Space is the Machine (Hillier,1996).
Beyond its interpretive capacity of human spatial systems and on insightful inferences of their social meaning and form-function impact, Space Syntax is supported on a synthetic and expressive visual representation of space, the so-called axial map. The axial map consists of the smallest set of axes - axial lines - covering the whole spatial system. Such representation forms the basis of the “syntactic model”, and it is on this basis that the syntactic analysis is performed,constituting an apparently abstract representation of how spatial systems are con fi gured. Although it is sometimes criticized as simplistic, or reductive, by excluding other urban or architectural features, phenomena and occurrences, focusing exclusively on the spatial con fi guration, it can be argued that syntactic representations are, on the contrary, extremely rich as they arguably embed aspects of the cognitive processing of spatial information.
Unlike the typical efforts of graphical representation of a physical reality (as in drawing or mapping), the syntactic representation does not aim at reproducing the metric and geometric properties. Instead, to a certain extent, it embodies the physical and visual experience of occupying the space, i.e. the continuity experienced by those who navigate the spatial network which is the urban environment. Thus, the axial map does not portray visual obstacles per se (such as buildings, trees, etc.), but rather the spatial network and its potential accessibility based on continued visual perception. In this way, rather than reductionist, space syntax representations are rich because they are not cognitively inert to the way the network of spaces (streets) is seen/experienced by the observer (user), leading to the creation of a configuration that the user might use to navigate. Syntactic representations can be described as “embodied diagrams”, as they re fl ect the bodily presence in the space.
Syntactic analysis is based on rigorous mathematical descriptions using a set of algorithms developed within the graph theory. The axial graph of an axial map is a graph in which the vertices or nodes correspond to the axial lines and two vertices are adjacent if and only if the corresponding axial lines intersect. The axial graph contains information about the connection of each axial line with all the others that constitute the system and allows to analyzing the relative position of each line in relation to all the other lines. In this way, the properties obtained do not vary with the individual conditions of each line,but with their position (topological) in the system where it is inserted.
Several syntactic measures have been created and tested by the space syntax community. The success of each measure was evaluated by its ability to re fl ect (correlate with) urban and architectural phenomena, such as pedestrian or motorized movement, type of land use, rent values.Regardless of its good performance in terms of linking the model to real measurable phenomena, the axial map has always made evident a mismatch with urban morphology in the sense that an axial line can extend over several blocks,which sometimes means very different from the point of view of comparative phenomena.The solution was to break the axial lines at their intersections. Thus, the segment map was born in the context of Space Syntax, being accepted today as the best way to represent the urban space. However, this creates a further problem:since the algorithms are based on the topological depth, when an axial line is transformed into segments, depth is generated, which has an undesirable effect on the results. The answer to this problem, most commonly used by the spatial syntax community, is the angular analysis of segments (Turner, 2001, Turner, 2007). This analysis calculates the ‘cost' of moving from one segment to the next, not in topological terms(where each segment implies an increment of cost), but in angular terms (for which larger angles correspond to higher costs). Thus, moving in the same direction has zero cost, i.e., the continuity of the axial line is simulated. The theoretical foundation for this procedure relates to the perception and navigation in urban environment,as mentioned above.
Of all the measures developed and tested by the spatial syntax community, two stand out for their ability to analyze urban con fi gurations: “Choice”and “itegration”. Choice (called “Betweenness Centrality” in graph theory) can be described as a measure of potential passing traf fi c and is measured by calculating the least cost (angular; accumulated change of direction) path between all possible origin/destination (OA) pairs (in which each element of the map/graph is considered as possible origin and destination. Those elements that cumulatively belong to the lowest cost paths between all source/destination pairs will most often present higher values of choice (note that this sum is then divided by the total number of possible trips). On the contrary, elements that cumulatively meet less frequently on the sum of all least cost paths will have lower choice values.
“Integration” (called “Closeness Centrality” in graph theory) is the second relevant measure for the analysis of urban configurations. It is a measure of the degree of centrality and usually emphasizes those spaces in the city that the common citizen would call the main streets, where a large part of specialized commerce is located,often associated with the functional concept of an urban centre. Typically, integration analysis was done on the axial map. However, since there would be an advantage in using this measure in the segment map, the algorithm used in the axial map had to be updated. As in the case of “choice”,when one moves from the analysis of the axial map to the analysis of the segment map, instead of “counting” the depth in topological terms, this is done in angular terms (where larger angles imply higher cost).
These two syntactic measures are also related to the concept of “natural movement”, i.e. the proportion of urban pedestrian movement determined by the grid con fi guration itself (Hillier et al. 1993) and allow allow establishing a parallelism between the value of ‘integration' of a space and its potential to be understood as a destination in random movements (to-movement) and between the value of ‘choice' and the probability of a space to be used as a crossing point in such journeys in which it is neither origin nor destination (through-movement).
With the aim of illustrating the use of spatial syntax methodology to explore how the expansion of the city can transform the potential of,the existing spatial structure, we study the city of Lisbon. The analysis follows a diachronic process, grounded on historical maps, back to the date when the old medieval city center -downtown - was massively destroyed by seismic activity, followed by a fire and a tsunami in 1755. Although the history of Lisbon extended many centuries before this earthquake, the eighteenth-century downtown reconstruction has generated some sort of “ground zero” clearing situation from the point of view of the spatial structure (Heitor et al. 1999). The pre-earthquake medieval grid was replaced by an orthogonal grid that rationally and pragmatically reordering the new ‘downtown' area. This structural grid remains almost intact up to now.
João Pinto Ribeiro, “Planta topográfica da Cidade de Lisboa arruinada também segundo o novo Alinhamento dos Architectos Eugénio dos Santos e Carvalho e Carlos Mardel”, (Topographic plan of the ruined city of Lisbon also under the new alignment of architects Eugénio dos Santos e Carvalho and Carlos Mardel) n.d., copy.The study has involved the ‘cartographic redrawing' of a set of eight maps of Lisbon published respectively in 1785, 1855, 1871, 1911, 1948,1970, 1997 and 2005 (updated by 2017) corresponding to distinct stages in the evolution of the city over a time span of about 230 years. These maps were decomposed into axial and segment maps thus allowing a spatio—temporal analysis of the evolution of the urban fabric by combining axial and segment angular analysis. Space Syntax Toolkit (Gil 2015) a front end to Depthmap(Turner 2004) was used to calculate, integration and choice patterns on global and local scales and to obtain a general picture of the city spatial centrality condition. These maps are colored on a scale ranging from blue to red, where blue represents the lowest values and red the highest values. The reading is done between the classes presented, according to Equal Interval classi fi cation Method.
Based on a visual inspection of the eight axial maps, i.e. in a qualitative rather than a quantitative approach, we show the generic ‘rules' of the urban growth process. Global scale analysis is used to represent the degree of convergence and dispersion of the urban grid. We then show some emergent properties of the contemporary urban form. Local-scale analysis at different radii is applied to grasp the local structure at the neighborhood scale. On this basis, we suggest a key clari fi cation of the generic structure of the city of Lisbon.
The Generic Rules of the Urban Growth Process
The 1785 map (Figure 2) shows the “downtown”orthogonal grid as the center, i.e., the most integrated zone of the urban grid (higher values of integration) and the strong level of segregation of the eastern zone corresponding to the old medieval districts, where the Castle is located.These observations are also significant from a methodological point of view. On the one hand the more integrated area does not correspond to the geometric center of the urban grid; on the other hand, the area around the castle is almost as central as the “downtown” but with higher levels of segregation. Similar levels of segregation are only reached at the western side of the grid, as the eastern side presents less topological distance to the center. Noted that the con fi guration of the river bank, in the form of a bay to the east of the downtown, does not allow a direct east-west link, which necessarily creates topological distance and therefore segregation. Also,note that within the “downtown” area there is a differentiation between the east-west axial lines and the north-south ones. The lower values of the east-west lines are a consequence of the lack of continuity and connection, which in this particular case is due to the topographic conditions.The 1855 map (Figure 3) follows a similar hierarchically pattern. The new connections that were established to the northeast of the city do not have significant implications in the spatial structure.
On the other hand, changes in the built fabric are clearly understandable on the 1871 map (Figure 4). A new embankment was immediately built to the west of the “downtown”, to prevent the river from fl ooding the adjacent area, and a new axis was opened along the riverfront. This new axis replaced the existing ones and created new and more directed connections to the north-south axes. This change produced a signi fi cant increase in the integration values of the western part of the urban grid. Although it may seem surprising,all integration values have slightly decreased(including all red lines) due to a significant change of the configuration without a proportional growth of the system. In simple terms, this phenomenon can be interpreted as a redistribution and dilution of the spatial integration of the whole system.
The 1911 map (Figure 5) shows for the fi rst time the hinterland penetration through the opening of two “arteries” perpendicular to the river,linking the downtown area to the northern and north-western peripheral zones, which turned out to be the symbol of a modern city, i.e., the modernization blueprint. These axes were laid out according to the physical landscape, following the city's two central valleys.
The densification of the urban tissue occurs through a set of interventions carried out around these two axes, pushing the integration core towards the north with strong links to the outside and giving shape to an emergent deformed grid.The expansion of the urban fabric to the west maintains a peripheral character, also translated by low values of integration, not imposing distinct impacts on the spatial con fi guration at that time.
The 1948 map (Figure 6) displays the northern expansion of the two structural south-north axes and shows how the integration core has grown to spread out along these axes, with strong links to the outside. The axis de fi ned in the North-Eastern valley becomes essential, being densely populated in the section near the city's center. However, its expansion became secondary in relation to that of the Northern valley, in the central area of the city.
The eastern and western expansion of the network, although peripheral, increased the integration level of the core (on the map seen as the red structure). From now on the key integrators shape like the rims of a deformed wheel pattern.However, due to the topography of the city,the long radials linking to those rims do not fully converge inward at a focal point to create a robust internal hub. The densification of the deformed grid entails the construction of new residential areas and is accompanied by the expansion of the network towards the north and northeast.
From now on the city entered a period of dynamic expansion which drove the development of strategic infrastructures. This growth included the opening of several “arteries” and the construction of residential areas and other facilities promoted by real estate developers and private builders as well as large-scale public operations,carried out from the 1940's up to 1970's.
The 1997 map (Figure 7) shows the increasing size of the urban fabric and the densi fi cation of the urban grid as well as the diversity of new urban grids. For the fi rst time, the “Downtown”area has substantially reduced its character of centrality. The global integration core has biased fi rst towards the north, then marginally fl oated to the west and east sides and further towards the northeast.
This pattern of expansion and relocation corresponds to “the paradox of centrality” as described by Hillier (1996) since the possibility of the effect of forming an edge to center links is limited by the presence of natural barriers.
As illustrated in the 2017 map (Figure 8), the main change that occurred after 1997 corresponds to the Northeast expansion of the built fabric, following the renewal of a derelict and deprived waterfront into a mix-used development which took place by the occasion of the World Exhibition (Expo 98). The exhibition area became the city's new meeting point and a promenade area. Nevertheless, it has a very insignificant contribution from the point of view of the spatial structure of the city as a whole. It does not entail a displacement or growth of the centre as already established since 1948.
The expansion of the urban fabric to the west maintains a peripheral character, also translated by low values of integration, not having a structural impact on the spatial configuration. This gradual densification process of the urban grid also reduces the segregation of the peripheral areas, while increases the levels of integration of the central core.
Although not significantly, the integration core increases in size and its structure is strengthened,shifting slightly to the north and substantially reducing the centrality of the downtown. However, there is a lack of structural continuation between the central core and the rest of the city,expressed by the lack of continuity between central and local axes connecting the urban grid in an articulated continuum.
Part 2: The Emergent Properties of the Urban Form
The diachronic analysis of these maps revealed that Lisbon's topological centrality evolved after the 18th-century earthquake from a somewhat irregular grid pattern to a more linear structure and deformed grid due to deeper hinterland penetration of two south-north axes built at the end of the 19th century. The northern expansion of the urban fabric, while promoting the South-North axes in detriment to the East-West ones and pushing the integration core towards the north had contributed to moving urban activity away from the waterfront districts. The South-North axes perform both as a landmark in the Lisbon urban transformation process and a support for the new city expansion developed along the 20th century. Despite the strategic character assumed by these structural axes, it seems that the city has evolved into a unique collage of various urban grids. The analysis of the local spatial structure of the current city map (2017 map) will con fi rm this assumption.
Local analysis can be done at various radii.For the purpose of this explanatory study, 80m,240m, 400m, 800m, 1200m and 2400m radii are used, corresponding to walking times as illustrated in Table 1. Hereafter the radii values will be referred to in time and not in distance.Figure 9 shows the “choice” values within 1-minute distance (r1). Note that, at this radius of analysis, only segments at the heart of the historic medieval districts have some degree of“choice”. These districts present a geometrically irregular structure, and the segment length (and block size) is smaller than average. Although r1 is not particularly useful from the standpoint of a typical syntactic analysis, it is interesting in this demonstrative context since it represents the potential of through-movement in particularly small journeys (80m). Considering such a narrow radius, all the segments with less than 160m length do not allow access beyond themselves.The only segments with some effective capacity to stand out for offering a differentiated level of accessibility (proximity or choice) correspond to segments with less than 160m in length. Simultaneously, given the nature of the analytical algorithms, the length is not the only determining factor, being the connectivity the key element.Thus, this radius will highlight segments of reduced dimensions but with signi fi cant connectivity. Obviously, this will occur more often in the older parts of the city, where the size of the block is smaller.
When the radius of analysis is changed to 3 minutes (240 meters,) the difference is obvious.Several districts present a signi fi cant level of integration at this scale (Figure 10). Also, some of them have a clearly de fi ned core. It should also be noted that other more recent districts in the northern area show a smaller degree of variation of integration, in spite of their significant integration values.
Figure 11 shows the values of “choice” at the same radius (3 min, 240 meters). Again, just the medieval districts contain segments that stand out in terms of their capacity to channel local fl ows of movement.
Let us now consider the potential of movement with a larger radius (radius 800m/10min) but still within the scale of these districts (Figure 12 and 13).
Once again, in terms of “choice”, the oldest districts stand out with a consistent spread of values (figure 12), but in terms of integration(Figure 13) they lose relevance. The emerging structure covers the older axes, positioned in the“downtown” area and in the immediately adjacent areas. This structure guarantees the linkage of the two central valleys. However, notice how the medieval districts now became signi fi cantly segregated, although their geographical location or connectivity did not change.
This analysis has previously supported that medieval districts have their own structure and a well-de fi ned hierarchy, which is visible at lower radii of analysis. However, it is noted that at a larger radius (even though still in walking distance) these features disappear (Figures 14 and 15 and 30-min radius).
The values of “choice” within a 30-min radius,excludes this area almost completely (Figure 14)from having potential for movement. Although the segregation of these areas becomes evident,it contrasts with their geographical centrality(Figure 15). It does not mean that the areas in question have lost any attribute, but the degree of segregation at larger radii means that they somehow lost their role as carriers of both to and through-movement, considering the whole urban network. The growth of the urban grid did not reinforce the connection to their nucleus, thus leaving them closed on themselves. This is a frequent phenomenon that can transform the urban fabric into an inarticulate set of small, almost exclusively, local realities. When the analysis is performed at larger radii, this is exacerbated.
At this stage, we shall clarify that this analysis aims to illustrate the methodology of spatial syntax and to highlight as much as possible of its role in urban planning and design. It is not argued that these neighborhoods should lose their segregation, or they should be transformed to have a structure that works at greater radii.Nevertheless, this analysis can be used to rethink their global integration condition while retaining their particular local features and advantages.Also, it should be noted that increasing integration levels would not necessarily imply the opening of direct axe from a central point of the urban grid, but could eventually be achieved through a set of small changes that redefined some alignements of visual and physical accessibility.
Figure 15 illustrates what can be considered the present center of Lisbon. The central core is almost completely dissociated from the rest of the city. There are axes of continuity supported by local structures that join the urban grid
in an articulated continuum. When compared with “choice” values (Figure 14), it is visible the prevalence of the south sections of the two structuring axes built at the beginning of the twentieth century as the through-movement elements. Along with greater accessibility/mobility at lower radii, this could explain the persistence of commercial activity in the downtown area while the prime area in terms of real estate has already moved up to the north, together with an increasing concentration of services, which has been led to a tendency for specialization around these areas.
A brief analysis of the Metropolitan Area of Lisbon (AML) clearly shows that its integration center is located in Lisbon, mostly coinciding with its integration center. However, as shown in Figure 16, in a local radius (15 min), a diversity of areas with a visible integration core arises, thus forming local centers. This reveals a decrease in the autonomy of Lisbon, suggesting that many of these local centers will have their own local urban life.
This map also highlights the city of Lisbon as the dominant local center. Figure 17 depicts the measurement of the global radius, showing the pathways with the greatest potential for to-movement. It should be noted how the lines highlighted coincide with AML's motorways and other structuring access. Also, at this level,Lisbon does not seem to present a particularly prominent position. However, a more detailed analysis allows one to detect that, unlike the other centers, these elements of choice of the global radius coincide with elements of choice at the local radius, as well as prominent elements of local and global radius integration. This spatial coincidence is a fundamental characteristic,revealing a very important factor for the functioning and resilience of urban agglomerations -synergy - achieved through the interconnection of: a) various types of movement, namely to and through-movement, respectively represented through the measures of integration and choice;b) various spatial ranges (radii) of each type of movement.
Final Remarks
This analysis relies exclusively on the city's configuration and highlights the city's primary structure as well as local substructures, main and local circulation axes which are directly related to the con fi guration itself. But this analysis per se has a limited utility. In fact, there is a lack of evidence, i.e., “real” measures of space usage have not yet been collected, which will allow to evaluating the practical aptitude of the syntactic(theoretical) model.
Cities cannot survive without an effective urban mobility system. Movement is absolutely critical to people's lives and is a key component of the livability and ef fi ciency of our cities today. The livability that most cities are striving for, and accordingly the health of the city's economy,is dependent on its ability to accommodate and manage mobility. To this end, urban designers can no longer afford to ignore how it interacts with the urban con fi guration.
When completed with empirical evidence, the syntactic analysis can inform short-term decisions with strategic medium- to long-term objectives. The identi fi cation of those segments with the greatest potential for channeling movement allows for the rectification of the urban configuration to respond, for instance, to the needs of commercial activity, which requires footfall.Also, if traf fi c fl ow should be kept low in a specific area, it is possible to achieve that through changes in the configuration. Similarly, knowledge of the theoretical potential of areas in terms of integration (and their use) allows planning and managing urban space in order to emphasize or mitigate this characteristic, whether or not it has implications for the functioning of the city. Moreover, the syntactic methodology also affords predicting the impact of changes to the configuration, which facilitates the implementation of both urban planning and urban design strategies.
