Lesson Eighty-five Electrocardiographic and electrophysiological characteristics of atrial tachycardia with early activation close to the his-bundle
2018-10-11童鸿
Atrial tachycardia(AT)with earliest activation in the area of the His-bundle,suggesting an origin from the superior paraseptal area of the atria,in the space delineated between the anterior supero-septal right atrium (RA),the anterior supero-septal left atrium(LA),and the noncoronary aortic cusp1(NCC),is relatively rare,and successfulablation hasbeen achieved from the NCC,the supero-septal aspect of the RA,posterior to the His-bundle,or from the antero-septal part of the LA.However,a specific P-wave morphology for this group of AT has not been described in the established ECG algorithms.Therefore,the aims of this study were(1)to determine the P-wave morphology in the 12-lead ECG and(2)to analyze the intracardiac electrograms in AT with earliest activation in the area of the His-bundle.
33 patients had AT with earliest activation in the region of the His-bundle constitute the population of the current study. They all underwent successful radiofrequency(RF)ablation.
Analysis of the 12-Lead Electrocardiogram
The 12-lead ECG during arrhythmia was obtained during the electrophysiological study,the morphology assessments were performed in all leads with a speed of 25 or 50 mm/s,and the timing measurements were done ataspeed of100 mm/s.In caseofT-wave superimposition,analysis of the P-wave was performed during periods of AV block or facilitated by ventricular pacing as previously described.P-wave duration and morphology in all 12-leads as well as the PR-interval were analyzed.The P-waves were assessed on the basis of the deviation from baseline and classified as positive(+),negative (-),flat,biphasic (-/+or+/-),and triphasic(+/-/+or-/+/-).All ECGs were evaluated by 3 experienced electrophysiologists.
Analysis of the Intracardiac Electrograms
During arrhythmia,the following parameters were assessed:
(1)the timing of the earliest atrial bipolar signal in the RA,in the aorta,and,when available,in the LA,with respect to the beginning of the P-wave in the surface ECG;
(2)the timing of the local bipolar signal at the successful ablation site with respect to the beginning of the P-wave(Fig 1);
(3)the difference between the atrial activation timing at the site of successful ablation and the bipolar atrial signal recorded in the His catheter.
General Electrophysiological Characteristics
During the electrophysiology study,sustained AT either started spontaneously or was induced with programmed and/or burst atrial pacing in 29 patients;in 4 patients despite pharmacologic provocation only frequent atrial premature contractions (PACs) were induced.The cycle length of the AT was 460±88(range 360-670)milliseconds.Among the patients with AT,AV conduction was 1:1 in 23 cases,and in 6 there was a Wenckebach periodism2.The tachycardia was not inducible by ventricular stimulation,and there was no evidence of an accessory pathway in any patient.In 23 patients,the NavX system (St.Jude Medical Inc.)and in 10 patients,the LocaLisa system(Medtronic Inc.)was used for mapping.
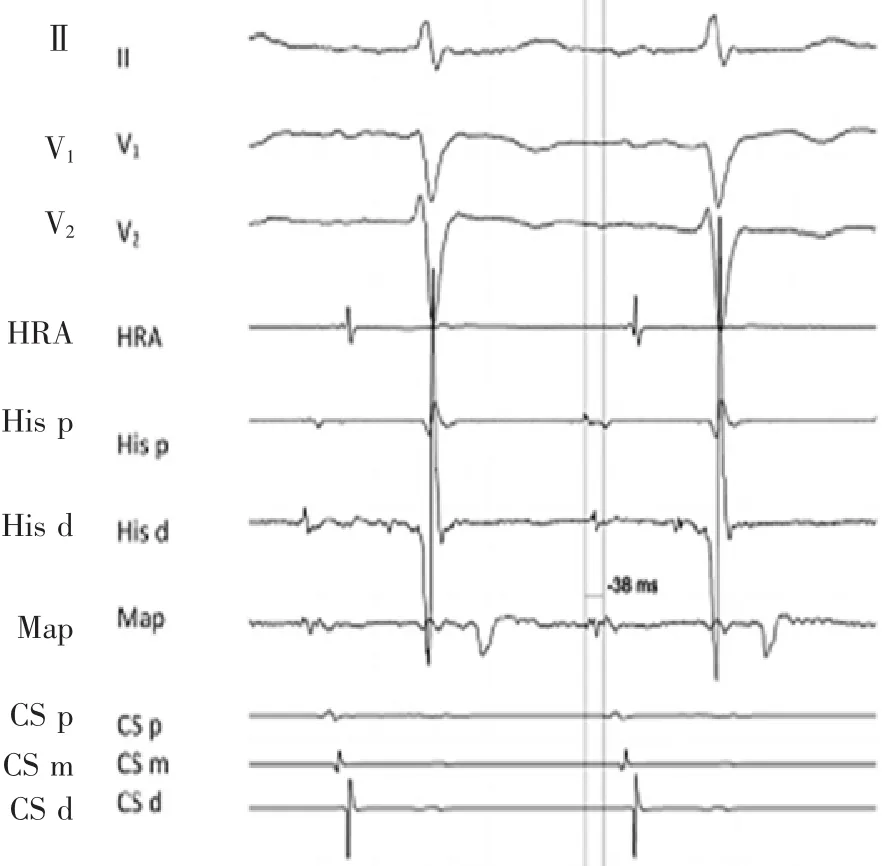
Figure 1 Intracardiac electrograms during para-Hisian AT.Tracings are ECG leadsⅡ,V1,V2,and intracardiac electrograms recorded from a mapping catheter at the NCC,a catheter at the high right atrium,a catheter at the His-bundle,and a catheter within the coronary sinus during para-Hisian AT.
12-Lead Electrocardiogram Characteristics
In all patients,the P-wave during AT/PACs was significantly shorter compared to the sinus rhythm(87±18 vs.117±23 milliseconds,P<0.001).In patients with 1∶1 AV conduction,the PR-interval during tachycardia was significantly shorter than in sinus rhythm(131±37 vs.170±47 milliseconds,P<0.01).
Examples of the P-wave morphology during tachycardia are shown in Figure 2.The most prominent features were a narrow P-wave and biphasic(-/+,n=23) or triphasic (+/-/+,n=5) morphology in the precordial leads,particularly in V4-V6,and a biphasic(-/+,n=13;40%) ortriphasic (+/-/+,n=12)morphology in the inferior leads.In aVR,a biphasic(+/-)aspect was observed in 18 patients and a triphasic(-/+/-) P-wave morphology in 5.Furthermore,P-waves were biphasic(-/+)in both the inferior and in the precordial leads in 11 patients,whereas in 8 patients they were biphasic(-/+)in the precordial and triphasic(+/-/+)in the inferior leads,and in 5 patients they were triphasic(+/-/+)in both the inferior and the precordial leads.Leads I,aVL,and V1were not useful to characterize the pattern.
Although these distinctive P-wave characteristics were reliably associated with earliest activation in the region of the His-bundle,they did not accurately identify the exact successful ablation site(e.g.,right vs.left atrial septum vs.noncoronary cusp).
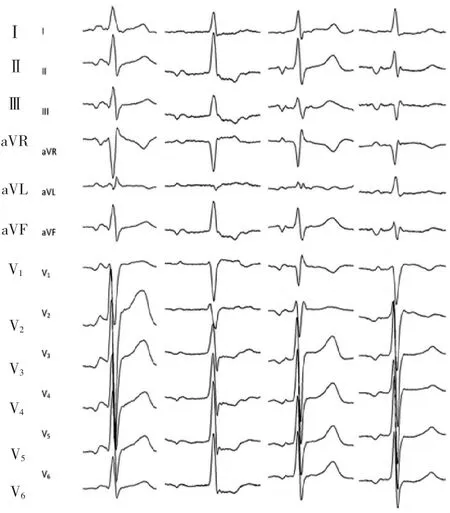
Figure 2 Representative examples of the P-waves morphology during para-Hisian AT.The 2 cases on the left have the characteristic narrow P-wave and biphasic(-/+)aspect in the precordial and inferior leads.On the right,2 examples of a triphasic (+/-/+) P-wave morphology in the inferior leads are shown.
Characteristics of the Intracardiac Electrograms and Catheter Ablation
The atrial bipolar signal preceded the P-wave by 31± 12(range 12-54),37±10(range 22-50)and 39±11 (range 28-60)milliseconds in the supero-septal aspect of the RA,in the aorta and in the antero-septal aspect of the LA,respectively(Fig.3).The difference in the earliest activation time between the 3 chambers was not significant.However,activation mapping during AT wasperformedintheLAinonly8patients.
During AT/PACs,the atrial potential at the site of successful ablation preceded the beginning of the P-wave by a mean of 38±11 (range 10-60)milliseconds and atrial activation at the His-bundle by 8± 6(range 0-22)milliseconds.
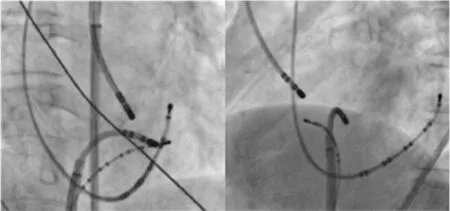
Figure 3 Fluoroscopic images during mapping of both the right and left side of the interatrial septum and the aortic root.Right(30°,left panel)and left(50°,right panel)anterior oblique radiographic views show a multipolar catheter inside the coronary sinus,a multipolar catheter at the His-bundle,a mapping catheter in the noncoronary aortic sinus,a mapping catheter at the left antero-septalaspectofthe interatrial septum.
The site of successful ablation was:NCC in 24 patients;antero-septalin theLA in 4 patients;superoseptal in the RA in 3 patients;left coronary cusp in the patient with a bicuspid aortic valve and between the right coronary cusp and the NCC in 1 patient.
The initial ablation site was guided by the earliest activation.If there was no difference in the activation time between the supero-septal RA or the antero-septal LA and the aorta,ablation was started in the aorta because of the presumed lower risk of AV block.
In 26 patients,the site of earliest activation corresponded with the site of successful ablation:RF application in the aorta eliminated the AT/PACs in 24 cases(5 patients with similar activation times in the aorta and in the RA),and in the antero-septal LA in 2 cases.In 2 cases with similar activation timing in the aorta and supero-septal RA and in the aorta and in the antero-septal LA,respectively,RF application in the RA and in the LA was needed to eliminate the AT after unsuccessful ablation in the aorta.
In 3 patients,despite earliest activation in the aorta,RF application here was not successful,and ablation on the right side of the septum in 2 cases and on the left side in 1 case was required.In 1 patient,despite earliest activation at the left septum(44 milliseconds earlier than the P-wave),ablation was not successful here,and RF application in the aorta(43milliseconds earlier than the P-wave) eliminated the AT.In another patient,the earliest activation was observed at the right septum(42 milliseconds in front of the P-wave);however,RF application here did not eliminate the AT but caused first degree AV block,and additional ablation in the aorta(38 milliseconds in front of the P-wave)eliminated the AT.
Main Findings
The present study represents one of the largest experiences in patients with focal AT and earliest activation at the His bundle undergoing successful ablation.The principal findings of the study are that(1)this kind of AT shows a very characteristic narrow and biphasic(-/+)or triphasic(+/-/+)P-wave morphology in the precordial leads,especially in V4 to V6,and in the inferior leads;(2)because the activation of the para-Hisian RA,the antero-septal LA and the NCC is almost simultaneous,the P-wave morphology reliably identifies a para-Hisian origin but it does not predict the successful ablation site(i.e.,NCC vs.either side of the interatrial septum).
Anatomical Considerations
The propagation of atrial depolarization and the resulting P-wave morphology of AT with earliestactivation close to the His-bundle are directly related to the complex anatomical configuration of the paraseptal region,with the aortic root centrally located and the NCC abutting the superior paraseptal region between the RA and the LA (Fig.4).As shown by Yanni et al.,groups of cells of conduction tissue are located within the AV junction as well as in the right and left paraseptal region,immediately dorsal to the aortic root.Although their function is not yet clarified,this structure is probably originating from the(inferior)extension of the AV node and,intriguingly,AT originating from this region present"nodal-like"response3.
During para-Hisian AT,the activation area within the first milliseconds of atrial depolarization is a diffuse zone in the superior paraseptal area of the atria,and activation occurs almost simultaneously on both sides of the septum.Thus,it is unlikely that such a diffuse initial activation,involving the aorta,the right and the left atrium,occurs by the conduction of an impulse across the interatrial septum,with the focus located in one of these structures.Most likely,this activation pattern suggests propagation from an intermediate focus located epicardially in the paraseptal region,between the aorta,the right and the left atrium.
Based on these considerations and on those of previous studies,ATs arising from the supero-septal RA as well as from the NCC,the antero-septal LA or mitro-aortic continuity may all represent the same entity.Therefore,it would seem to be more appropriate to define them in a nonequivocal way as para-Hisian AT or AT with early activation close to the His-bundle because the universal finding is earliest activation in the region where a His-bundle potential is registered.
词 汇
delineate v.描绘,描述,刻画,绘出…的轮廓
constitute v.组成,构成,设立,制定
superimposition n.叠加,叠置,被覆
biphasic adj.双相的,两阶段的
triphasic adj.三相的,三个阶段的
sustain v.支撑,支持,支援,维持,供养
millisecond n.毫秒
prominent adj.突起的,引人注目的,突出的,杰出的
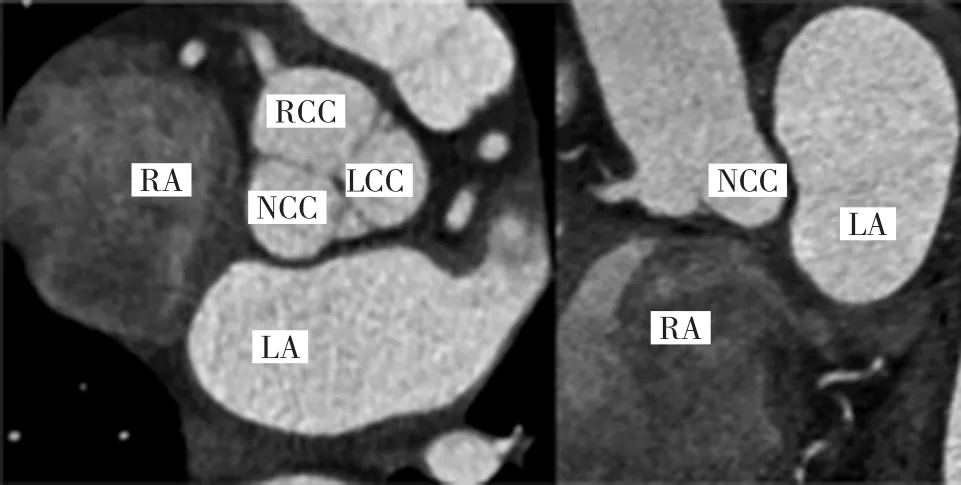
Figure4 Computed tomography scan of right and left atria and of the aortic root.The para-Hisian region lies between the right and left interatrial septum and the aortic root,in particularthe noncoronary aortic cusp.The anatomical scan shows the close relationship between these 3 structures.On the left panel a sagittal and on the right one an axial view is showed.
distinctive adj.特殊的,特别的,区别性的
interatrial adj.心房之间的
abut v.邻接,与…邻接,使…紧靠
nonequivocal adj.无疑的,无歧义的,确定的
注 释
1.cusp是通常译成“尖,尖点,牙尖”,如bicuspid二尖的,tricuspid三尖的,但也可以解释为“窦”,如本文中的“noncoronary aortic cusp”即指“无冠窦”,right coronary cusp 右冠窦,left coronary cusp左冠窦。
2.Wenckebach periodism译成“文氏周期现象”,因心脏传导系统某个部位传导功能下降,表现为传导逐渐(搏)减慢,最后传导中断。医学文献中通常用Wenckebach phenomenon表达传导的文氏现象。
3.nodal-like response...译成“结样反应”,是指反应特性类似房室结,如:受迷走神经影响;快频率依赖传导文氏现象;倍他受体阻断剂和异搏定可延缓及阻滞传导;纵向分离特性。
参考译文
第85课最早激动紧邻希氏束的房性心动过速心电图和电生理特征
最早激动位于希氏束区的房性心动过速,起源于心房间隔旁区上方,即位于前上间隔右心房侧、前上间隔左心房侧和主动脉无冠窦之间的空间,相对罕见,已有经主动脉无冠窦、右心房上间隔、希氏束后方、或左心房前间隔的成功消融。然而,在现有的心电图诊断规则上,缺乏有关这组房性心动过速特异P波形态的阐述。因此,本研究的目的是:(1)确定12导联心电图上的P波形态;(2)分析最早激动位于希氏束区的房性心动过速的腔内电图。
33例最早激动位于希氏束区的房性心动过速患者构成了本研究的人群,他们均成功实施了射频消融术。
12导联心电图分析
电生理检查过程中获取心律失常发作时的12导联心电图,对所有导联进行形态分析,走速25 or 50 mm/s,而时间测定时的走速为100 mm/s。当存在T波重叠时,于房室传导阻滞时,或通过以前描述的心室起搏方法协助分析P波。分析所有12导联上的P波间期、形态以及PR间期。根据偏离基线情况判读P波,分为正向波(+)、负向波(-),平直、双相波(-/+或+/-),和三相波 (+/-/+或-/+/-)。所有心电图由三位有经验的电生理专家评估。
腔内电图分析
心律失常期间对以下参数进行分析:
(1)右心房、主动脉,有可能左心房中最早心房双极信号到体表心电图P波起始的时间;
(2)消融成功部位局部双极信号到P波起始的时间(图1);
(3)成功消融部位心房激动时间与希氏束电极记录到的双极心房信号之间的时差。
总体电生理特征
电生理检查期间,29例发生自发的或程控或触发心房起搏诱发的持续性房性心动过速;4例患者在药物激发下只能诱发出频发的房性期前搏动。房性心动过速的周长为460±88(360~670)ms。房性心动过速患者中,23例呈1∶1房室传导,6例呈文氏周期现象。心室刺激不能诱发心动过速,均无旁道迹象。23例采用NavX系统标测 (St.Jude Medical Inc.),10 例采用 LocaLisa系统标测(Medtronic Inc.)。
12导联心电图特征
所有患者房性心动过速或房性期前收缩时的P波时程显著短于窦律P波时程[(87±18)ms vs.(117±23)ms,P<0.001].1∶1房室传导的患者,心动过速时的PR间期显著短于窦性心律的[(131±37)ms vs.(170±47)ms,P<0.01]。
心动过速氏的P波图例见图2。最突出的特征是胸导联特别是 V4~V6,P 波狭窄并呈双相(-/+,n=23)或三相(+/-/+,n=5)图形,下壁导联呈双相(-/+,n=13)或三相(+/-/+,n=12)图形。18例见到aVR双相(+/-)P波,5例见到三相(-/+/-)P波。此外,11例下壁和胸导联均见到双相(-/+)P波,而8例胸导联呈双相(-/+)P波,下壁导联呈三相(+/-/+)P波,5例下壁导联和胸导联均呈三相(+/-/+)P波(见图3)。Ⅰ、aVL和V1无助于描述图形特征。
虽然这些特征的P波与希氏束区的最早激动明确相关,但它们不能精确定位实际的成功消融部位(即右心房间隔、左心房间隔和无冠窦)
腔内电图特征和导管消融
右心房上间隔部位、主动脉窦部位和左心房前间隔部位的心房双极信号较P波提前程度分别为31±12(12~54),37±10(22~50)和 39±11(28~60)ms(图 3)。3 个腔室之间的最早激动时间差异不明显。然而,在左心房进行房性心动过速激动标测的只有8例。
房性心动过速/心房期前收缩期间,成功消融部位的心房电位较P波起始提前平均38±11(10~60)ms,而较希氏部位心房激动提前8±6(0~22)ms。
成功消融部位:无冠窦24例,左心房前间隔4例,右心房上间隔3例,主动脉二叶瓣的左冠窦1例,右冠窦与无冠窦之间1例。根据最早激动确定最初消融部位。当右心房上间隔或左心房前间隔与主动脉窦之间的激动时间无异时,从主动脉窦开始消融,因为常认定该部位发生房室阻滞的风险较低。
26例最早激动与成功消融部位相一致:24例于主动脉窦射频消融消除房性心动过速/房性期前收缩(其中5例主动脉窦与右心房的激动时间相似),2例位于左心房前间隔。有2例主动脉窦与右心房上间隔、主动脉窦与左心房前间隔之间的激动时间类似,在主动脉窦消融失败后,需在右心房和左心房射频消融消除房性心动过速。
3例尽管最早激动位于主动脉窦,射频消融无效,需行间隔右侧(2例)和间隔左侧(1例)消融。1例尽管最早激动位于左间隔(较P波提前44ms),此处消融失败,于主动脉窦(较P波提前43ms)消除房性心动过速。另1例最早激动在右间隔(较P波提前42ms),但此处射频消融不能消除房性心动过速,却导致一度房室传导阻滞,外加主动脉窦消融(较P波提前38ms)消除房性心动过速。
主要发现
本研究是目前对局灶性房性心动过速且最早激动位于希氏束的患者实施成功消融的最大经治之一。主要发现如下:(1)这一类型的房性心动过速表现为胸导联、特别是V4~V6,和下壁导联上非常特征的狭窄且双相(-/+)或三相(+/-/+)P波图形;(2)由于右心房希氏束旁,左心房前间隔和无冠窦几乎同时激动,P波形态能可靠鉴别希氏束旁起源,但不能预测成功消融部位(即无冠窦或房间隔两侧)。
解剖考量
最早激动接近希氏束的房性心动过速的除极传导及所导致的P波形态与间隔旁区的复杂构形直接相关,主动脉根部位于中心,无冠窦邻接左右心房之间的上间隔旁区(图4)。正如Yanni等研究表明,集群的传导组织细胞位于房室交接区以及左右侧间隔旁区,紧挨主动脉根部背侧。虽然它们的功能尚未明晰,这一结构可能源于房室结的向下延伸,令人惊奇的是该区域起源的房性心动过速呈现“结样”反应。
在希氏束旁区房性心动过速发作时,最初几秒内的激动区域是位于心房上间隔旁区的弥漫区带,间隔的两侧几乎同时发生激动。因此,这种弥漫的初始激动,涉及主动脉与左右心房,不太可能由位于这些结构之一处的起搏点,通过跨房间隔传导而发生。
最有可能的是这种激动模式表明传导来自位于心外膜主动脉与左右心房之间的间隔旁区的中间点。基于这些考量以及既往的研究,源于右心房上间隔以及无冠窦、左心房前间隔或二尖瓣-主动脉连接处的房性心动过速可能都代表同一实质。因此,将它们定义为希氏束旁房性心动过速或最早激动接近希氏束的房性心动过速较为恰当,因为普遍的表现是最早激动的区域即是标测到希氏束电位的部位。
图1 希氏束旁房性心动过速时的心腔内电图 描记的是希氏束旁房性心动过速时体表Ⅱ、V1、V2心电图和分别由位于无冠窦的标测电极和高位右心房、希氏束及冠状窦内电极记录到的腔内电图。
图2 希氏束旁房性心动过速时P波形态图例 左侧2例显示胸导联和下壁导联特征性窄而负正双相的P波。右侧2例显示下壁导联负正负三相P波。
图3 房间隔左、右侧和主动脉根部标测时的X线图像右前斜位(30°)和左前斜位(50°)X线透视显示一根多极电极位于冠状窦内,一根多极电极位于希氏束,一根标测电极位于无冠窦,一根标测电极位于房间隔的左前隔面。
图4 左右心房和主动脉根部CT图像 希氏束旁区位于左右心房间隔和主动脉根部,特别是无冠窦之间。解剖扫描显示此三种结构的紧密关系。左列是矢壮面观,右列是轴位观。
