Role of Microphysical Parameterizations with Droplet Relative Dispersion in IAP AGCM 4.1
2018-01-09XiaoningXIEHeZHANGXiaodongLIUYiranPENGandYangangLIU
Xiaoning XIE,He ZHANG,Xiaodong LIU,Yiran PENG,and Yangang LIU
1State Key Laboratory of Loess and Quaternary Geology,Institute of Earth Environment,Chinese Academy of Sciences,Xi’an 710061,China
2International Center for Climate and Environment Sciences,Institute of Atmospheric Physics,Chinese Academy of Sciences,Beijing 100029,China
3University of Chinese Academy of Sciences,Beijing 100049,China
4Ministry of Education Key Laboratory for Earth System Modeling,Center for Earth System Science,and Joint Center for Global Change Studies(JCGCS),Tsinghua University,Beijing 100084,China
5Environmental and Climate Sciences Department,Brookhaven National Laboratory,Upton,New York 11973-5000,USA
Role of Microphysical Parameterizations with Droplet Relative Dispersion in IAP AGCM 4.1
Xiaoning XIE∗1,He ZHANG2,Xiaodong LIU1,3,Yiran PENG4,and Yangang LIU5
1State Key Laboratory of Loess and Quaternary Geology,Institute of Earth Environment,Chinese Academy of Sciences,Xi’an 710061,China
2International Center for Climate and Environment Sciences,Institute of Atmospheric Physics,Chinese Academy of Sciences,Beijing 100029,China
3University of Chinese Academy of Sciences,Beijing 100049,China
4Ministry of Education Key Laboratory for Earth System Modeling,Center for Earth System Science,and Joint Center for Global Change Studies(JCGCS),Tsinghua University,Beijing 100084,China
5Environmental and Climate Sciences Department,Brookhaven National Laboratory,Upton,New York 11973-5000,USA
Previous studies have shown that accurate descriptions of the cloud droplet effective radius(Re)and the autoconversion process of cloud droplets to raindrops(Ar)can effectively improve simulated clouds and surface precipitation,and reduce the uncertainty of aerosol indirect effects in GCMs.In this paper,we implement cloud microphysical schemes including two-moment Arand Reconsidering relative dispersion of the cloud droplet size distribution into version 4.1 of the Institute of Atmospheric Physics’s atmospheric GCM(IAP AGCM 4.1),which is the atmospheric component of the Chinese Academy of Sciences’Earth System Model.Analysis of the effects of different schemes shows that the newly implemented schemes can improve both the simulated shortwave and longwave cloud radiative forcings,as compared to the standard scheme,in IAP AGCM 4.1.The new schemes also effectively enhance the large-scale precipitation,especially over low latitudes,although the inf l uences of total precipitation are insignificant for different schemes.Further studies show that similar results can be found with the Community Atmosphere Model,version 5.1.
relative dispersion,effective radius,autoconversion process,global climate models
1.Introduction
GCMs have suffered from large uncertainties in their representation of aerosol indirect effects and tend to overestimate the cooling of aerosol indirect forcing according to IPCC(2007,2013).Reducing this uncertainty and reconciling GCMs with observations remain major and ongoing challenges despite several decades of research(e.g.,Anderson et al.,2003;Quaas et al.,2006;IPCC,2013).Previous studies have shown that accurate descriptions of the cloud droplet effective radius(Re)and the autoconversion process of cloud droplets to raindrops(Ar)can effectively improve simulated clouds and surface precipitation and reduce the uncertainty of aerosol indirect effects in GCMs(Boucher et al.,1995;Lohmann and Feichter,1997;Liu and Daum,2002,2004;Rotstayn and Liu,2003,2005;Liu et al.,2007;Xie and Liu,2009).
Cloud droplet relative dispersion(ε),defined as the ratio of the standard deviation to the mean droplet radius,increases with an increasing cloud droplet number concentration due to increasing anthropogenic aerosols,because the larger number of small droplets formed in polluted clouds compete for water vapor and broaden the droplet size distribution,as compared with clean clouds having fewer droplets and less competition(Liu and Daum,2002).This enhanced ε reduces the changes induced by aerosols in the Reand the liquid water path,exerts a warming effect,and in turn partly offsets the cooling of aerosol indirect radiative forcing(Liu and Daum,2002;Xie et al.,2017).Hence,parameterizations of Reand Arconsidering the dispersion effect have been proposed to investigate aerosolindirecteffects(Liu and Daum,2002,2004;Peng and Lohmann,2003;Rotstayn and Liu,2003;Liu et al.,2007,2008;Xie and Liu,2009,2013).Liu and Daum(2002)related Reto ε and further parameterized ε in terms of an empirical relationship with clouddropletnumberconcentrationandshowedthatthemagnitude of aerosol indirect radiative forcing can be reduced significantly when considering the dispersion effect.Implementation of this parameterization of Rewith ε into various GCMs,including CSIRO Mk3.0(Rotstayn and Liu,2003)and ECHAM4(Peng and Lohmann,2003),largely confirmed the results reported by Liu and Daum(2002).The Ardetermines the onset of the surface precipitation associated with warm clouds,and its parameterization has always attracted much attention.In recent years,one-moment mass content schemes(e.g.,Planche et al.,2015;Lee and Baik,2017)and two-momentmasscontentanddropletconcentrationschemes(e.g.,Sednev and Menon,2012;Kovaˇceviˇc and´Curi´c,2014;Michibata and Takemura,2015)of autoconversion have been applied to numerical models of different scale.Additionally,Liu and Daum(2004)developed an analytical autoconversion rate for mass content that accounts explicitly for ε using the generalized mean value theorem of integrals into the general collection equation.Extension of this theoretical expression to include the autoconversion threshold and autoconversion rate for cloud droplet number concentration were derived by Liu et al.(2006,2007)and Xie and Liu(2009).The parameterization of Arin mass content with ε has been used in CSIRO Mk3.0(Rotstayn and Liu,2005)and in the Weather Research and Forecasting model(Xie and Liu,2011,2015;Xie et al.,2013).Recently,cloud microphysical schemes with two-moment Arand Rewith ε have been successfully implemented into the Community Atmosphere Model,version 5.1(CAM5.1),significantly reducing the aerosol indirect forcing—especially over the Northern Hemisphere(Xie et al.,2017).
The latest version(version 4.1)of the IAP’s AGCM(IAP AGCM 4.1),which is also the atmospheric component of the Chinese Academy of Sciences’Earth System Model,is described in Zhang et al.(2013)and Lin et al.(2016).IAP AGCM 4.1 adopts a physical package with a two-moment bulk stratiform cloud microphysics scheme from CAM5.1,as described by Morrison and Gettelman(2008),but has a different dynamical core(Zhang et al.,2009,2013).Although the CAM5.1 microphysics schemes consider the dispersion effect on Rewith different expression from Liu and Daum(2002),they do not include the dispersion effect on the Ar(Xie et al.,2017).Hence,a cloud microphysical scheme including two-moment Arand Reschemes with ε is implemented in IAP AGCM 4.1,following Xie et al.(2017)for CAM5.1.To demonstrate the superiority of the new schemes,we evaluate the performance and improvement of IAP AGCM 4.1 by comparing results with observations and CAM5.1 simulations—in particular,for cloud shortwave and longwave radiative forcings(SWCF and LWCF,respectively)and surface precipitation.
This paper is an extension to the preliminary study of Xie et al.(2017)and is structured as follows:Section 2 describes the inclusion of the two-moment Arand Rewith ε in the cloud microphysicsofIAPAGCM4.1,alongwiththeconfiguration of the simulation experiments.Section 3 evaluates the simulated cloud fields and surface precipitation in IAP AGCM 4.1 with different cloud schemes against observations and CAM5.1 results.The main conclusions and further discussion are presented in section 4.
2.Model and simulations
2.1.Description of IAP AGCM 4.1
IAP AGCM 4.1 can reproduce the observed climatology in a generally successful manner(Sun et al.,2012;Yan et al.,2014;Lin et al.,2016).It is a global grid-point model using a finite-difference scheme with a terrain-following σ coordinate.Its horizontal resolution is approximately 1.4°×1.4°and it has 30 vertical levels with a model top at 2.2 hPa.The dynamical core of IAP AGCM 4.1 is described in detail by Zhang et al.(2009,2013).The physical processes in IAP AGCM4.1 mostly derive from the CAM5(Neale et al.,2010),including a two-moment bulk stratiform cloud microphysics scheme coupled with a three-mode version of the modal aerosol model,which enables the investigation of aerosol direct and semi-direct effects,as well as indirect effects(Morrison and Gettelman,2008;Ghan et al.,2012;Liu et al.,2012).Parameterizations of all microphysical processes(Morrison and Gettelman,2008)are adopted in this model,including the activation of cloud condensation nuclei or nucleation on ice nuclei to form cloud droplets or cloud ice,condensation/deposition,evaporation/sublimation,autoconversion of cloud droplets and ice to form rain and snow,accretion of cloud droplets and ice by rain,accretion of cloud droplets and ice by snow,heterogeneous freezing of cloud dropletstoformice,homogeneousfreezingofclouddroplets,sedimentation,melting,and convective detrainment.The autoconversion process is parameterized by Khairoutdinov and Kogan(2000),which we refer to as the KK parameterization.
2.2.Newly implemented parameterizations for Reand Ar
The Reis parameterized via the following expression based on the assumption of the cloud droplet size distribution following a gamma distribution(Liu and Daum,2002;Xie et al.,2013):
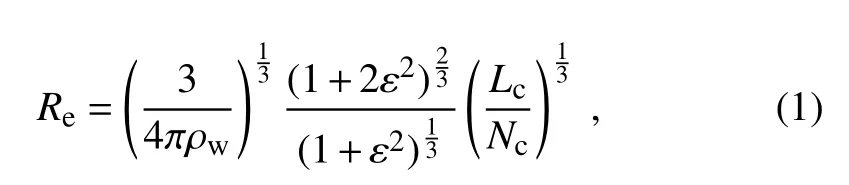
where Lc(g cm−3)and Nc(cm−3)represent the liquid water mass content and cloud droplet number concentration for clouds,respectively;and ρwis the density of liquid water.The two-moment scheme of Arwith ε can be easily derived from the analytical formulas(Xie and Liu,2009).The number and mass autoconversion rates(PNand PL,respectively)can be written as
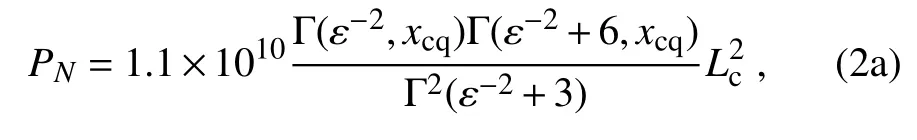
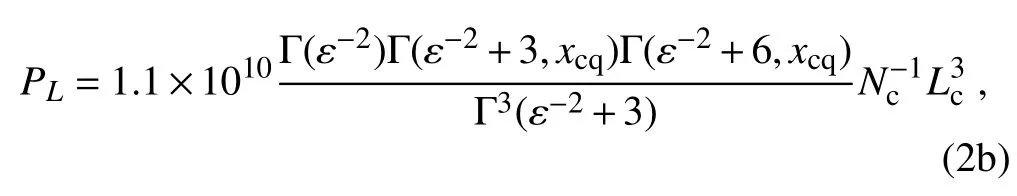
where

The Gamma function and the incomplete Gamma function can be represented as the following two formulas:Γ(n)=andrespectively.The PNand PLboth increase with Lcand ε,but decrease with Nc(Liu et al.,2007;Xie and Liu,2009).The above cloud microphysical schemes of Reand two-moment Arhave been successfully implemented in CAM5.1(Xie et al.,2017).Here,we implement these cloud schemes into IAP AGCM 4.1,where the Rotstayn–Liu relationship of ε=1−0.7exp(−0.003Nc)is adopted in our model(Rotstayn and Liu,2003)instead of the default relationship of ε=0.0005714Nc+0.271(Morrison and Gettelman,2008).The default relationship is based on a small number of measurements(ε=0.43 for “polluted continent”and ε=0.33 for “clean ocean”),whereas the Rotstayn–Liu relationship is derived from more measurements,as described by Liu and Daum(2002).Note that the KK parameterization is fitted by applying the least-squares method based on the results from a large-eddy simulation,which does not include the ε.However,our autoconversion parameterizations with ε are analytically derived by applying the generalized mean value theorem for integrals to the general collection equation(Xie and Liu,2009).These autoconversion parameterizations used here are more reliable physically,and have been extended from one-moment(Liu and Daum,2004)to twomoment schemes(Xie and Liu,2009).
2.3.Configuration of simulations
We run IAP AGCM 4.1 for the years 1979–2005 with historical sea-ice concentrations and SST derived from Hurrell et al.(2008),and with historical greenhouse gases and anthropogenic aerosol emissions(Lamarque et al.,2010).Natural aerosols including sea salt and dust are predicted during this period.To examine the inf l uences of the different cloud microphysical schemes on cloud microphysical fields and surface precipitation,two numerical experiments are performed—one with the standard and one with the new cloud microphysical schemes.The standard experiment(STANDARD)uses the default cloud microphysical scheme of IAP AGCM 4.1;the new experiment(NEW)is conducted by using the complete cloud schemes of Re(1)and two-moment Ar(2)with the Rotstayn–Liu relationship between ε and the cloud droplet concentration.
3.Results
Annual simulated global-mean cloud microphysical properties,surface precipitation and aerosol optical depth(AOD)from IAP AGCM 4.1(STANDARD and NEW)and corresponding observations are shown in Table 1,including the vertically integrated cloud droplet number concentration(CDNUMC),liquid water path(LWP),ice water path(IWP),Reatcloudtop(REL),totalcloudamount(CLDTOT),low cloud fraction(CLDLOW),middle cloud fraction(CLDMID),high cloud fraction(CLDHGH),cloud optical thickness(COT),SWCF,LWCF,total precipitation(large-scale+convective precipitation;PRECT),and AOD.The global annual mean values of CDNUMC are 1.24×10¹⁰m−2from STANDARD and 1.16×10¹⁰m−2from NEW—both significantly smaller than that based on AVHRR satellite observation(4.01×10¹⁰m−2)from an area between 50°S and 50°N reportedby Hanetal.(1998).TheunderestimatedCDNUMC can be partly explained by the fact that the CDNUMC in CAM5.1 only includes a contribution from stratiform clouds(Wang et al.,2011).The CDNUMC from NEW is smaller than that from STANDARD because of the larger autoconversion efficiency in the former,especially at low levels over low latitudes,due to higher cloud liquid water content(Fig.1).The simulated LWP from NEW is as 39.03 g m−2,which is much lower than that from STANDARD(50.14 g m−2).This also results from the changes in the autoconversion effi-ciency.STANDARD and NEW share a similar global annual mean IWP(18.62 g m−2and 18.60 g m−2,respectively).The REL in NEW is 12.40µm,falling within the observational range from 11.4µm to 15.7µm(Han et al.,1998;Platnick et al.,2003).The REL is 9.86µm in STANDARD,which is much lower than in NEW and observations.The simulated CLDTOT(66.63%)in NEW is larger than that(63.84%)in STANDARD,which just falls within the observational range from 65%to 75%based on ISCCP,MODIS and HIRS data(Rossow and Schiffer,1999;Platnick et al.,2003;Wylie et al.,2005).The increased CLDTOT in NEW is mainly due to the increased high cloud fraction.This is because that the autoconversion rate in NEW is significantly decreased compared to that in STANDARD at high levels,due to lower cloud water content(Fig.1),resulting in a larger high-cloud fraction.The COT is significantly decreased from 13.34 in STANDARD to 9.28 in NEW,resulting from the decreased LWP in the latter.

Table 1.Annual global mean cloud microphysical properties,precipitation and aerosol optical properties from IAP AGCM 4.1(STANDARD and NEW)and observations(see the opening paragraph of section 3 for definitions of the various properties).Differences in the properties between NEW and STANDARD(NEW minus STANDARD)are also shown.Values in brackets are the standard deviations of the properties.
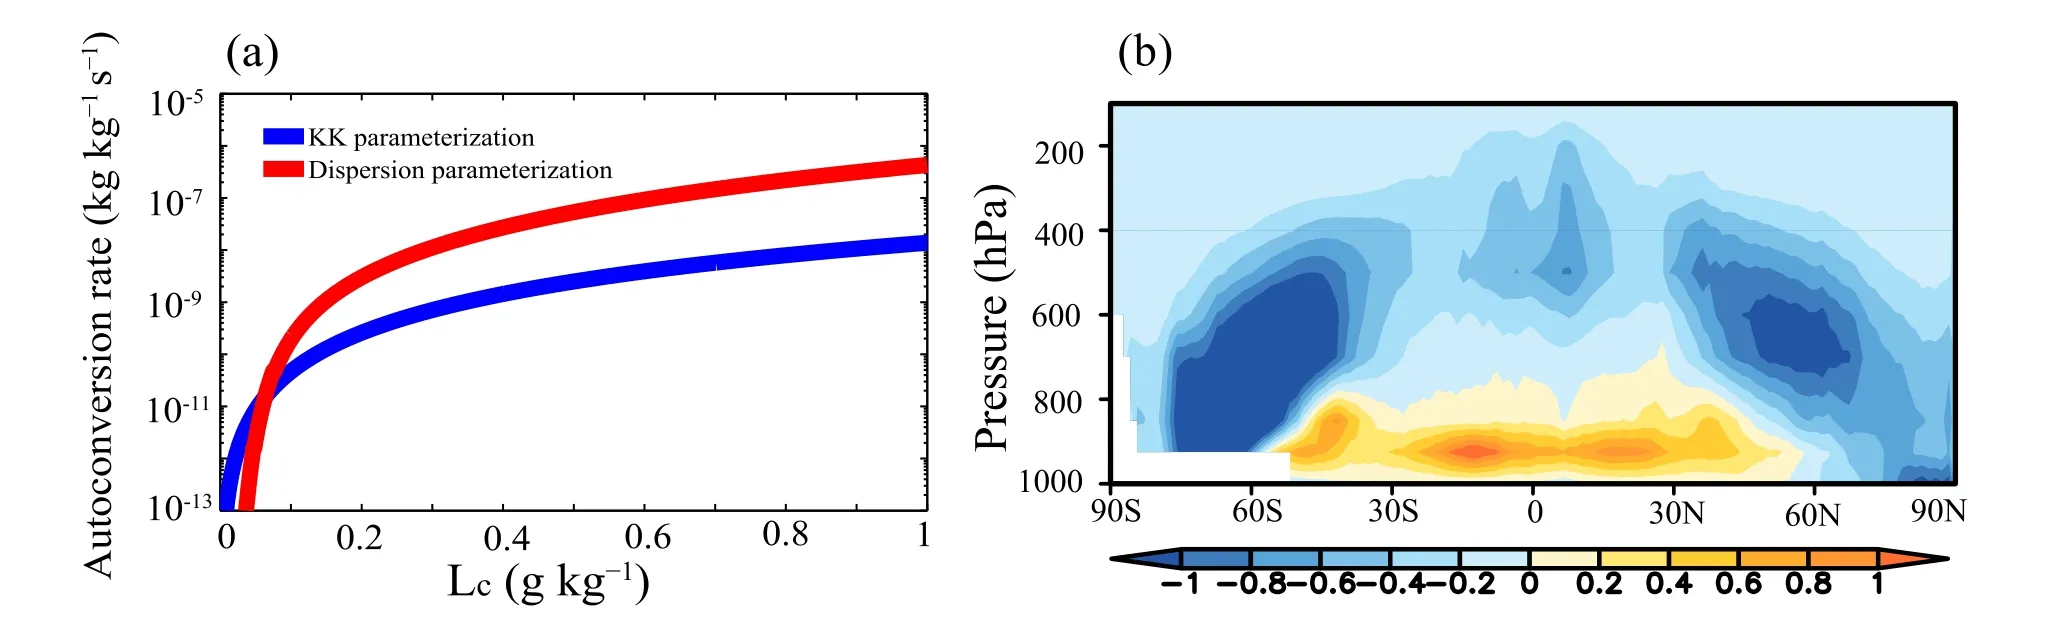
Fig.1.(a)Autoconversion rates from the KK scheme and the new autoconversion parameterizations for a fixed cloud droplet concentration of 100 cm−3.(b)Difference in the autoconversion rates(units:10−9kg kg−1s−1)from STANDARD and NEW(NEW minus STANDARD).
Observational cloud radiative forcings including SWCF andLWCFarederivedfromtheCERES-EBAFsatelliteproduct from 2000 to 2010,as described by Loeb et al.(2009),and the ERBE data from 1985 to 1989,as described by Barkstrom and Hall(1982).The simulated annual global mean SWCFs are−51.49 W m−2in STANDARD and−48.31 W m−2in NEW,showing that the global mean SWCF in NEW is lower than that in STANDARD.The main reason for this is that lower cloud liquid water exists at low levels over low latitudes in NEW,leading to smaller SWCF.These two values fall within the observational range given by CERES-EBAF(−47.07 W m−2)and ERBE(−54.16 W m−2).The simulated LWCFs are 22.78 W m−2in STANDARD and 23.56 W m−2in NEW,which are lower than the observational values from Loeb et al.(2009)and Barkstrom and Hall(1982).However,the value of LWCF in NEW is much closer to the observational range of 26.48–30.36 W m−2compared to that in STANDARD.The increased LWCF in NEW is due to a larger high-cloud fraction compared to STANDARD.The observational total precipitation rate is derived from GPCP data from 1979 to 2009(Adler et al.,2003)and CMAP data from 1979 to 1998(Xie and Arkin,1997).The simulated annual global mean tota l precipitation rates are similar for STANDARD(2.95 mm d−1)and NEW(2.97 mm d−1),which are larger than that from the observational results(2.67–2.69 mm d−1)taken from the GPCP and CMAP observations.
高业成[3]将嗜酸乳杆菌采用倾注的接种方式于36℃分别在24,48,72 h进行培养,结果得到嗜酸乳杆菌在培养到72 h时,可以更加容易观察菌斑,所以嗜酸乳杆菌的最佳观测期为72 h。闫亚梅[4]研究发现在选用保加利亚乳杆菌进行验证时,当将其培养至48 h时,活菌数最高且容易观察。
The annual global mean AODs derived from STANDARD and NEW are 0.092 and 0.090,respectively(Table 1).Because the same anthropogenic emissions(black carbon,organics and sulfate)from Lamarque et al.(2010)are adopted in the two experiments,non-significant differences exist in the simulated AODs of STANDARD and NEW,likely because of the differences in the meteorological conditions.Both simulated AODs are significantly lower than that from composite satellite remote sensing data(around 0.15)(Kinne et al.,2006),showing that IAP AGCM 4.1 significantly underestimates AOD.The main reason for the underestimation of AOD is that the coverage period of the simulated AODs(1979–2005)differs from that of the satellite observations(2000–present)Additionally,theanthropogenicaerosolemissions derived from Lamarque et al.(2010)are substantially underestimated,especially over South Asia and East Asia(Liu et al.,2012).
To further explore the differences between the effects of using different cloud microphysical schemes,we further compare the annual and seasonal zonal means and global spatial distributions of SWCF,LWCF and surface precipitation in the following su bsections.
3.1.SWCF
Figure 2 shows the zonal means of SWCF from observations(CERES-EBAF and ERBE)and IAP AGCM 4.1(STANDARD and NEW)for the whole year,for summer(June–July–August;JJA),and for winter(December–January–February;DJF).The annual zonal-mean tendencies of SWCF from STANDARD and NEW are in good agreementwithCERES-EBAFandERBE.BothsimulatedSWCFs are greatly overestimated at low latitudes and greatly underestimated at middle and high latitudes(Fig.2a).Over the low-latitude regions,the simulated SWCF of NEW is significantly reduced compared to STANDARD,and is clearly closer to CERES-EBAF and ERBE observations;whereas,STANDARD and NEW show non-significant inf l uences onSWCFoverthemid-andhigh-latituderegions.Ofnoteisthat the autoconversion rate of mass content(2)is a cubic function of cloud liquid water content,whereas it is 2.47 power of cloud liquid water content(Morrison and Gettelman,2008).Hence,the autoconversion rate used here is larger than the autoconversion rate of CAM5.1,especially for larger quantities of cloud water(Fig.1),which leads to less liquid cloud and smaller SWCF over low-latitude regions.Similar to the annual zonal-mean SWCF,the simulated seasonal results in NEW are also significantly reduced at low latitudes,which are in better agreement with the two sets of observational results shown in Figs.2b and c.Also of note is that a significant difference exists in the SWCF between the two sets of observational data in Fig.2a,with the zonal mean value from ERBE being much larger than that from CERES-EBAF.

Fig.2.The(a)annual,(b)JJA and(c)DJF zonal mean SWCF(positive represents cooling)derived from observations(CERES-EBAF estimates from 2000 to 2010 and ERBE data from 1985 to 1989)and IAP AGCM 4.1(STANDARD and NEW).
Figure 3 shows the annual mean global spatial distribution of SWCF from CERES-EBAF for the years 2000–10,that of STANDARD and NEW,and SWCF model biases.The simulated annual mean SWCFs from STANDARD(Fig.3b)and NEW(Fig.3c)can both reproduce the spatial distribution of CERES-EBAF(Fig.3a).In Figs.3d and e,over low latitudes,the simulated SWCFs from STANDARD and NEW areconsiderablyoverestimated;andovermiddleandhighlatitudes,the SWCF is greatly underestimated,compared with CERES-EBAF.The model bias in the annual mean SWCF for NEW is significantly reduced over low-latitude regions,where this reduced bias of SWCF is also found for JJA and DJF(not shown).Additionally,Table 2 summarizes some statistical results regarding the global mean SWCF,the difference in global means between observational estimates and model results,spatial pattern correlations,and RMSEs for the whole year,JJA and DJF.The results show that the annual,JJA and DJF global mean SWCF in NEW is much closer to the CERES-EBAF estimates than that of STANDARD.The spatial pattern correlation is slightly increased in the results for the whole year,as well as for JJA and DJF,and the RMSE(12.92,15.26 and 18.20 W m−2for the whole year,JJA and DJF,respectively)all decrease substantially in NEW,compared to that(15.54,18.32 and 20.19 W m−2)in STANDARD.
These results indicate that,compared to the standard cloud scheme,the new cloud schemes with ε can better simulate the SWCF,which effectively reduces the low-latitude SWCF and is much closer to satellite observations.
3.2.LWCF
The annual,JJA and DJF zonal mean LWCF from CERES-EBAF and ERBE,and from IAP AGCM 4.1,are displayed in Fig.4.The results show that,compared to the SWCF,the inf l uence of the new cloud schemes on LWCF is much smaller.The simulated mean LWCF in NEW is slightly enhanced due to an increased high-cloud fraction,and closer to observations at all latitudes,compared to STANDARD,for the whole year(Fig.4a),JJA(Fig.4b)and DJF(Fig.4c).For the annual(Fig.5)and seasonal(not shown)mean global spatial distribution of LWCF,the simulated results can also reproduce the observational spatial distribution.However,notably,the differences in the LWCF spatial distribution between STANDARD and NEW are non-significant.
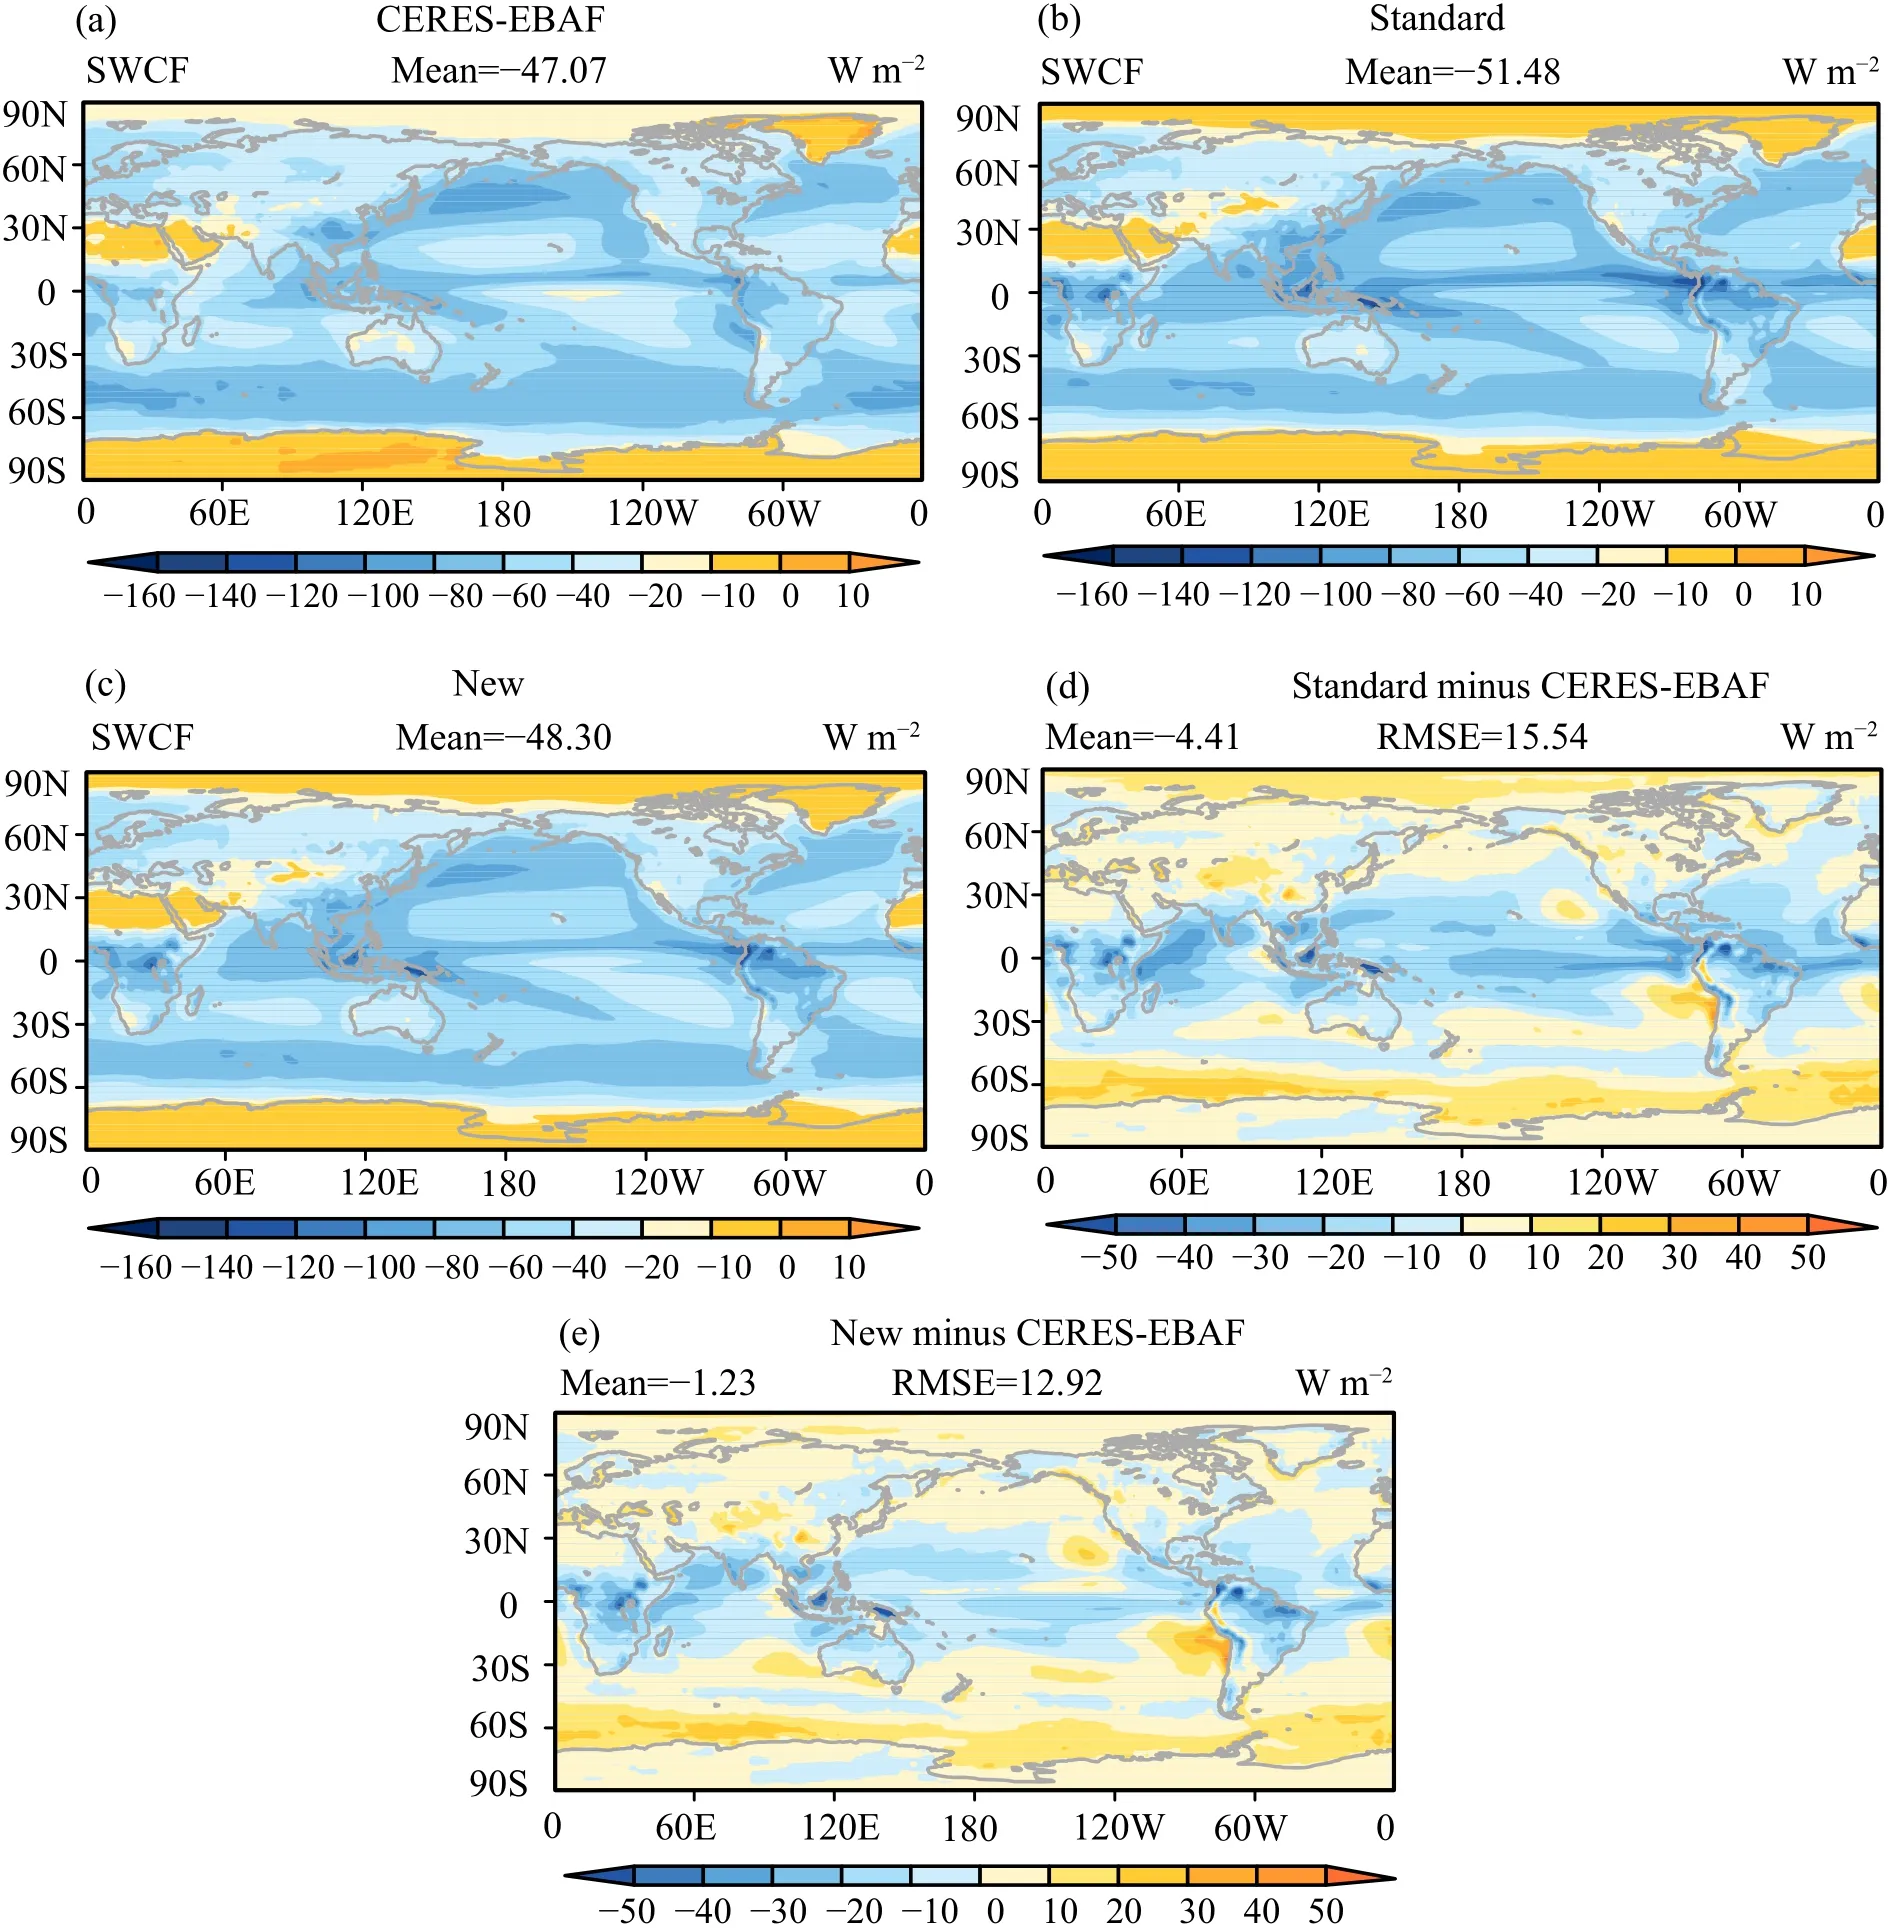
Fig.3.Annual mean global spatial distribution of SWCFfrom(a)CERES-EBAF estimates from 2000 to 2010,and(b,c)IAP AGCM 4.1[(b)STANDARD;(c)NEW].(d,e)Model SWCF biases from(d)STANDARD and(e)NEW.
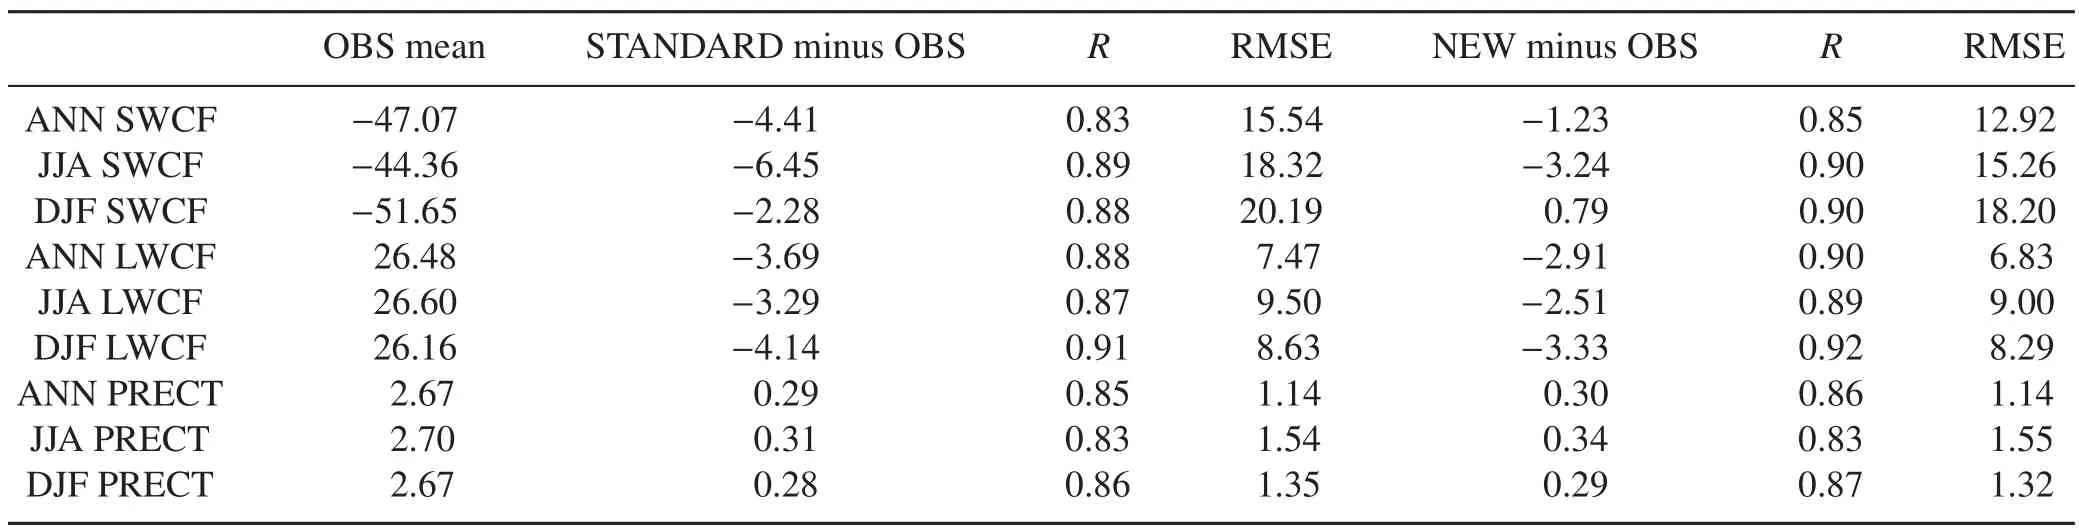
Table 2.Global means and model(IAP AGCM 4.1;STANDARD and NEW)minus observation(OBS)differences in global means,and the spatial pattern correlations(R)and RMSEs of the model results compared to the observations,for SWCF(W m−2)and LWCF(W m−2)from CERES-EBAF estimates from 2000 to 2010,and PRECT(mm d−1)from GPCP data from 1979 to 2009,for the whole year(ANN),JJA and DJF.
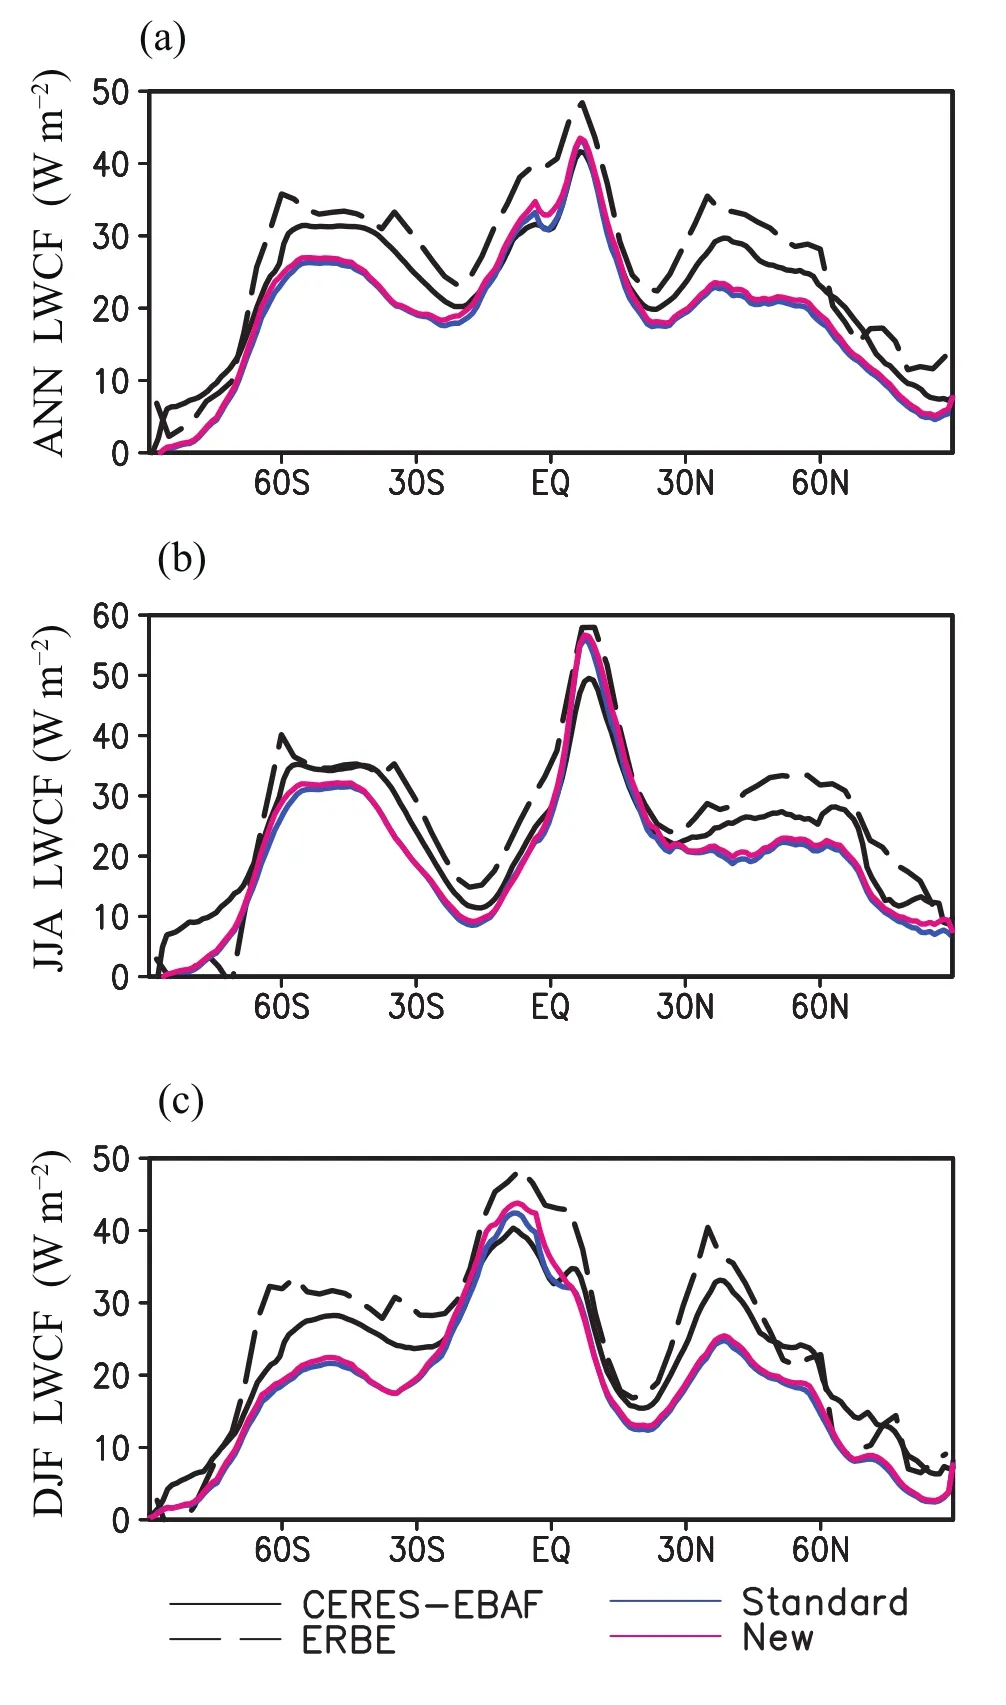
Fig.4.The(a)annual,(b)JJA and(c)DJF zonal mean LWCF(positive represents warming)from observations(CERESEBAF estimates from 2000 to 2010 and ERBE data from 1985 to 1989)and IAP AGCM 4.1(STANDARD and NEW).
3.3.Surface precipitation
Figure 6 presents the annual and seasonal zonal mean total precipitation rates and corresponding large-scale precipitation rates from GPCP and CMAP observations and IAP AGCM 4.1(STANDARD and NEW).Both STANDARD and NEW reproduce the annual and seasonal zonal mean changes in total precipitation from GPCP and CMAP(Figs.6a,6c and e).Furthermore,the simulated mean total precipitation rate in NEW changes non-significantly from that in STANDARD,both on an annual and seasonal(JJA and DJF)basis.The differences in the global spatial distribution of the model biases for annual and seasonal total precipitation between STANDARD and NEW are also marginal(figures not shown).Additionally,Table 2 shows that the model biases in annual and seasonal global mean total precipitation,the spatial pattern correlation,and the RMSE,change non-significantly from STANDARD to NEW.Hence,the results from IAP AGCM 4.1 show that the different cloud microphysical schemes do not affect the total surface precipitation significantly.
Figures 6b,d and f show that the effect of the cloud schemes on large-scale precipitation is stronger than the effect on total precipitation.The new scheme displays more large-scale precipitation than the standard scheme,for annual and seasonal means alike,especially over low-latitude regions.This is because the autoconversion rate used here is larger than the autoconversion rate of CAM5.1,especially at higher cloud liquid water(Fig.1),leading to considerably more large-scale precipitation over low-latitude regions.These results regarding enhanced large-scale precipitation in NEW are also ref l ected by the information presented in Table 3.Taken together,the results presented in Fig.6 provide further indication that the total precipitation is determined by convective precipitation where no aerosol indirect effects are considered.
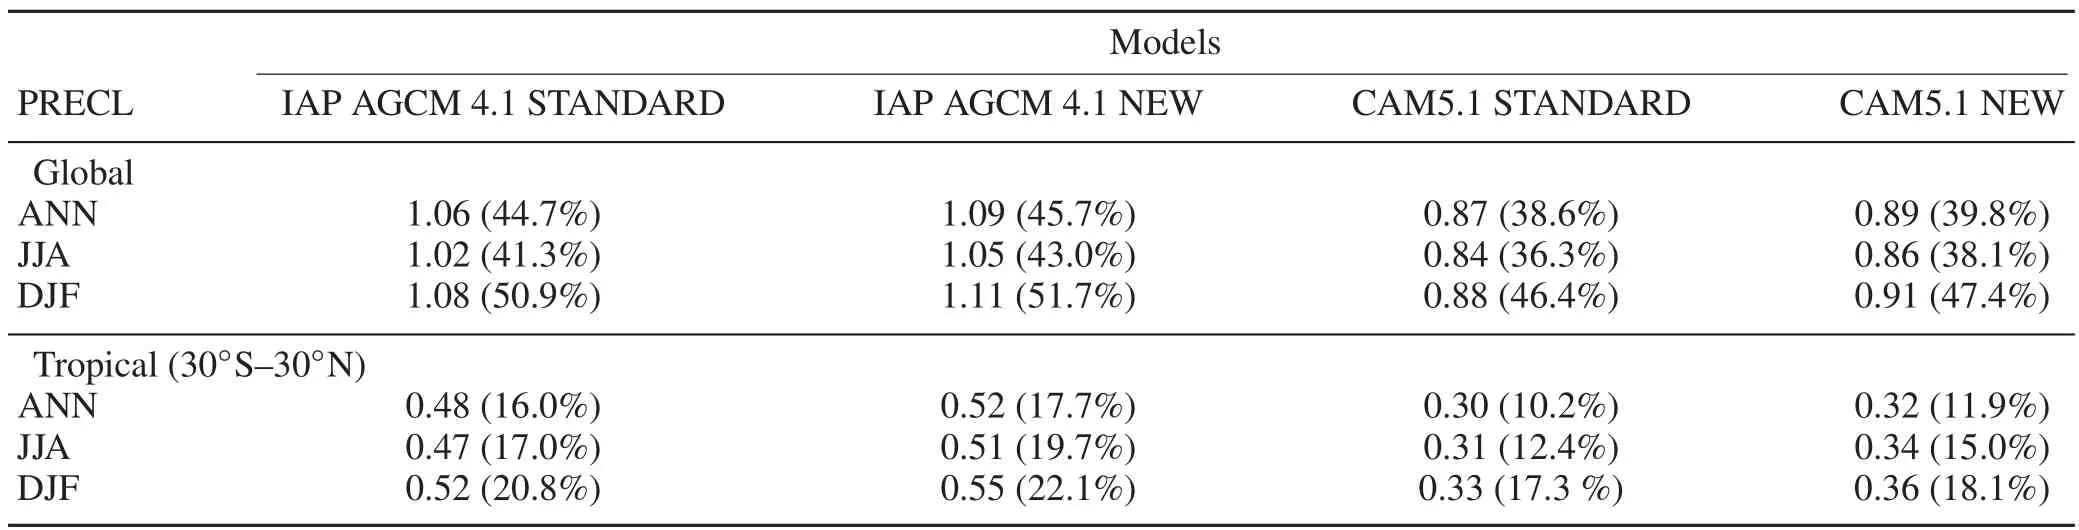
Table 3.Annual(ANN)and seasonal(JJA and DJF)global and tropical(30°S–30°N)large-scale precipitation rate(PRECL;mm d−1),and the ratio of large-scale precipitation to total precipitation,for IAP AGCM 4.1 and CAM5.1 with different cloud parameterizations(STANDARD and NEW).
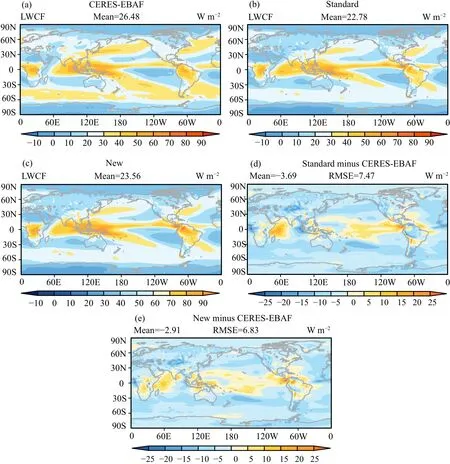
Fig.5.Annual mean global spatial distribution of LWCF from(a)CERES-EBAF estimates from 2000 to 2010,and(b,c)IAP AGCM 4.1[(b)STANDARD;(c)NEW].(d,e)Model LWCF biases from(d)STANDARD and(e)NEW.
3.4.Comparison between IAP AGCM 4.1 and CAM5.1
Results from IAP AGCM 4.1(Table 2)and CAM5.1(Table 4)show that the simulated SWCFs with the new cloud schemes over low-latitude regions are significantly reduced and are much closer to satellite observations,as compared to the standard cloud scheme,which decreases the model bias in mean SWCF,increases the spatial pattern correlation,and decreases the RMSE,on the global scale.Here,we also compare the simulated SWCF from IAP AGCM 4.1 and CAM5.1 with the new cloud scheme(Tables 2 and 4).IAP AGCM 4.1 with the new scheme shows smaller bias in global mean SWCF for the whole year(−1.23 W m−2),for JJA(−3.24 W m−2),and for DJF(0.79 W m−2),than that(−3.94 W m−2,−7.14 W m−2and −1.37 W m−2,respectively)in CAM 5.1.This model also has a higher spatial pattern correlation with CERES-EBAF(0.85,0.90,and 0.90 for the whole year,for JJA and for DJF,respectively)than CAM5.1(0.77,0.84 and 0.83).Additionally,the RSMEs for IAP AGCM 4.1(12.92,15.26 and 18.20 W m−2for the whole year,for JJA and for DJF,respectively)are smaller than those of CAM5.1(15.74,20.69 and 21.62 W m−2).Furthermore,IAP AGCM 4.1 with the new schemes improves the simulated LWCF,as discussed in subsection 3.2,but no such improvement is found in CAM5.1 with the new schemes.Although IAP AGCM 4.1 with the new schemes shows a larger global mean LWCF bias,it exhibits higher spatial pattern cor-relations(0.90,0.89 and 0.92 for the whole year,for JJA and for DJF)than CAM5.1(0.88,0.85 and 0.89),and lower RMSEs(6.83,9.00 and 8.29 W m−2for the whole year,for JJA and for DJF,respectively,in IAP AGCM 4.1 versus 7.12,10.45 and 9.38 W m−2in CAM5.1).
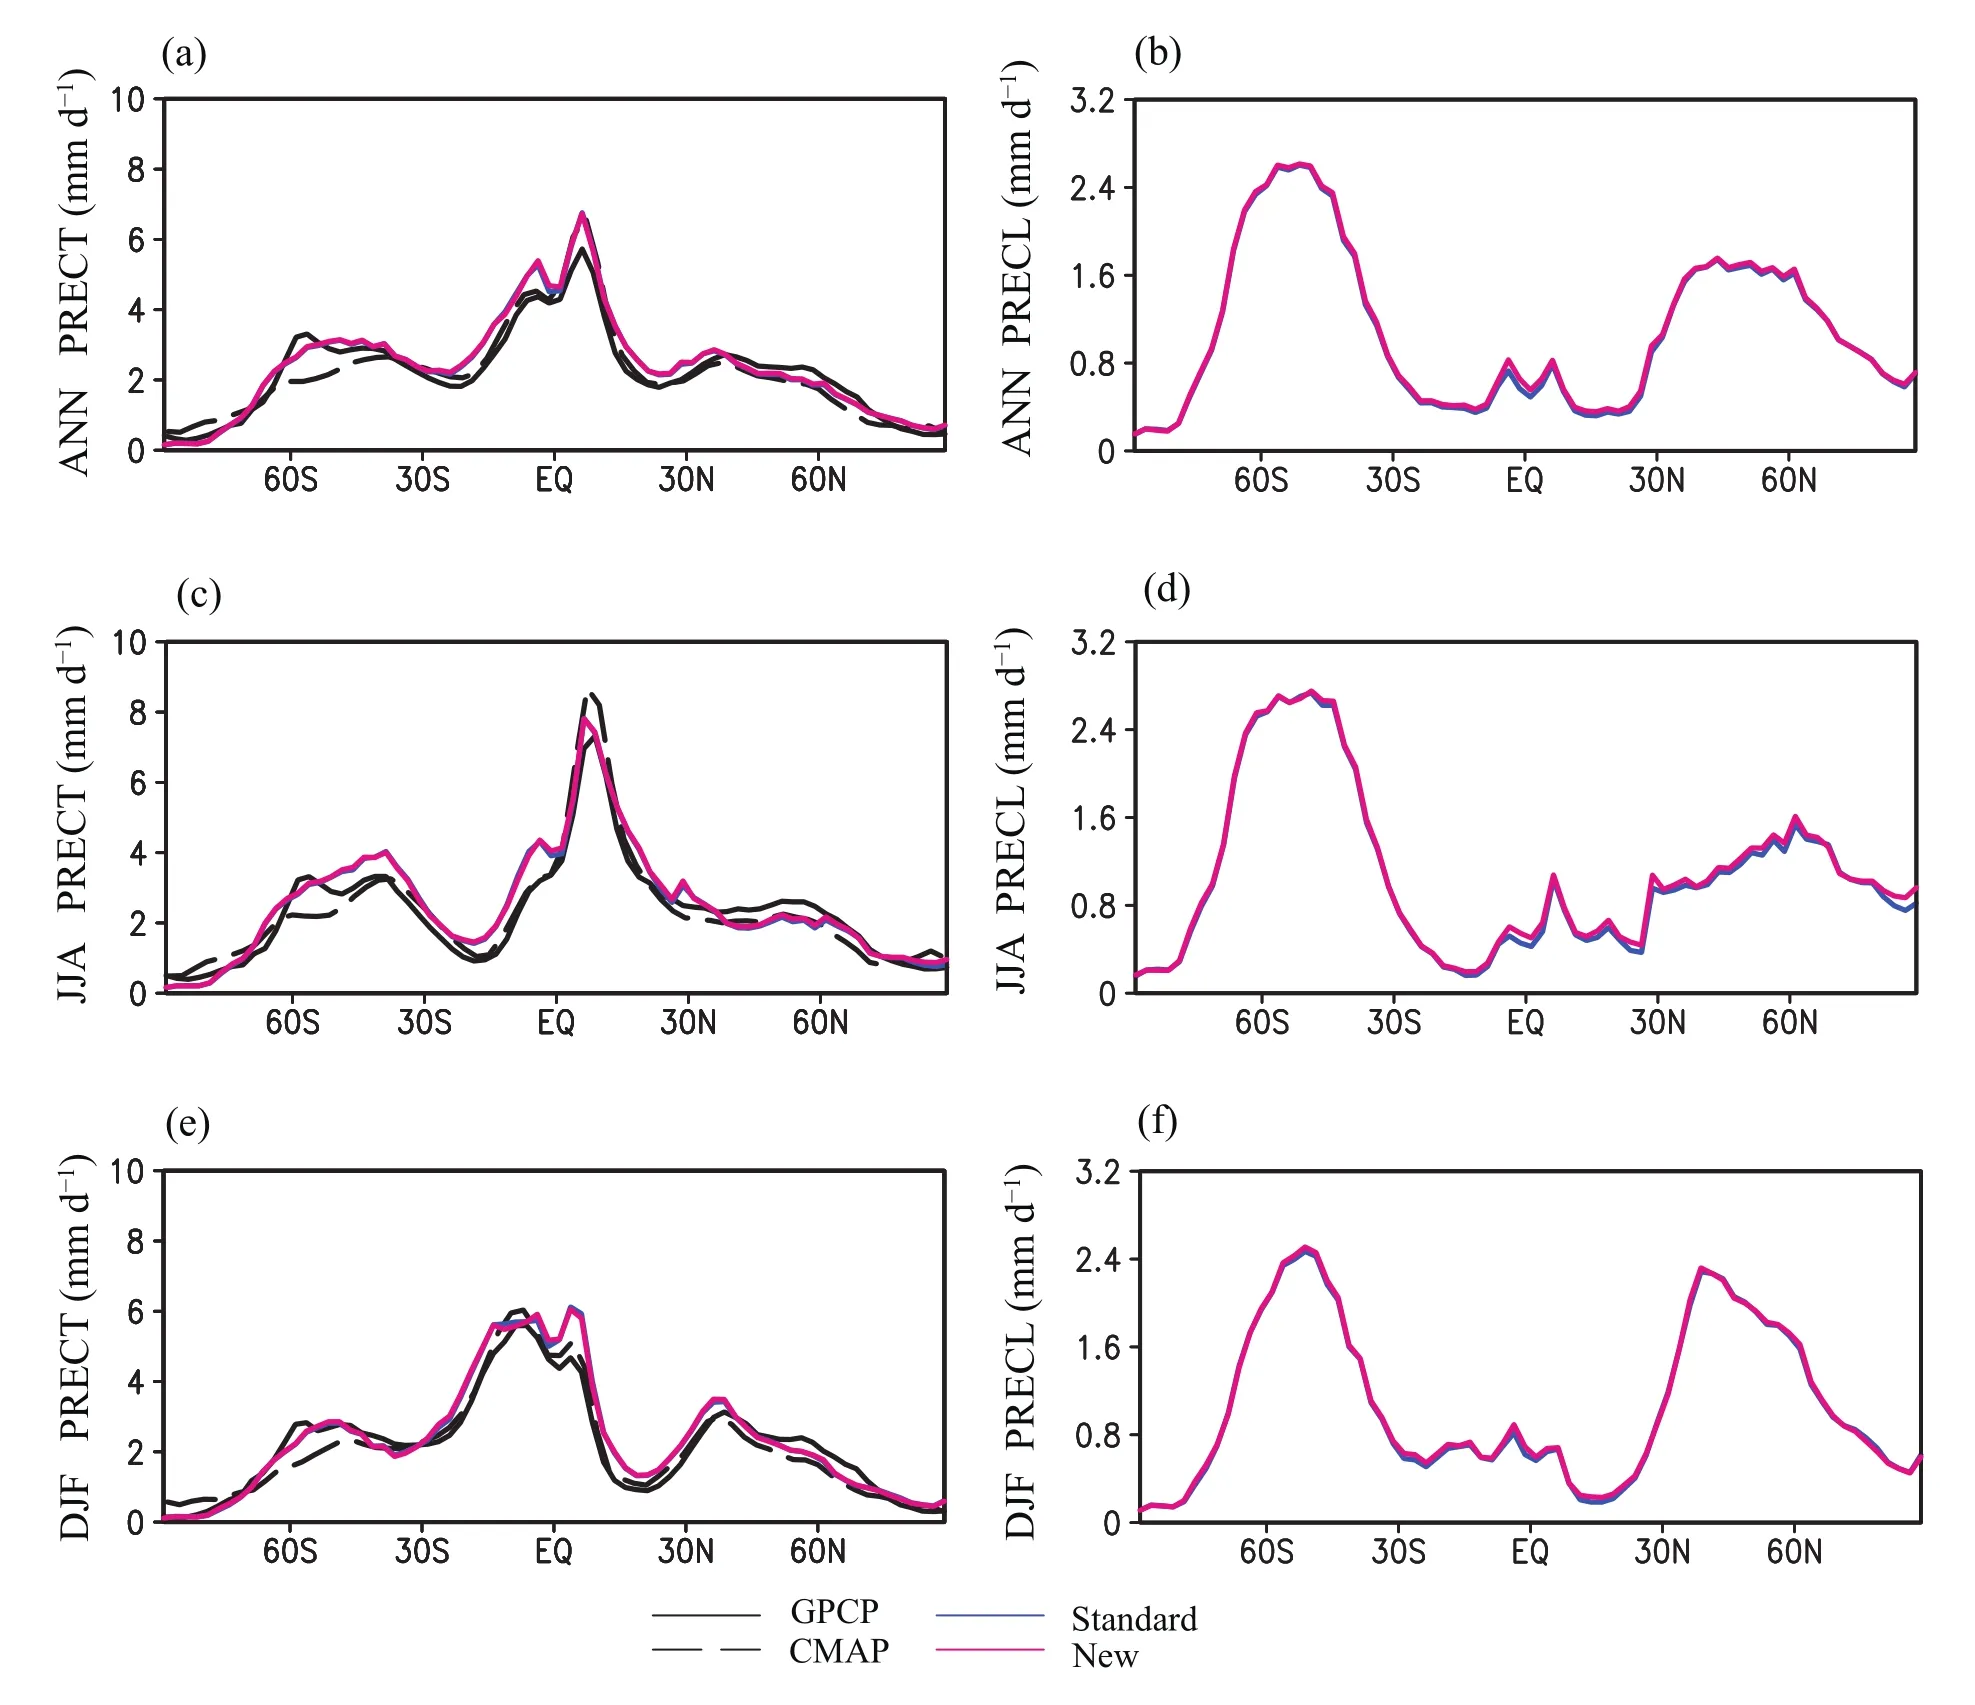
Fig.6.The(a,b)annual,(c,d)JJA and(e,f)DJF zonal mean PRECT and larger-scale PRECL from observations(GPCP,1979–2009;CMAP,1979–98)and IAP AGCM 4.1(STANDARD and NEW).
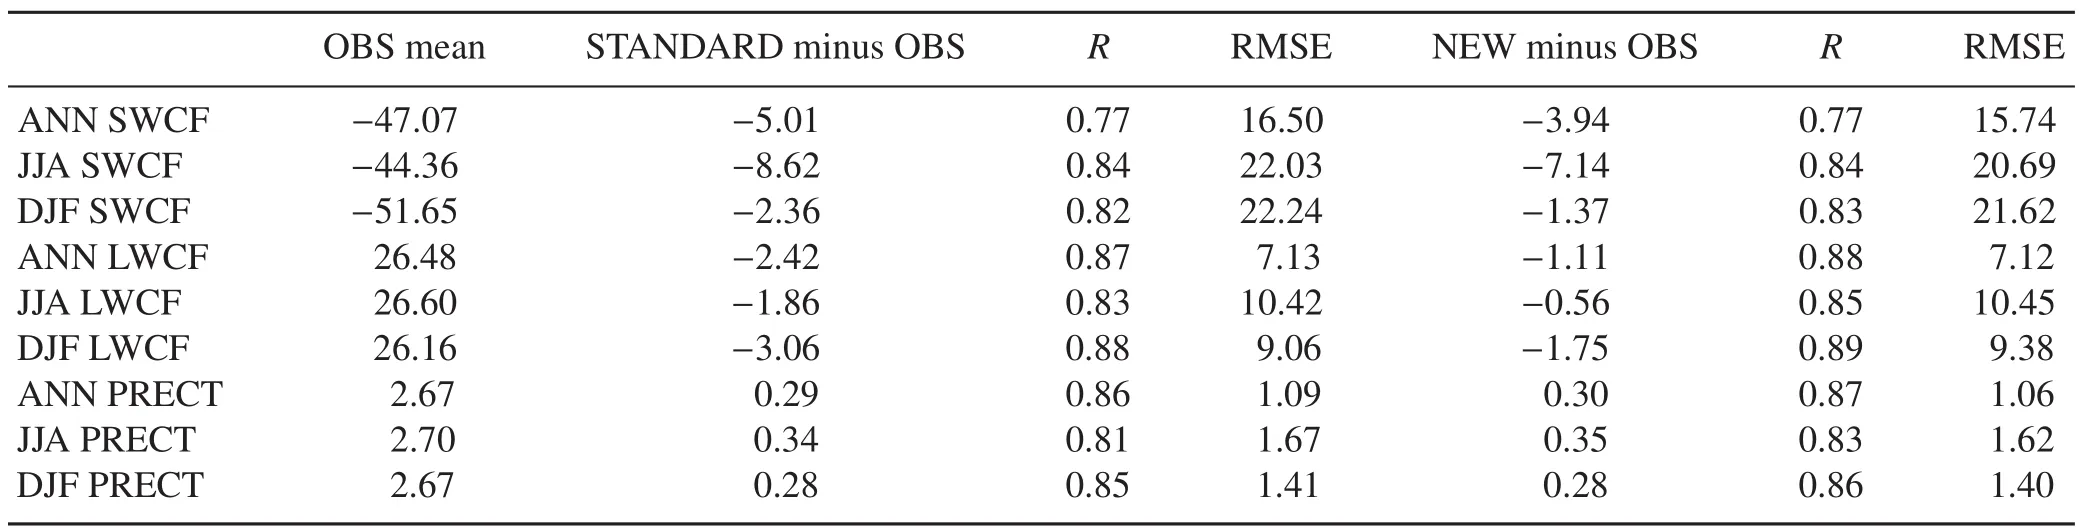
Table 4.Global means and model(IAP AGCM 4.1;STANDARD and NEW)minus observation(OBS)differences in global means,and the spatial pattern correlations(R)and RMSEs of the modeling results compared to the observed SWCF(W m−2)and LWCF(W m−2)from CERES-EBAF estimates from 2000 to 2010,and PRECT(mm d−1)from GPCP data from 1979 to 2009 for the whole year(ANN)and for JJA and DJF,in CAM5.1(Xie et al.,2017).Note that NEW here is the same as the New3 with the Rotstayn–Liu relationship in Xie et al.(2017).
Compared to the standard scheme,the large-scale precipitation and its ratio to total precipitation can be effectively enhanced in the new scheme,for both GCMs(Table 3).Note that,although the ratio of large-scale precipitation to total precipitation from both GCMs in the tropics(30°S–30°N)is much lower than that from TRMM observational estimates(Dai,2006),these two GCMs with the new schemes produce much higher large-scale precipitation,and larger ratios of large-scale precipitation to total precipitation,which is clearly closer to the TRMM observational estimates.Additionally,IAP AGCM 4.1 displays substantially more largescale precipitation and higher ratios of large-scale precipitation to total precipitation than CAM5.1.
4.Conclusions and discussion
In this paper,cloud microphysical schemes including two-moment Arand Rewith ε are implemented into IAP AGCM 4.1 by following Xie et al.(2017).It is shown that the new cloud schemes can better simulate both the SWCF and LWCF against satellite observations,as compared to the standard scheme in IAP AGCM 4.1.This GCM with the new scheme can effectively enhance the large-scale precipitation,especially over low latitudes,although the inf l uence of total precipitation is non-significant for the different cloud schemes.Additionally,further results using CAM5.1 show that this model with the new schemes also improves the simulation of SWCF compared to the standard scheme,and enhances the large-scale precipitation and its ratio to total precipitation.
The dispersion effect on aerosol indirect forcing in CAM5.1 has been reported from differences between simulations with present-day and pre-industrial aerosol emissions in Xie et al.(2017),showing that the corresponding aerosol indirect forcing with the dispersion effect considered can be reduced substantially by a range of 0.10–0.21 W m−2at the global scale,and by a much bigger margin of 0.25–0.39 W m−2for the Northern Hemisphere.The dispersion effect on aerosol indirect forcing in IAP AGCM 4.1 will be reported from present-day and pre-industrial experiments in a future study.Finally,it is noted that the choice of the Rotstayn–Liu relationship of ε−Ncin the cloud microphysical schemes with ε used in this study(Rotstayn and Liu,2003)may have implications.Different empirical formulas have been presented to stand for ε with respect to Nc,since ambient atmospheric factors and aerosol chemical and physical properties may inf l uence the ε significantly(Liu et al.,2008;Xie et al.,2013,2017).The effect of different ε−Ncrelationships on the results from IAP AGCM4.1 will also be examined in future work.
Acknowledgements.This study was partially supported by the National Key Research and Development Program of China(Grant No.2016YFA0601904)and the National Natural Science Foundation of China(Grant Nos.41690115 and 41572150).He ZHANG is supported by the National Major Research High Performance Computing Program of China(Grant No.2016YFB0200800)and the National Natural Science Foundation of China(Grant No.61432018).Yiran PENG is supported by a“973”project(Grant No.2014CB441302).Yangang LIU is supported by the US Department of Energy’s Atmospheric System Research program.
Adler,R.F.,and Coauthors,2003:The version-2 global precipitation climatology project(GPCP)monthly precipitation analysis(1979–present).Journal of Hydrometeorology,4(6),1147–1167,https://doi.org/10.1175/1525-7541(2003)004<1147:TVGPCP>2.0.CO;2.
Anderson,T.L.,R.J.Charlson,S.E.Schwartz,R.Knutti,O.Boucher,H.Rodhe,and J.Heintzenberg,2003:Climate forcing by aerosols-A hazy picture.Science,300,1103–1104,https://doi.org/10.1126/science.1084777.
Barkstrom,B.R.,and J.B.Hall,1982:Earth radiation budget experiment(ERBE):An overview.Journal of Energy,6,141–146,https://doi.org/10.2514/3.62584.
Boucher,O.,H.Le Treut,and M.B.Baker,1995:Precipitation and radiation modeling in a general circulation model:Introduction of cloud microphysical processes.J.Geophys.Res.,100,16 395–16 414,https://doi.org/10.1029/95JD01382.
Dai,A.G.,2006:Precipitation characteristics in eighteen coupled climate models.J.Climate,19,4605–4630,https://doi.org/10.1175/JCLI3884.1.
Ghan,S.J.,X.Liu,R.C.Easter,R.Zaveri,P.J.Rasch,J.-H.Yoon,and B.Eaton,2012:Toward a minimal representation of aerosols in climate models:Comparative decomposition of aerosol direct,semidirect,and indirect radiative forcing.J.Climate,25,6461–6476,https://doi.org/10.1175/JCLI-D-11-00650.1.
Han,Q.Y.,W.B.Rossow,J.Chou,and R.M.Welch,1998:Global variation of column droplet concentration in low-level clouds.Geophys.Res.Lett.,25,1419–1422,https://doi.org/10.1029/98GL01095.
Hurrell,J.W.,J.J.Hack,D.Shea,J.M.Caron,and J.Rosinski,2008:A new sea surface temperature and sea ice boundary dataset for the Community Atmosphere Model.J.Climate,21(19),5145–5153,https://doi.org/10.1175/2008JCLI 2292.1.
IPCC,2007:Climate Change 2007:The physical science basis.Contribution of Working Group I to the Fourth Assessment Report of the Intergovernmental Panel on Climate Change,S.Solomon et al.,Eds.,Cambridge University Press,Cambridge,United Kingdom and New York,NY,USA,996 pp.
IPCC,2013:Climate Change 2013:The physical science basis.Contribution of Working Group I to the Fifth Assessment Report of the Intergovernmental Panel on Climate Change,T.F.Stocker et al.,Eds.,Cambridge University Press,Cambridge,United Kingdom and New York,NY,USA,1535 pp.
Khairoutdinov,M.,and Y.Kogan,2000:A new cloud physics parameterization in a large-eddy simulation model of marine stratocumulus.Mon.Wea.Rev.,128,229–243,https://doi.org/10.1175/1520-0493(2000)128<0229:ANCPPI>2.0.CO;2.
Kinne,S.,and Coauthors,2006:An AeroCom initial assessmentoptical properties in aerosol component modules of global models.Atmos.Chem.Phys.,6,1815–1834,https://doi.org/10.5194/acp-6-1815-2006.
Kovaˇceviˇc,N.,and M.´Curi´c,2014:Sensitivity study of the inf l uence of cloud droplet concentration on hail suppression effectiveness.Meteor.Atmos.Phys.,123,195–207,https://doi.org/10.1007/s00703-013-0296-y.
Lamarque,J.F.,and Coauthors,2010:Historical(1850-2000)gridded anthropogenic and biomass burning emissions of reactive gases and aerosols:Methodology and application.Atmos.Chem.Phys.,10,7017–7039,https://doi.org/10.5194/acp-10-7017-2010.
Lee,H.,and J.-J.Baik,2017:A physically based autoconversion parameterization.J.Atmos.Sci.,74,1599–1616,https://doi.org/10.1175/JAS-D-16-0207.1.
Lin,Z.-H.,Z.Yu,H.Zhang,and C.-L.Wu,2016:Quantifying the attribution of model bias in simulating summer hot days in China with IAP AGCM 4.1.Atmos.Oceanic Sci.Lett.,9(6),436–442,https://doi.org/10.1080/16742834.2016.1232585.
Liu,X.,and Coauthors,2012:Toward a minimal representation of aerosols in climate models:Description and evaluation in the Community Atmosphere Model CAM5.Geoscientific Model Development,5,709–739,https://doi.org/10.5194/gmd-5-709-2012.
Liu,Y.G.,and P.H.Daum,2002:Anthropogenic aerosols:Indirect warming effect from dispersion forcing.Nature,419,580–581,https://doi.org/10.1038/419580a.
Liu,Y.G.,and P.H.Daum,2004:Parameterization of the autoconversion process.Part I:Analytical formulation of the Kesslertype parameterizations.J.Atmos.Sci.,61,1539–1548,https://doi.org/10.1175/1520-0469(2004)061<1539:POTAPI>2.0.CO;2.
Liu,Y.G.,P.H.Daum,R.McGraw,and M.Miller,2006:Generalized threshold function accounting for effect of relative dispersion on threshold behavior of autoconversion process.Geophys.Res.Lett.,33,L11804,https://doi.org/10.1029/2005GL025500.
Liu,Y.G.,P.H.Daum,R.L.McGraw,M.A.Miller,and S.J.Niu,2007:Theoretical expression for the autoconversion rate of the cloud droplet number concentration.Geophys.Res.Lett.,34,L16821,https://doi.org/10.1029/2007GL030389.
Liu,Y.G.,P.H.Daum,H.Guo,and Y.R.Peng,2008:Dispersion bias,dispersion effect,and the aerosol-cloud conundrum.Environ.Res.Lett.,3(4),045021,https://doi.org/10.1088/17489326/3/4/045021.
Loeb,N.G.,and Coauthors,2009:Toward optimal closure of the earth’s top-of-atmosphere radiation budget.J.Climate,22(3),748–766,https://doi.org/10.1175/2008JCLI2637.1.
Lohmann,U.,and J.Feichter,1997:Impact of sulfate aerosols on albedo and lifetime of clouds:A sensitivity study with the ECHAM4 GCM.J.Geophys.Res.,102,13 685–13 700,https://doi.org/10.1029/97JD00631.3.
Michibata,T.,and T.Takemura,2015:Evaluation of autoconversion schemes in a single model framework with satellite observations.J.Geophys.Res.,120,9570–9590,https://doi.org/10.1002/2015JD023818-T.
Morrison,H.,and A.Gettelman,2008:A new two-moment bulk stratiform cloud microphysics scheme in the Community Atmosphere Model,Version 3(CAM3).Part I:Description and numerical tests.J.Climate,21,3642–3659,https://doi.org/10.1175/2008JCLI2105.1.
Neale,R.B.,and Coauthors,2010:Description of the NCAR Community Atmosphere Model(CAM5.0).NCAR Tech.Note NCAR/TN-486+STR,268 pp.
Peng,Y.R.,and U.Lohmann,2003:Sensitivity study of the spectral dispersion of the cloud droplet size distribution on the indirect aerosol effect.Geophys.Res.Lett.,30,1507,https://doi.org/10.1029/2003GL017192.
Planche,C.,J.H.Marsham,P.R.Field,K.S.Carslaw,A.A.Hill,G.W.Mann,and B.J.Shipway,2015:Precipitation sensitivity to autoconversion rate in a numerical weatherprediction model.Quart.J.Roy.Meteor.Soc.,141,2032–2044,https://doi.org/10.1002/qj.2497.
Platnick,S.,M.D.King,S.A.Ackerman,W.P.Menzel,B.A.Baum,J.C.Riedi,and R.A.Frey,2003:The MODIS cloud products:Algorithms and examples from Terra.IEEE Transactions on Geoscience and Remote Sensing,41,459–473,https://doi.org/10.1109/TGRS.2002.808301.
Quaas,J.,O.Boucher,and U.Lohmann,2006:Constraining the total aerosol indirect effect in the LMDZ and ECHAM4 GCMs using MODIS satellite data.Atmos.Chem.Phys.,6,947–955,https://doi.org/10.5194/acp-6-947-2006.
Rossow,W.B.,and R.A.Schiffer,1999:Advances in understanding clouds from ISCCP.Bull.Amer.Meteor.Soc.,80,2261–2287,https://doi.org/10.1175/1520-0477(1999)080<2261:AIUCFI>2.0.CO;2.
Rotstayn,L.D.,and Y.G.Liu,2003:Sensitivity of the first indirect aerosol effect to an increase of cloud droplet spectral dispersion with droplet number concentration.J.Climate,16,3476–3481,https://doi.org/10.1175/1520-0442(2003)016<3476:SOTFIA>2.0.CO;2.
Rotstayn,L.D.,and Y.G.Liu,2005:A smaller global estimate of the second indirect aerosol effect.Geophys.Res.Lett.,32,L05708,https://doi.org/10.1029/2004GL021922.
Sednev,I.,and S.Menon,2012:Analyzing numerics of bulk microphysics schemes in community models:Warm rain processes.Geoscientific Model Development,5,975–987,https://doi.org/10.5194/gmd-5-975-2012.
Sun,H.C.,G.Q.Zhou,and Q.C.Zeng,2012:Assessments of the climate system model(CAS-ESM-C)Using IAP AGCM4 as its atmospheric component.Chinese Journal of Atmospheric Sciences,36,215–233,https://doi.org/10.3878/j.issn.1006-9895.2011.11062.(in Chinese)
Wang,M.,S.Ghan,M.Ovchinnikov,X.Liu,R.Easter,E.Kassianov,Y.Qian,and H.Morrison,2011:Aerosol indirect effects in a multi-scale aerosol-climate model PNNL-MMF.Atmos.Chem.Phys.,11,5431–5455,https://doi.org/10.5194/acp-11-5431-2011.
Wylie,D.,D.L.Jackson,W.P.Menzel,and J.J.Bates,2005:Trends in global cloud cover in two decades of HIRS observations.J.Climate,18,3021–3031,https://doi.org/10.1175/JCLI3461.1.
Xie,P.P.,and P.A.Arkin,1997:Global precipitation:A 17-year monthly analysis based on gauge observations,satellite estimates,and numerical model outputs.Bull.Amer.Meteor.Soc.,78,2539–2558,https://doi.org/10.1175/1520-0477(1997)078<2539:GPAYMA>2.0.CO;2.
Xie,X.N.,and X.D.Liu,2009:Analytical three-moment autoconversion parameterization based on generalized gamma distribution.J.Geophys.Res.,114,D17201,https://doi.org/10.1029/2008JD011633.
Xie,X.N.,and X.D.Liu,2011:Effects of spectral dispersion on clouds and precipitation in mesoscale convective systems.J.Geophys.Res.,116,D06202,https://doi.org/10.1029/2010 JD014598.
Xie,X.N.,and X.D.Liu,2013:Analytical studies of the cloud droplet spectral dispersion inf l uence on the first indirect aerosoleffect.Adv.Atmos.Sci.,30(5),1313–1319,https://doi.org/10.1007/s00376-012-2141-5.
Xie,X.N.,and X.D.Liu,2015:Aerosol-cloud-precipitation interactions in WRF model:sensitivity to autoconversion parame-terization.Journal of Meteorological Research,29(1),72–81,https://doi.org/10.1007/s13351-014-4065-8.
Xie,X.N.,X.D.Liu,Y.R.Peng,Y.Wang,Z.G.Yue,and X.Z.Li,2013:Numerical simulation of clouds and precipitation depending on different relationships between aerosol and cloud droplet spectral dispersion.Tellus B,65,19054,https://doi.org/10.3402/tellusb.v65i0.19054.
Xie,X.N.,H.Zhang,X.D.Liu,Y.R.Peng,and Y.G.Liu,2017:Sensitivity study of cloud parameterizations with relative dispersion in CAM5.1:Impacts on aerosol indirect effects.Atmos.Chem.Phys.,17,5877–5892,https://doi.org/10.5194/acp-17-5877-2017.
Yan,Z.-B.,Z.-H.Lin,and H.Zhang,2014:The Relationship between the East Asian Subtropical Westerly Jet and Summer Precipitation over East Asia as Simulated by the IAP AGCM4.0.Atmospheric and Oceanic Science Letters,7,487–492,https://doi.org/10.3878/AOSL20140048.
Zhang,H.,Z.H.Lin,and Q.C.Zeng,2009:The computational scheme and the test for dynamical framework of IAP AGCM-4.Chinese Journal of Atmospheric Sciences,33,1267–1285,https://doi.org/10.3878/j.issn.1006-9895.2009.06.13.(in Chinese)
Zhang,H.,M.H.Zhang,and Q.-C.Zeng,2013:Sensitivity of simulated climate to two atmospheric models:Interpretation of differences between dry models and moist models.Mon.Wea.Rev.,141,1558–1576,https://doi.org/10.1175/MWRD-11-00367.1.
13 April 2017;revised 7 August 2017;accepted 16 August 2017)
:Xie,X.N.,H.Zhang,X.D.Liu,Y.R.Peng,and Y.G.Liu,2018:Role of microphysical parameterizations with droplet relative dispersion in IAP AGCM 4.1.Adv.Atmos.Sci.,35(2),248–259,https://doi.org/10.1007/s00376-017-7083-5.
∗Corresponding author:Xiaoning XIE
Email:xnxie@ieecas.cn
©Institute of Atmospheric Physics/Chinese Academy of Sciences,and Science Press and Springer-Verlag GmbH Germany,part of Springer Nature 2018
猜你喜欢
杂志排行
Advances in Atmospheric Sciences的其它文章
- Aerosol Microphysical and Radiative Effects on Continental Cloud Ensembles
- Can MODIS Detect Trends in Aerosol Optical Depth over Land?
- Comparison between MODIS-derived Day and Night Cloud Cover and Surface Observations over the North China Plain
- Climatology of Cloud-base Height from Long-term Radiosonde Measurements in China
- First Surface-based Estimation of the Aerosol Indirect Effect over a Site in Southeastern China
- Study of Aerosol Direct and Indirect Effects and Auto-conversion Processes over the West African Monsoon Region Using a Regional Climate Model