灾害天气研究进展
2017-07-19
1 灾害天气监测
1.1 华南云降水微物理结构观测和不同波段不同观测体制雷达的数据融合方法
在2017年华南暴雨外场试验期间,利用Ka波段云雷达、C波段连续波雷达和激光云高仪等设备,获取了华南云降水垂直结构综合数据;利用X波段相控阵天气雷达,获取了强对流三维结构数据,这些数据在云降水机理研究方面得到应用,实现了外场试验数据的远程监控。对比了Ka波段云雷达与C波段连续波雷达不同波长和不同探测体制的雷达的回波强度、径向速度的一致性,提出了云雷达、C波段连续波雷达和激光云高仪的数据融合方法。云雷达在高云观测中起重要作用,同时C波段连续波雷达在中云、低云和强降水中观测起重要作用,激光云高仪对识别云降水回波中的晴空回波有一定帮助。3种数据融合填补了云雷达观测强降水的弱点,减小了晴空回波和雾对边界层内云降水观测的影响(图1)。(刘黎平,阮征,崔哲虎)
1.2 X波段相控阵天气雷达和双线偏振雷达联合分析的一次华南超级单体微物理和动力精细结构
利用2016年X波段相控阵天气雷达和双线偏振雷达联合观测的5月9日发生在广东佛山一次超级单体数据,以及发展的双线偏振雷达降水粒子相态识别方法进行对流系统微物理参数反演和分析。结果显示,相控阵雷达对强对流精细结构及其演变的观测能力优于常规的机械扫描雷达。对流过程的触发和新单体的合并常常发生在强的入流区,悬垂回波的形成与消亡与入流和出流有一定关系。通过这一过程分析,进一步检验和验证了我国生产的相控阵天气雷达和双线偏振雷达是对流过程分析研究和短临预报的重要工具。(刘黎平,吴翀)
1.3 基于双线偏振雷达观测数据的那曲对流云结构
利用可移式C波段双线偏振雷达(C-POL)以及那曲新一代天气雷达(CINRAD/CD)2014年7—8月在西藏那曲地区的观测资料,并通过双多普勒雷达风场反演和偏振雷达相态识别,清晰展示了高原冰雹云发生发展的动力、微物理、热力结构特征。RHI扫描的ZH、ZDR和反演的相态(Class)分布图上显示,粒子跟随“零线”抬高不断增长,回波强度也越来越大,并最终超过主上升气流从另一侧降落,形成冰雹墙的整个动力与微物理过程。从连续时次的RHI扫描图上,还观测到一次对流单体发生发展过程中相态从湿雪到冰雹的变化。单体刚刚触发时,回波高度不高,强度还很弱,但是却出现成片的湿雪区域,说明上升气流非常旺盛,将本来落到0 ℃以下的未完全融化的湿雪重新带到0 ℃层以上,通过凝华、淞附、攀附等物理过程,仅仅10 min,这些湿雪就能够迅速增长成为冰雹。这些湿雪重新凝结过程中潜热释放,进一步促进了不稳定结构,加强了上升气流和下沉气流。因此,如果在某个刚刚生成的弱回波区域内,融化层以上出现大量的湿雪,往往预示着该区域上升气流强劲,会迅速发展成强回波单体。通过三维风场反演得到的不同高度层的风场配置可以看出,风切变的存在,不仅提供了水平旋转,并且加速了垂直环流,有利于不稳定能量向动能的转换,单体从而能够迅速发展起来(图2)。(胡志群)
1.4 我国新一代天气雷达网波束传播条件的评估
大气折射率垂直梯度(VRG)对天气雷达波束传播至关重要。雷达波束路径计算中最常用的是标准折射条件,即4/3地球半径模式。应用探空数据分析了我国天气雷达网分布区域地表上1 km内VRG的时空间变化特征。指出,在区域气候条件与地理环境的影响下,大部分天气雷达VRG较标准条件下偏小,极少数雷达稍有偏大。VRG总体上以偏小为主,尤其是雷达观测特别重要的雨季,同时雷达波束较标准条件下偏低。不过考虑到1°的雷达波束宽度导致的回波高度不确定性,大气折射引起的波束高度误差是可以接受的。但在沿海地区和长江中下游地区,雷达波束受遮挡和地物污染的风险更高,在雷达数据应用过程中有必要更加谨慎。评估结果更准确地给出了我国新一代天气雷达电磁波传播的大气环境,有助于了解雷达观测数据受地物杂波污染风险,以便更好地应用雷达观测数据。(王红艳)
2 青藏高原研究
2.1 夏季青藏高原对流系统(TCS)的地区差异
夏季青藏高原对流系统(TCS)存在高原中部(97°~102°E,28°~33°N)和高原东部(89°~94°E,28°~33°N)2个高发中心,且这2个高发中心的TCS存在明显的地区差异。东部中心生成的TCS更多,但这些TCS只有20%~30%生成于青藏高原切变线、低涡、低压等天气系统,面积较小,水汽相对丰富,更容易产生降水,降水最大值出现在00∶00—03∶00,其高空西风气流更强,更容易(60%~90%)移出高原;而高原中部中心生成的TCS大多(50%~70%)伴有切变线/低涡/低压天气系统,面积更大,但更干燥,平均降水率小,最大降水率出现在18∶00—21∶00,由于其高空西风气流较弱,且离高原东部边界较远,大多(60%~90%)无法移出高原(图3)。(胡亮,徐祥德,赵平)
2.2 利用大涡模拟研究青藏高原淡积云
通过大涡模拟由地表感热通量和潜热通量强迫生成的淡积云,得到淡积云的宏观特征量(主要水平尺度谱、云底高度、云的覆盖度、云中垂直速度等参量),重点讨论高原低空气密度条件下,边界层内强湍流对淡积云影响的物理机制。(王寅钧, 徐祥德)
2.3 青藏高原与中国其他地区边界层高度的统计特征
使用中国地区128个探空站数据计算青藏高原与其他地区的边界层高度,用Gamma函数拟合不同地区在不同稳定度条件下(对流边界层CBL,中性残余层NRL,稳定边界层SBL)边界层高度频率的分布,得到了形状参数k和尺度参数s,指出青藏高原与其他地区边界层高度的异同。(王寅钧, 徐祥德等)
2.4 青藏高原对我国雾霾天气的影响及其对降水的影响
中国降水极端事件变异与大地形东部霾污染区域气候“胁迫”相关,青藏高原和黄土高原大地形结构“背风坡”“约束”下构成了大地形东侧人为气溶胶持续高值区,且气溶胶浓度高值区(对应霾天气高频区)与中国西部气溶胶相对“清洁区域”的不同降水强度极端事件年代际变化趋势显著性特征均存在明显差异。从华北地区飞机观测与地面气溶胶、气象站点多源信息分析中发现华北区域气溶胶(能见度)与云结构特征相关,且中国高原大地形东部降水极端事件与能见度存在年际同步变化趋势,即随着能见度降低(气溶胶增多),小雨事件呈减少趋势,暴雨、特大暴雨事件呈显著增多趋势,研究结果揭示出气溶胶与暴雨极端事件的关联性,从实际天气事件年际变化视角,清晰地描述出气溶胶变异的气候效应及其对极端天气灾害的影响特征,提出了气溶胶变异的气候效应的新事实。(徐祥德,郭学良等)
2.5 低纬海洋水汽对中国夏季大陆降水的调制
基于OME-based降水诊断技术,揭示并量化了3个低纬海洋子区域(阿拉伯海、孟加拉湾和南中国海)水汽输出对中国大陆夏季降水的贡献;同时,还探讨了3个子区域海洋水汽输出异常与年际尺度上观测到的降水变化的相关性。研究发现,从多年气候态来看,来自阿拉伯海、孟加拉湾和南海的海洋水汽输出对整个中国大陆降水贡献相当,但在中国次季节尺度上,3个不同地位海洋区域的贡献存在显著反位相季节内变化。分析结果还显示,年际变化尺度上,中国南海—孟加拉湾地区与阿拉伯海地区导致的OME降水呈显著负相关,并影响着中国夏季降水变化。(陈斌,徐祥德)
2.6 青藏高原通过亚洲—太平洋涛动(APO)影响全球气候的新途径
通过改变高原地形高度和改变高原植被类型两类数值试验,分别模拟出青藏高原抬升加热的动力、热力混合效应以及青藏高原单独的热力效应。研究显示,上述两类试验均再现了青藏高原激发亚洲与北太平洋热带外异常垂直环流的物理过程,成功强迫出了典型的夏季亚洲—太平洋涛动(APO)异常结构,从而证实了青藏高原热力作用在夏季占主导地位,是影响夏季APO的一个重要因素。这一工作指出了青藏高原热力异常通过对APO的调节作用进而影响全球气候的新途径。(刘舸, 赵平, 陈军明)
3 暴雨和强对流研究
3.1 全球五大业务中心的集合预报系统对华南前汛期定量降水预报的评估
利用THORPEX TIGGE的数据集,评估了欧洲中期天气预报中心(ECMWF)、美国国家环境预报中心(NCEP)、日本气象厅(JMA)、韩国气象厅(KMA)和中国气象局(CMA)共5个全球集合预报系统(EPS)对华南前汛期(4—6月)降水的预报能力。3个季度(2013—2015年)的0~5天预报评估表明,与简单的数值平均预报相比,概率匹配方法处理的集合预报结果对降水强度的预报能力更高,确定性预报的能力与概率匹配方法较为接近。所有集合预报均高估弱降雨量(<30 mm/12 h),低估强降雨量(>30 mm/12 h),其中JMA低估最严重。对于4个代表性暴雨事件,对比最好的集合预报(ECMWF)和较差的集合预报(JMA和CMA)的天气形势,并开展集合敏感性分析。结果表明,将暖湿空气运送到华南地区的暴雨区上游的低层西南气流是控制定量降水预报的关键天气因素;预报局地的暴雨比预报更广泛分布的暴雨更具挑战性;通过缩短30~36 h至18~24 h至6~12 h的起报时间,可以稍微改善受大尺度动力强迫影响的降水,但未改善局地降水(图4)。(黄龄,罗亚丽)
3.2 台湾2003—2012年极端小时降水天气背景分析
基于2003—2012年台湾密集自动观测站的小时降水数据,对台湾5年、10年、20年一遇以及超过100 mm/h 4种阈值的极端小时降水进行统计分析。极端小时降水记录根据其发生时的天气背景共分为4类:热带气旋型,锋面型,弱天气尺度强迫型以及低涡/切变线型。在4种阈值的分析结果中,热带气旋型均超过总记录数的75%,锋面型和弱天气尺度强迫型所占比例相当(9%~13%)。极端小时降水在5月到6月中旬主要由梅雨锋造成,在7—10月则主要由热带气旋造成。热带气旋型极端降水事件维持时间倾向较长(>12 h),且在极端小时降水发生前后的降水强度演变具有对称结构;锋面型和弱天气尺度强迫型降水事件发生时间较短(<6 h)且降水演变具有不对称性结构。热带气旋型根据热带气旋中心相对台湾岛的位置被分为7个子类型。子类型Ⅰ—Ⅳ发生在热带气旋中心登陆台湾岛或在距离最近海岸线100 km范围内时,极端小时降水的空间分布主要由当热带气旋中心位于台湾西北、南部、东部及东北方位角时热带气旋环流与台湾地形的相互作用关系所决定;子类型Ⅴ—Ⅶ发生在热带气旋中心远离台湾岛(>100 km)时,西南/东北季风的强度以及热带气旋外部环流与台湾中央山脉在山脉东侧的相互作用也是决定极端小时降水空间分布的重要因子。(罗亚丽,吴梦雯)
3.3 华南沿海一次极端降水过程中多雨带和多单体排列的作用
2014年5月11日,由多条30~80 km长的雨带组成的2个中尺度对流系统(MCS),在广东沿海中部产生的24 h累积降水高达452 mm。双多普勒雷达风场反演表明,沿着海岸线有一条准静止中尺度出流边界,海上来的暖湿气流被边界抬升触发对流,使得2个中尺度对流系统得以长时间维持。在对流层中低层环境西南气流的影响下,出流边界上新生的对流单体向东北方向移动组成单体波列,形成多条中β尺度雨带。这些雨带几乎相互平行,沿着海岸线向下游移动并产生极端降水,其中下午的第2个MCS的降水贡献更大。S波段双线偏振雷达资料表明,与上午第1个MCS相比,第2个MCS有数目更多的中等大小的降水粒子以及更大的大雨滴,其对流上升运动更强,冰相过程也更活跃,这可能与下午更大的环境对流不稳定能量有关。进一步分析第2个MCS多雨带结构的形成发现,其最前方对流雨带的后部形成强的西风气流,使得雨带中部向前突起成为弓形,并分裂成南北2段,中尺度出流边界的对流触发作用,使得分裂的两部分各自发展为完整的雨带,这种弓形雨带的断裂—再生的现象使得强降水雨带的数目迅速增加。建立了此次过程多雨带结构极端降水MCS的概念模型。(罗亚丽,刘希,张大林)
3.4 华南前汛期极端小时降水统计特征分析
利用基于稠密雨量计观测资料生成的8 km格距的小时降水数据、天气图、再分析资料和逐6 min雷达组合反射率拼图数据,分析了2011—2017年华南前汛期极端小时降水(>60 mm/h)的基本特征。分析时间段内,华南(主要是广西、广东两省)共录得2659个极端小时降水记录,4、5、6月分别录得262、1405和992个。有3个极端小时降水发生的高频中心,分别位于广西北部,广西东南部,以及广东中部和沿海地区。3个中心极端小时降水地日变化特征各不相同,广西北部是单峰结构,峰值出现在午夜,广东中部和沿海是双峰结构,主峰在清晨,次峰在下午,广西东南部中心没有明显的日变化。根据发生时的天气背景,把这2659个极端降水分为锋面型、低涡型、切变线型、弱天气尺度强迫型,和热带气旋型5种类型,它们分别占总频次的35.5%、8.9%、16.4%、38.1%和1%。相比于广东,广西的极端小时降水受到天气尺度系统产生的动力抬升作用更明显。对发生在2013—2017年5月1日至6月15日的1716个极端小时降水记录,利用逐6 min的雷达组合反射率拼图数据分析降水系统的组织模态特征。结果表明:由线状中尺度对流系统MCS(MCS中只有1条超过100 km长的主对流带)、多雨带型MCS(MRB,MCS包含多条对流带)和更小尺度的降水系统产生的极端小时降水分别占总频次的51.4%、7.7% 和41%;线状MCS造成的极端降水广泛分布在华南地区,在广西北部有一个高频中心,在广东中部沿海地区有一个次高频中心;由MRB型MCS产生的极端降水主要影响广东中部内陆和沿海地区;更小尺度的降水系统造成的极端降水分布在整个华南地区,且在广西和广东中部有两个高频中心。极端小时降水事件的时长和发展类型也具有明显的区域差异。(罗亚丽,陈杨瑞雪,李争辉)
3.5 同化广东沿海业务雷达径向风观测资料对模拟强降水对流活动的影响
针对2013年前汛期发生在华南沿海的一次强降水过程,研究WRF-EnKF系统同化多普勒雷达径向风速度观测资料对于中尺度对流系统(MCS)预报技巧的影响。同化试验首先通过扰动生成60个集合成员,然后分别以6、12、24、30 min的时间间隔、不同的同化时长(0~2 h)同化了雷达资料,运行40个确定性预报试验(DADF),运行了1组没有进行资料同化的试验(NODA)以作参照。结果表明:同化试验能够显著改进对流预报,虽然与观测对流在位置上有些差别,40 个DADF试验能够大概率地预报出广东沿海陆地上和海上的中尺度对流系统;与更长时间间隔的试验成员相比,最短时间间隔(6 min)的成员具有更高的预报技巧,其中最长同化时长和最短同化间隔的成员具有最优的预报效果,然而缩短时间间隔(例如12 min)或者延长同化时长并不总是对预报技巧有正的影响;在最优成员中,改进的初始场提供的动力和热动力条件更有利于陆地上的MCS更早触发、海洋上的MCS能够维持更长时间。(宝兴华,罗亚丽)
3.6 “5.7”广州破纪录降水的对流系统的观测分析
利用华南季风降水试验(SCMREX)加密观测期间多种仪器的综合观测资料,以及四维变分多普勒雷达分析系统(4D VDRAS)生成的高分辨率格点化数据,对造成2017年5月7日广州极端降水的中β尺度对流系统进行了研究。结果表明,包裹在弱环境风中并携带着充分水汽的上岸急流在经过城区时不断减速形成中β尺度辐合区域,最终在城区北侧的一座小山前缘导致对流触发,城市下垫面增强的摩擦作用和地形阻挡作用是该β尺度辐合区形成的原因,而城市热岛效应有利于夜间在城市上方及其下风方(北侧)维持不稳定大气,并形成相对较深厚的边界层。上岸气流导致了城市上方深厚湿空气柱的形成,深厚的湿空气柱、弱的环境风场以及中等高度的中性浮力层(LNB,大约10 km ASL)抑制了强上升气流的出现和高层水凝物的卷出,从而有利于对流系统维持准静止,并产生较高的降水效率。利用VDRAS输出结果发现,极端降水系统内部存在一个中β尺度涡旋,该涡旋内存在一个中等厚度、中γ尺度、圆形的对流核(C3)。涡度诊断表明,对流环境水平涡度的倾侧作用对涡旋的早期生成起重要作用,而与低层辐合相关的拉伸作用对垂直正涡度的维持起重要作用。潜热释放造成的热浮力是维持C3内上升运动的主要原因,动力垂直扰动气压梯度力的作用次之。活跃的暖雨过程生成了大量中等到大粒径的雨滴,这可能与偏南入流携带的大量海盐气溶胶充当云凝结核有关。(罗亚丽,马若赟,张大林,陈明轩)
3.7 大尺度环境场对华北中尺度对流系统对流性降水率和地闪频次的影响
对有利于华北中尺度对流系统(MCS)产生不同强度降水和不同频次地闪的环境场进行了合成研究。根据MCS产生的对流性降水率的高低(HR/LR)和地闪频次的多少(HL/LL),将2008—2013年6—8月期间的60个MCS分为强降水率多地闪(HRHL)、强降水率少地闪(HRLL)、弱降水率多地闪(LRHL)和弱降水率少地闪(LRLL)等4类MCS。结果表明:伴有HR(HL)类MCS多发生在7月(8月),而伴随LR或LL的MCS多发生在6月,与季节变化一致。MCS多在午后形成,其中HRLL MCS也会在夜间形成,而HRHL MCS在一天中任何阶段都有可能形成。环流合成分析表明,除了发生频次非常低的LRHL MCS外,其他3类MCS的环流场存在显著差异。HRHL和HRLL MCS发生在高空异常辐散,中层槽和低层西南气流输送水汽的环流场中,而LRLL MCS多缘于山区日间加热。HRHL、HRLL、LRHL和LRLL MCS环流场表现出从高到低的对流有效位能和可降水量分布,和从低到高的对流抑制和抬升指数分布。大尺度环境条件可在一定程度上决定MCS中地闪的频次和降水率的强弱,但还受到其他过程的影响,如云微物理过程对地闪频次的影响。(夏茹娣,张大林)
3.8 北大西洋涛动事件的发生发展机制研究
基于ERA-Interm再分析资料,揭示了北大西洋涛动(NAO)事件与热带季节内振荡(MJO)的可能关系,指出不同类型NAO事件提前2周左右的前期征兆信号为NAO事件在延伸期范围内的预报提供了指导。研究表明,受MJO影响的NAO事件可能是一种北半球环状模(NAM),生命周期较长,大概30天左右;而不受MJO影响的NAO事件可能为经典的局地NAO事件,生命周期较短,大概10天左右。(姜智娜)
3.9 海风环流对海南岛对流系统触发和传播作用的数值模拟
基于1次高分辨率数值模拟,研究了海风环流对海南岛对流系统的触发和传播的作用机制。结果发现,山地对环境风的阻挡效应抑制了迎风坡的谷风环流和海风环流的发展,而在海南岛低地形条件下,较弱环境风速则有利于背风坡的谷风环流和海风环流的发展和合并。背风坡合并的局地环流与较弱环境风在山顶附近产生稳定而强的气流辐合,该气流辐合造成了大量水汽在山地附近堆积,导致比周边地区更大有效位能的产生,从而使得对流系统容易在山顶附近触发。对流系统产生后在环境风的引导下往山地背风坡下游移动,陆续与下游的海风锋及其背后一系列开尔文—赫姆霍兹波相互作用。由于海风锋和这些开尔文—赫姆霍兹波的前沿均为强对流运动区以及丰富水汽堆积区和高有效位能区,造成了对流系统往下游移动时出现“波浪式”传播发展的现象。(梁钊明,王东海,刘英)
4 台风研究
4.1 登陆我国台风降水的日变化信号
基于常规气象站的小时雨量观测资料,通过谐波分析研究发现登陆我国热带气旋降水存在明显日变化信号,波峰出现在凌晨,波谷出现在午后,且热带气旋外围的降水日变化信号比主体环流区域的日变化信号更加明显。在这种日变化信号的影响下,夜间登陆的热带气旋登陆后12 h累计降水量比中午或下午登陆的热带气旋大30%左右(图5)。(胡皓,端义宏,王玉清)
4.2 热带气旋(TC)结构与强度变化的关系
基于高分辨率数值理想试验的分析表明,在涡旋初始强度相同的情况下,尺度较小涡旋快速加强的速率明显快于尺度较大和初始涡旋的速度廓线沿最大速度向外(眼区方向)衰减慢的初始涡旋。TC的快速增强速率(RIR)主要受到惯性稳定度的影响,而涡旋的初始结构决定了惯性稳定度的分布,当初始涡旋尺度较大或者初始速度沿径向衰减慢时,最大风半径外侧的较大的切向速度有利于涡旋获得更多的海表热通量,进而有利于组织形成螺旋云带。大范围的对流云带中的非绝热加热,一方面将边界层中的径向入流沿径向扩展的范围更大,从而减弱边界层中向眼墙的入流;另一方面,眼墙外侧切向速度的增加也增加了眼墙外侧的惯性稳定度,这两方面的综合作用减弱了向眼墙的绝对角动量输入,从而减弱了涡旋加强的速度同时也增加了风暴的内核尺度(图6)。(徐晶,王玉清)
4.3 我国沿海复杂地形上台风风场变化特征
利用1979—2015年ERA-Interim再分析数据、CMA与JTWC最佳路径资料,统计分析我国沿海台湾岛和海南岛附近区域台风外围与内核大风的分布特征。结果表明:(1)当热带气旋(TC)位于在岛屿地形附近时,TC中心与岛屿连线上有正、负涡度带相间分布。一般TC中心附近和岛屿的另一端为正涡度带,TC与岛之间为弱的负涡度区。(2)台湾岛附近区域TC的大风主要出现在台湾岛东侧、东北侧以及台湾海峡内。海南岛附近区域TC大风主要位于岛东北侧附近海域及西北侧北部湾内,岛上风速相对较小。(3)台湾岛附近区域TC的最大风速半径(RMW)均值为51.3 km,小于海南岛附近区域的58.3 km。平均而言,位于台湾岛西侧TC的RMW最大,东北侧最小;而海南岛附近则为岛上TC的RMW最大,西北侧最小。(4)岛屿附近区域TC的34节指定风圈均有一定变形,最长半径均位于台风东部象限。平均而言,台湾岛西北侧台风风圈非对称性最强,海南岛西南侧区域TC风圈形变最大。(李英,薛霖)
4.4 西北太平洋双台风活动气候特征
利用台风最佳路径资料以及NCEP全球再分析资料,采用客观判定标准对1951—2014年西北太平洋两类双台风活动进行识别。得到如下气候特征:1951—2014年西北太平洋一共出现699对双台风活动,其中典型类双台风和非典型类双台风分别为446对和253对,分别占到63.8%和36.2%;典型类双台风的比例随过程最短距离减小而增大,非典型类双台风的比例随过程最短距离减小而减小。双台风活动主要出现在110°~150°E、10°~30°N的洋面上;频发区集中在南海北部和菲律宾以东洋面,台湾岛亦包含其中;双台风活动盛期一般出现在8—9月。典型类双台风过程相互靠近速度最大时刻,双台风对主要表现为东—西向分布,正好受副高南侧东风气流控制,有利于东台风快速靠近西台风;典型类双台风过程逆时针互旋速度最大时刻,双台风对主要呈东北—西南或东北东—西南西向分布,并位于副高西侧和西南方主要受东南风控制,有利于双台风的逆时针互旋。(任福民)
4.5 东风切变和西风切变对西北太平洋热带气旋强度变化影响对比研究
统计分析1982—2015年西北太平洋热带气旋(TC)强度变化与不同方向风速垂直切变(VWS)的关系。结果表明,西风切变与TC强度变化的相关系数(−0.36)要比东风切变(-0.07)大,尤其是与西南风切变相关系数达到−0.43。分析表明,这种相关性的差异与海表面温度(SST)有关,主要是由于SST和纬向VWS存在显著的相关关系(-0.48)。SST随着东风切变增大而增大,而高SST对强度增强有利,可以抵消部分强切变带来的负作用,从而导致东风切变与强度变化相关关系减弱。相反,西风切变增强时SST降低,使得西风切变与强度变化相关关系较强,而最强的相关关系出现在SST为301 K时。所以,建议在目前的强度统计预报模型中考虑VWS的方向(图7)。(魏娜,李英)
5 雷电研究
5.1 特种观测资料同化及雷电灾害天气系统的监测预警方法
利用云分辨率雷暴数值模式开展了闪电激发位置动力微物理条件的分析研究。通过对模拟闪电始发点附近垂直运动速度 (Wini) 和霰粒子质量混合比 (qg-ini) 的分析发现:(1)Wini与单体中最大上升运动速度之间存在3次方的多项式相关,相关系数达到约0.97。(2)多数闪电始发于霰粒子分布区的上部,qg-ini与单体内霰粒子比质量浓度中心值以及闪电的始发高度均相关,相关系数分别达到0.86和0.85。特别是在闪电活动的中期和后期,线性相关更加明显。(3)单体内主正、负电荷区之间的弱净电荷密度区,对于闪电的激发非常重要,通常在霰粒子浓度中心之上到霰粒子分布区上边界之间变化。在这个弱净电荷密度区内多数出现了较强电场强度的位置上,闪电激发位置上的冰晶浓度与霰粒子浓度之比与霰粒子比质量浓度之间存在指数关系。(王飞)
利用中尺度起电放电模式以及卫星和闪电定位等观测资料,对比分析了台风莫拉菲 (2009) 登陆前后以及衰亡阶段的电荷形成和结构。结果表明:莫拉菲在登陆前存在近海加强过程,加强中逐渐形成清晰的台风眼并伴随眼壁区闪电活动的多发。眼壁区对流在近海加强阶段呈现正的三极性电荷结构,主负电荷区位于−25~−10 ℃层之间,其上下各有一个正电荷区。在台风达到最大强度后呈现负的偶极性电荷结构,且仅存在云中部的负电荷区和下部的正电荷区。眼壁区电荷结构同台风强度变化密切相关,不受登陆直接影响。在台风发展的不同阶段,外螺旋雨带对流主要表现为正的三极性或偶极性电荷结构,而之前的研究一般认为外雨带对流只呈现正的偶极性电结构。外雨带三极性电结构的形成类似于眼壁区三极性结构的形成,但同时也存在其他形成机制,即在霰粒子与冰晶组成的正偶极性电荷结构下存在一个由雹粒子组成的正电荷区,从而形成正的三极性电荷结构。台风衰亡阶段对流活动较弱,主要表现为负的偶极性电荷结构,类似于陆地雷暴消散阶段的特性。(徐良韬,张文娟)
5.2 广州塔对附近区域地闪活动特征的影响
基于1999—2015年广东电网地闪定位资料,对广州塔(高600 m)建成前后其附近区域地闪活动的分布特性进行了详细分析。分析发现:广州塔建成后,与其周围10 km范围内回击密度和闪电密度的平均值相比,广州塔周围1 km范围内的回击密度和闪电密度明显大很多,而周围1~4 km范围内的回击密度和闪电密度均比周围10 km范围的平均值要低。闪电定位系统得到的广州塔周围1 km范围内回击电流幅值的算数平均值明显高于10 km范围的平均值,而1 km以外区域的值与大范围的平均值相比没有明显差异。因此,可以推测广州塔不仅会吸引附近一定范围内的下行闪电击中自己,还会触发大量上行闪电,使得击中高建筑物的雷电数量和电磁辐射强度大幅增加,而附近区域的地闪数量有所减少。(吕伟涛,齐奇,马颖,姚雯)
5.3 触发闪电始发阶段特征
上行正先导(UPL)是上行负地闪始发及下行负地闪连接中的重要放电过程,但由于观测困难其始发机制仍不清楚。为此,基于2014—2015 年广东野外雷电综合观测试验中获取的人工触发闪电通道底部电流和近距离电场等同步观测资料,分析了触发闪电上行正先导(UPL)整个起始阶段的放电特征。结果表明:UPL 起始阶段通道底部电流波形表现为不连续的脉冲形式,以单个或者成组的形式出现,其中UPL连续传输之前的电流脉冲峰值、10%~90%上升时间、波形持续时间、半峰值宽度、转移电荷量、脉冲时间间隔的几何平均值分别为28 A、0.33 µs、2.3 µs、0.73 µs、27 µC、25 µs,而连续传输开始时刻的电流脉冲相应的波形参数几何平均值分别为32 A、0.54 µs、3.5 µs、0.93 µs、46 µC、24 µs,两者相比连续传输开始时电流脉冲具有更大的转移电荷量。同时,UPL 对应的近距离电场波形呈现出明显的梯级变化,每个电场脉冲与通道底部电流脉冲具有良好的时间对应关系,这表明触发闪电UPL在起始阶段表现出了梯级的发展特征。(张阳,张义军,吕伟涛,郑栋,徐良韬)
5.4 闪电始发阶段的精细放电过程
从2016年开始发展了具有亚微秒、米尺度分辨率的闪电连续干涉仪,用以研究闪电击穿放电活动。2016年6月9日在广东闪电综合观测试验中观测到一例触发闪电,在火箭上升的883 ms时间内,共产生了54次明显的闪电始发先驱放电。连续干涉仪观测结果表明:这些先驱放电是一种发生在上升火箭头部的击穿过程产生。每次先驱放电事件始于向上发展的正击穿,发展尺度为几米,速度约为5×10⁶m/s,跟随着更强、更快的向下的负击穿,发展尺度达到几十米,平均速度约为3×107m/s。之后伴随14个密集的、爆发式先驱脉冲簇的出现,稳定的上行正先导开始,且甚高频辐射迅速变得连续。值得注意的是,稳定发展的上行正先导的击穿特性展现了与前面先驱脉冲相似的形式。该研究为触发闪电机制和正击穿过程研究提供了非常有价值的发现(图8)。(张阳,张义军,吕伟涛,郑栋)
5.5 华南人工触发闪电初始阶段和回击电流特征
开展了华南地区50例人工触发闪电的初始阶段和回击过程的电流特征的分析研究。结果发现,相比于其他地方的人工触发闪电,华南负极性触发闪电的初始阶段具有更长的持续时间,更大的平均电流、电荷传输和比能量,其几何平均值分别为347.9 ms、132.5 A、45.1 C 和10.0×10³A2s。2次没有回击过程的正极性触发闪电相比负极性触发闪电产生了较大的平均电流、电荷传输和比能量。华南触发闪电回击过程的峰值电流、回击1 ms内电荷传输和回击1 ms内电荷比能量的几何平均值分别为17.2 kA、1.3 C和5.8×10³A2s,大于其他地方人工触发闪电的对应值。华南人工触发闪电回击电流10%~90%上升时间几何平均值为0.4 µs,小于其他地区。上述情况意味着华南人工触发闪电具有更强的放电特征。研究表明,回击峰值电流与电流上升陡度、回击1 ms内电荷传输和回击1 ms内比能量之间具有显著的相关关系。此外,当回击及其随后的延续电流持续时间超过40 ms时,回击峰值电流、1 ms内电荷传输和比能量很少出现大于25 kA、2.6 C和1.5×10³A2s的情况。研究指出,包含回击的触发闪电相比于没有回击的触发闪电倾向具有更长持续时间但较小电荷传输的初始阶段。回击的峰值电流与发生该回击之前通道内部没有电流阶段的持续时间呈现一定的相关性。(郑栋,张义军,张阳,吕伟涛)
5.6 一次超级单体的闪电尺度时空特征
对一次超级单体过程中的闪电尺度特征及其与雷暴结构关系研究发现,在超级单体演变过程中平均闪电尺度与闪电频次和雷暴发展强度之间呈现反相关,其中平均闪电尺度与闪电频次可以用一元幂函数关系拟合,相关系数可达到−0.87。此外,5 km高度大于30 dBz的反射率面积除以闪电频次后,与平均闪电尺度具有显著线性相关,相关系数为0.88。从水平分布看,沿超级单体移动方向,从对流区附近到前侧云砧区,平均闪电尺度由小到大变化。平均闪电尺度最小值所在区域通常与闪电起始密度和闪电扩展密度的大值中心区相对应。平均闪电尺度和闪电扩展密度的空间分布具有幂函数的反相关关系,在超级单体一半的雷达体扫时次中相关系数绝对值大于0.5,且相关性与超级单体发展强度具有正向对应关系。在垂直方向上,闪电起始和闪电扩展密度高值区较为接近,但对应高度的闪电尺度通常较小。在对流区及其附近,平均闪电尺度在上述高度以下呈现明显增大趋势,在低层4~5 km达到峰值,在对应高度以上,维持小值或稍有增大。闪电尺度与闪电活动强度和超级单体发展强度的时空反相关关系可能是由于雷暴强对流阶段或区域具有较小但密集的电荷区所致。(郑栋,张义军)
5.7 雷暴闪电活动与垂直气流的关系
利用闪电探测、双雷达三维风场反演数据和雷达反射率数据,发展了一种新的基于闪电数据的雷暴单体判别方法,针对该方法所识别出的多个对流单体,研究了雷暴垂直气流特征与地闪活动的空间对应关系、量化关系以及在地闪起始和结束时的差异。发现雷暴内大多数(79.1%)地闪出现在0 ºC高度垂直速度在-5~5 m/s的弱上升和弱下沉气流区,更偏向于出现在弱上升气流区,特别是对于负地闪以及雷暴发展阶段的地闪。地闪频次与一定阈值条件下的上升气流体积之间存在相关关系,成熟阶段最强(r=0.70),其次是消亡阶段(r=0.66)和初始阶段(r=0.60)。高度为7~11 km的冰相物垂直通量绝对值之和与地闪频次关系更为密切,对应上述雷暴3个阶段的相关系数分别为0.73、0.71和0.74。地闪起始时,上升气流体积所占比例占据主导(79%);地闪结束时,下沉气流体积所占比例占主导(82%),但雷暴内最大上升速度、10 m/s和20 m/s上升速度所能达到的最大高度在首次地闪和最后一次地闪发生时差异较小,说明闪电活动对上升气流强度的依赖性。研究推测,具有较为明显分层特征的大范围电荷区分布相比小电荷区交错分布的形态更有利于地闪的发生。(郑栋,张义军,刘黎平)
5.8 低频电场变化探测阵列(LFEDA)的建设和初步结果
利用低频和甚低频频段探测全闪活动是近年来闪电探测技术发展的一个重要方向。中国气象科学研究院于2014—2015年在广州地区建设了由9个快电场变化测量仪构成的低频闪电电场探测阵列(LFEDA)。基于蒙特卡罗法和人工触发闪电试验对LFEDA的定位精度和探测效率进行了理论模拟和客观评估。前者表明站网中具有较长基线的定位站有助于改善垂直于该基线方向的水平定位精度和沿着该基线方向的高度定位精度;后者表明LFEDA对触发闪电事件和回击的探测效率分别为100%和95%,回击平面定位误差平均值为102 m。定位结果与雷暴结构的对比分析表明,闪电脉冲放电事件与反射率柱所表征的对流特征较强区域有较好对应,脉冲放电事件在垂直方向上呈现合理的分布。单次云闪、地闪的定位结果发现,LFEDA能够描绘闪电发展形态,基于三维定位结果获得的云闪初始阶段垂直发展速度以及地闪先导垂直发展速度变化趋势与之前观测结果类似。LFEDA具备了全闪电三维定位能力,为闪电发展特征研究以及雷暴电学研究提供了新的技术手段。(郑栋,张阳,张义军,吕伟涛)
5.9 闪电初始阶段和尺度判别方法及其特征
基于LMA三维闪电定位数据,对2004年10月5日发生于美国新墨西哥州的1s次超级单体过程的闪电初始及其尺度特征进行研究,提出闪电初始阶段自动判别及其特征参量提取方法,并给出参量分布特征。结果显示:闪电初始阶段上行负先导(下行负先导)的持续时间中值为13.5 ms(7.5 ms),三维位移中值为1.4 km(1.0 km),三维平均位移速度中值为9.2×10⁴m/s(1.2×105m/s),上行负先导速度随时间递减,下行反之,二者与垂直方向夹角的中值分别为40°和54°。表征闪电尺度的闪电凸壳面积和闪电总长度的概率密度呈负幂函数分布,在小值方向分布更为集中。闪电水平延展距离中值为6.1 km,垂直延展距离中值为4.3 km,约83%的闪电其水平延展距离大于垂直延展距离;闪电的持续时间中值为271.0 ms。分析发现,以水平延展为主的闪电起始高度分布峰值位于8.5 km,以垂直延展为主的闪电起始高度分布峰值位于11 km。闪电初始阶段位移方向越接近水平对应闪电垂直延展越小,说明闪电初始段的传播方向对于闪电垂直延展具有重要影响。(郑栋,张义军)
5.10 雷电野外综合观测试验
开展了第12年度的广东闪电综合观测试验和第1年度高原雷暴闪电活动观测试验,在人工触发闪电、放电过程精细化观测、雷暴的全闪探测以及雷电物理过程研究等方面获得了显著进展。(1)成功人工触发闪电16次,触发闪电成功率约80%,触发次数、成功率和触发效率,都保持了较高的水平。(2)完善了连续干涉仪精细化定位技术,实现了连续干涉仪的长预触发采集存储,获得了触发闪电和自然闪电全放电过程通道发展的高时间分辨率、精细化描绘。(3)进一步完善了闪电低频电场探测阵列,整个系统在全年开展了雷暴过程的持续性观测。进一步开展了三维定位算法的优化研究,基于信号处理技术,显著提高了低频电场变化探测阵列(LFEDA)定位数据的精细化和丰富程度。(4)首次实现了对闪电始发不稳定放电-先驱放电辐射过程的超精细化解析,获得了对始发放电过程和辐射机理的新认识。(5)调整和优化了广州高建筑物雷电观测方案,进一步提高了雷电综合观测能力。基于广东电网地闪定位资料,对高建筑物建成前后其附近区域地闪活动的分布特性及不同高度建筑周围地闪活动分布特征的差异进行了详细分析。(6)首次在高原建设了包括8个子站的三维全闪定位阵列(闪电低频电场探测阵列),实现了对高原雷暴闪电活动的观测和定位,初步定位结果显示了对高原闪电活动三维定位的可靠性。(张阳,吕伟涛,郑栋,张义军,姚雯,马颖,徐良韬,齐奇,王飞,范祥鹏,樊艳峰)
6 模式关键技术和再分析资料研究
6.1 天气气候一体化模式关键技术研究
在模式动力框架方面,针对非结构网格的技术特点,对新动力框架进行了整体设计,并建立了球面非结构网格计算模拟系统。该系统采用易于并行化扩展的间接索引型数据结构,包含模式运行所需的网格文件,球面算子库,方程求解器和数据读写工具等,已初步形成一个数值模式动力框架雏形,可集成多种球面原型物理问题的全球准均匀和变分辨率模拟。基于计算模拟框架,发展了球面非结构网格高精度算法,并将其应用于两类物理问题的模拟:标量平流问题和位涡传输问题。结果显示,在标量物质传输问题中,采用高精度算法可有效减小低精度算法的计算误差。在位涡传输问题中,当模式采用迎风型高阶位涡传输后,有效抑制了位涡拟能的增长,消除了涡度场的噪音问题,并减少了计算误差。在模式物理过程方面,引入了气溶胶辐射方案,形成可用于参加CMIP6试验的大气模式版本。耦合模式方面,完成参加CMIP6的气候系统模式CAMS-CSM定版;完成CMIP6强迫数据下载与制作,并为模式编写相应读取模块;完成气溶胶模块开发;利用CAMS-CSM模式初步开展了CMIP6计划DECK系列试验,评估结果显示该版本能成功抓住全球气候大尺度环流和主要变率模态的主要特征,为最终开展CMIP6试验奠定了坚实基础(图9)。(张祎,陈昊明,容新尧)
6.2 东亚区域大气再分析研究进展
进一步改进和优化了东亚区域再分析系统,使该系统能够长时间稳定连续运行。改进了雷达径向风同化算子和雷达反射率组网技术,在雷达数据同化应用方面取得明显进展。在探空资料方面,对比分析了东亚区域大气再分析应用的探空资料与GDAS探空资料数量和垂直层次,并针对2种资料开展了同化试验和对比分析。利用优化后的东亚区域大气再分析系统开展了1年的再分析数据的研制,并对结果进行评估。结果表明,研制的再分析数据在中国区域内整体性能优于ERA-Interim数据。(梁旭东,尹金方,陈锋,谢衍新,刘英,何会中,邹海波)
6.3 中国东南地区降水的2种集合预报综合偏差订正的对比分析
利用2015年6月1日至7月31日3个全球数值预报业务中心(CMA、ECMWF和NCEP)的24 h降水集合预报资料和我国东南地区降水观测资料,采用贝叶斯模型平均方法(A方案)和基于贝叶斯模型平均方法的统计降尺度模型二次订正方法(B方案)对上述3个中心和多模式超级集合降水预报进行订正,并对比2种方案的订正效果;最后用2015年8月1—31日资料进行独立样本检验,分析订正前后的降水预报效果。结果表明:以第50百分位的降水预报为例,经A方案订正后各中心和多模式的集合平均消除了大量的小雨空报,其对小雨、中雨的订正效果很明显,对大雨以上的降水量级订正效果不明显。随着降水阈值增加,A方案的订正效果随之减弱。此方案对雨带走向的订正不明显,会使降水大值区量级降低甚至消失。采用B方案订正后,不仅可降低原始集合预报的空报率,还可对降水量级和落区进行订正,使降水预报的范围和量级与实况更接近,但对大量级降水,如50.0 mm以上的降水量级订正效果仍然不显著(图10)。(杨瑞雯,赵琳娜)
7 试验与研究平台
7.1 大气科学试验与研究平台(原科研数据共享平台)进展
完成科研数据共享平台(一期)建设,已上线运行,提供在线数据共享服务。平台二期建设得到了中国气象科学研究院基本科研业务费的支持,顺利立项。计划用3年(2017—2019年)时间完成大气科学试验与研究平台建设。建设内容包括:(1)研制大气科学试验数据标准规范;(2)大气科学外场试验数据资源建设;(3)科学试验场景可视化展示;(4)完善共享平台。(高梅,张文华,李斌,朱孔驹)

图1 2017年6月4日云雷达和C波段连续波雷达观测数据融合的回波强度(a)、径向速度(b)和数据的来源(c)(图c中,黑色、绿色、蓝色和红色分别表示数据来自云雷达第1观测模式、第2观测模式、第3观测模式和连续波雷达)Fig.1 Time-height cross-sections of reflectivity on 4 June 2017: (a) the merged reflectivity; (b) velocity; (c) data sources for reflectivity and velocity.The black dots in (a) and (b) indicate the CEIL-derived cloud-base heights.In (c), data from CR1, CR2,CR3 and CVPR are shaded in black, green, blue and red, respectively
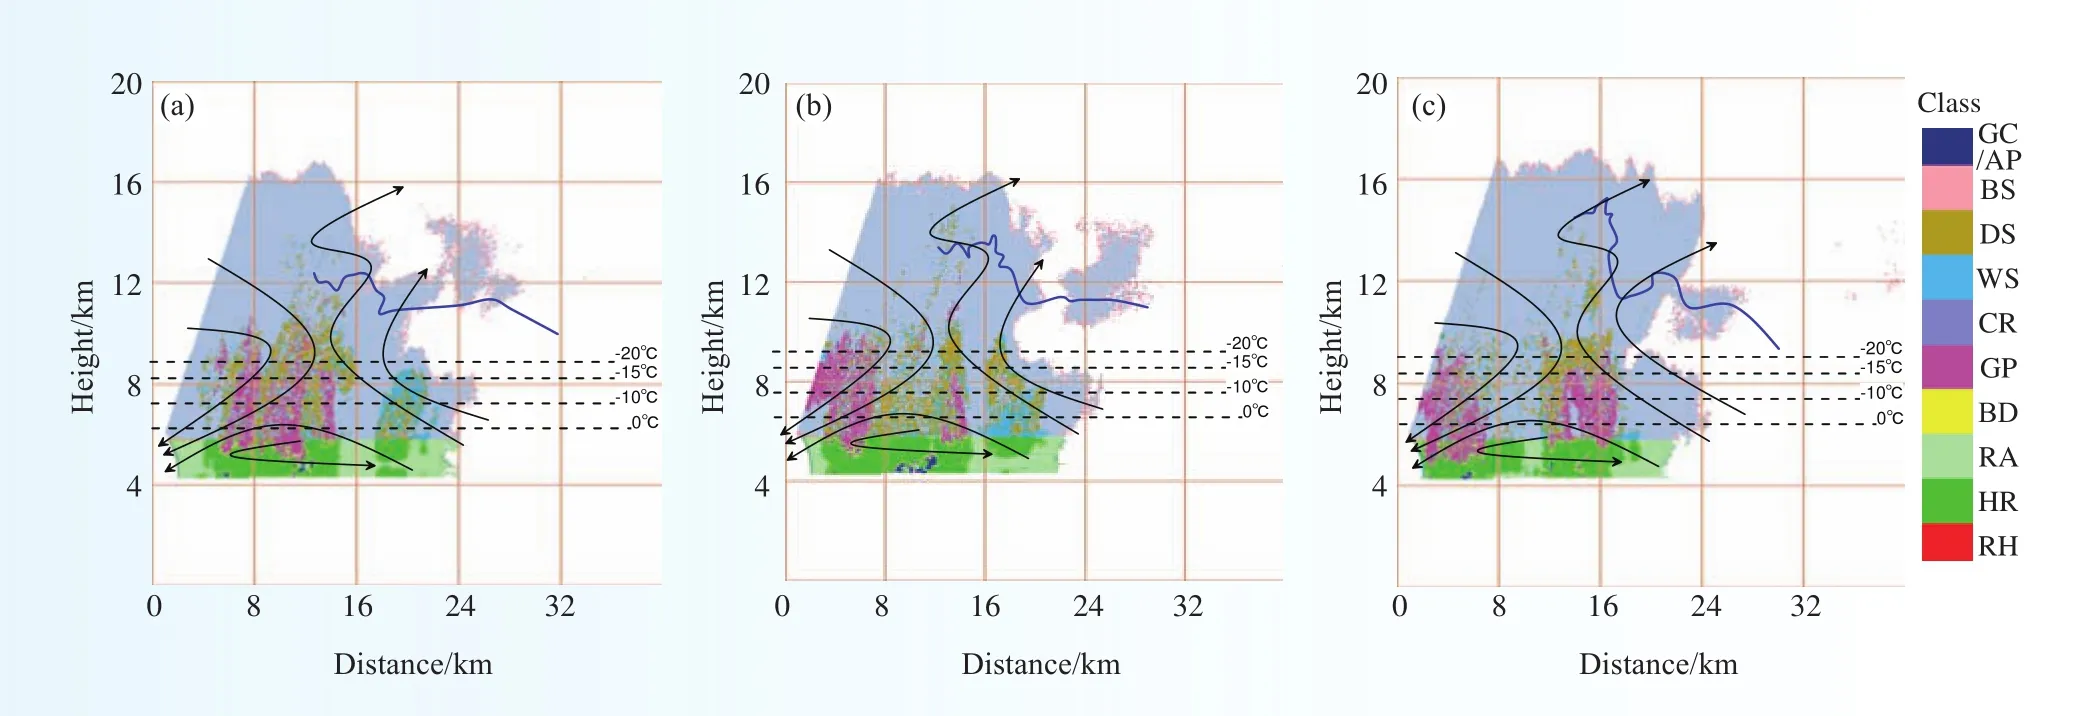
图2 2014年8月5日相态识别的RHI扫描图:(a)为15∶41,方位角167°;(b)为15∶46,方位角162°;(c)为15∶51,方位角157°(图中蓝色实曲线表示水平风速为0的“零线”,黑色带箭头实曲线表示流场,虚直线分别表示探空-20 ℃、-15 ℃、-10 ℃、0 ℃温度线)Fig.2 The RHI of Class identification, wherein (a) at 1541 BST in azimuth 1670, (b) at 1446 BST in azimuth 162° and (c) at 1551 BST in azimuth 157°.The blue curves represent the “zero contour”, the solid curves with arrows represent the flow field,and the dotted straight lines are the sounding isotherms of -20 ℃, -15 ℃, -10 ℃, and 0 ℃, respectively

图3 ISCCP卫星资料观测到的夏季青藏高原对流系统(TCS)数目分布(a);高原地区夏季TCS移出的数目(等值线)及移出高原概率(阴影)分布(b); (c) 和(b)一致,但为无法移出高原的分布Fig.3 (a) Spatial distribution of genesis of TCSs based on ISCCP dataset (1998–2004 JJA) on a 1°× 1° grid.(b) The number(contour) and probability (shaded) of TCSs that move out of TP.(c) Same as (b) except for TCSs that did not move out.The blue and red boxes represent central TP and eastern TP, respectively.The dotted contours show the topography at 3000 m and 5000 m
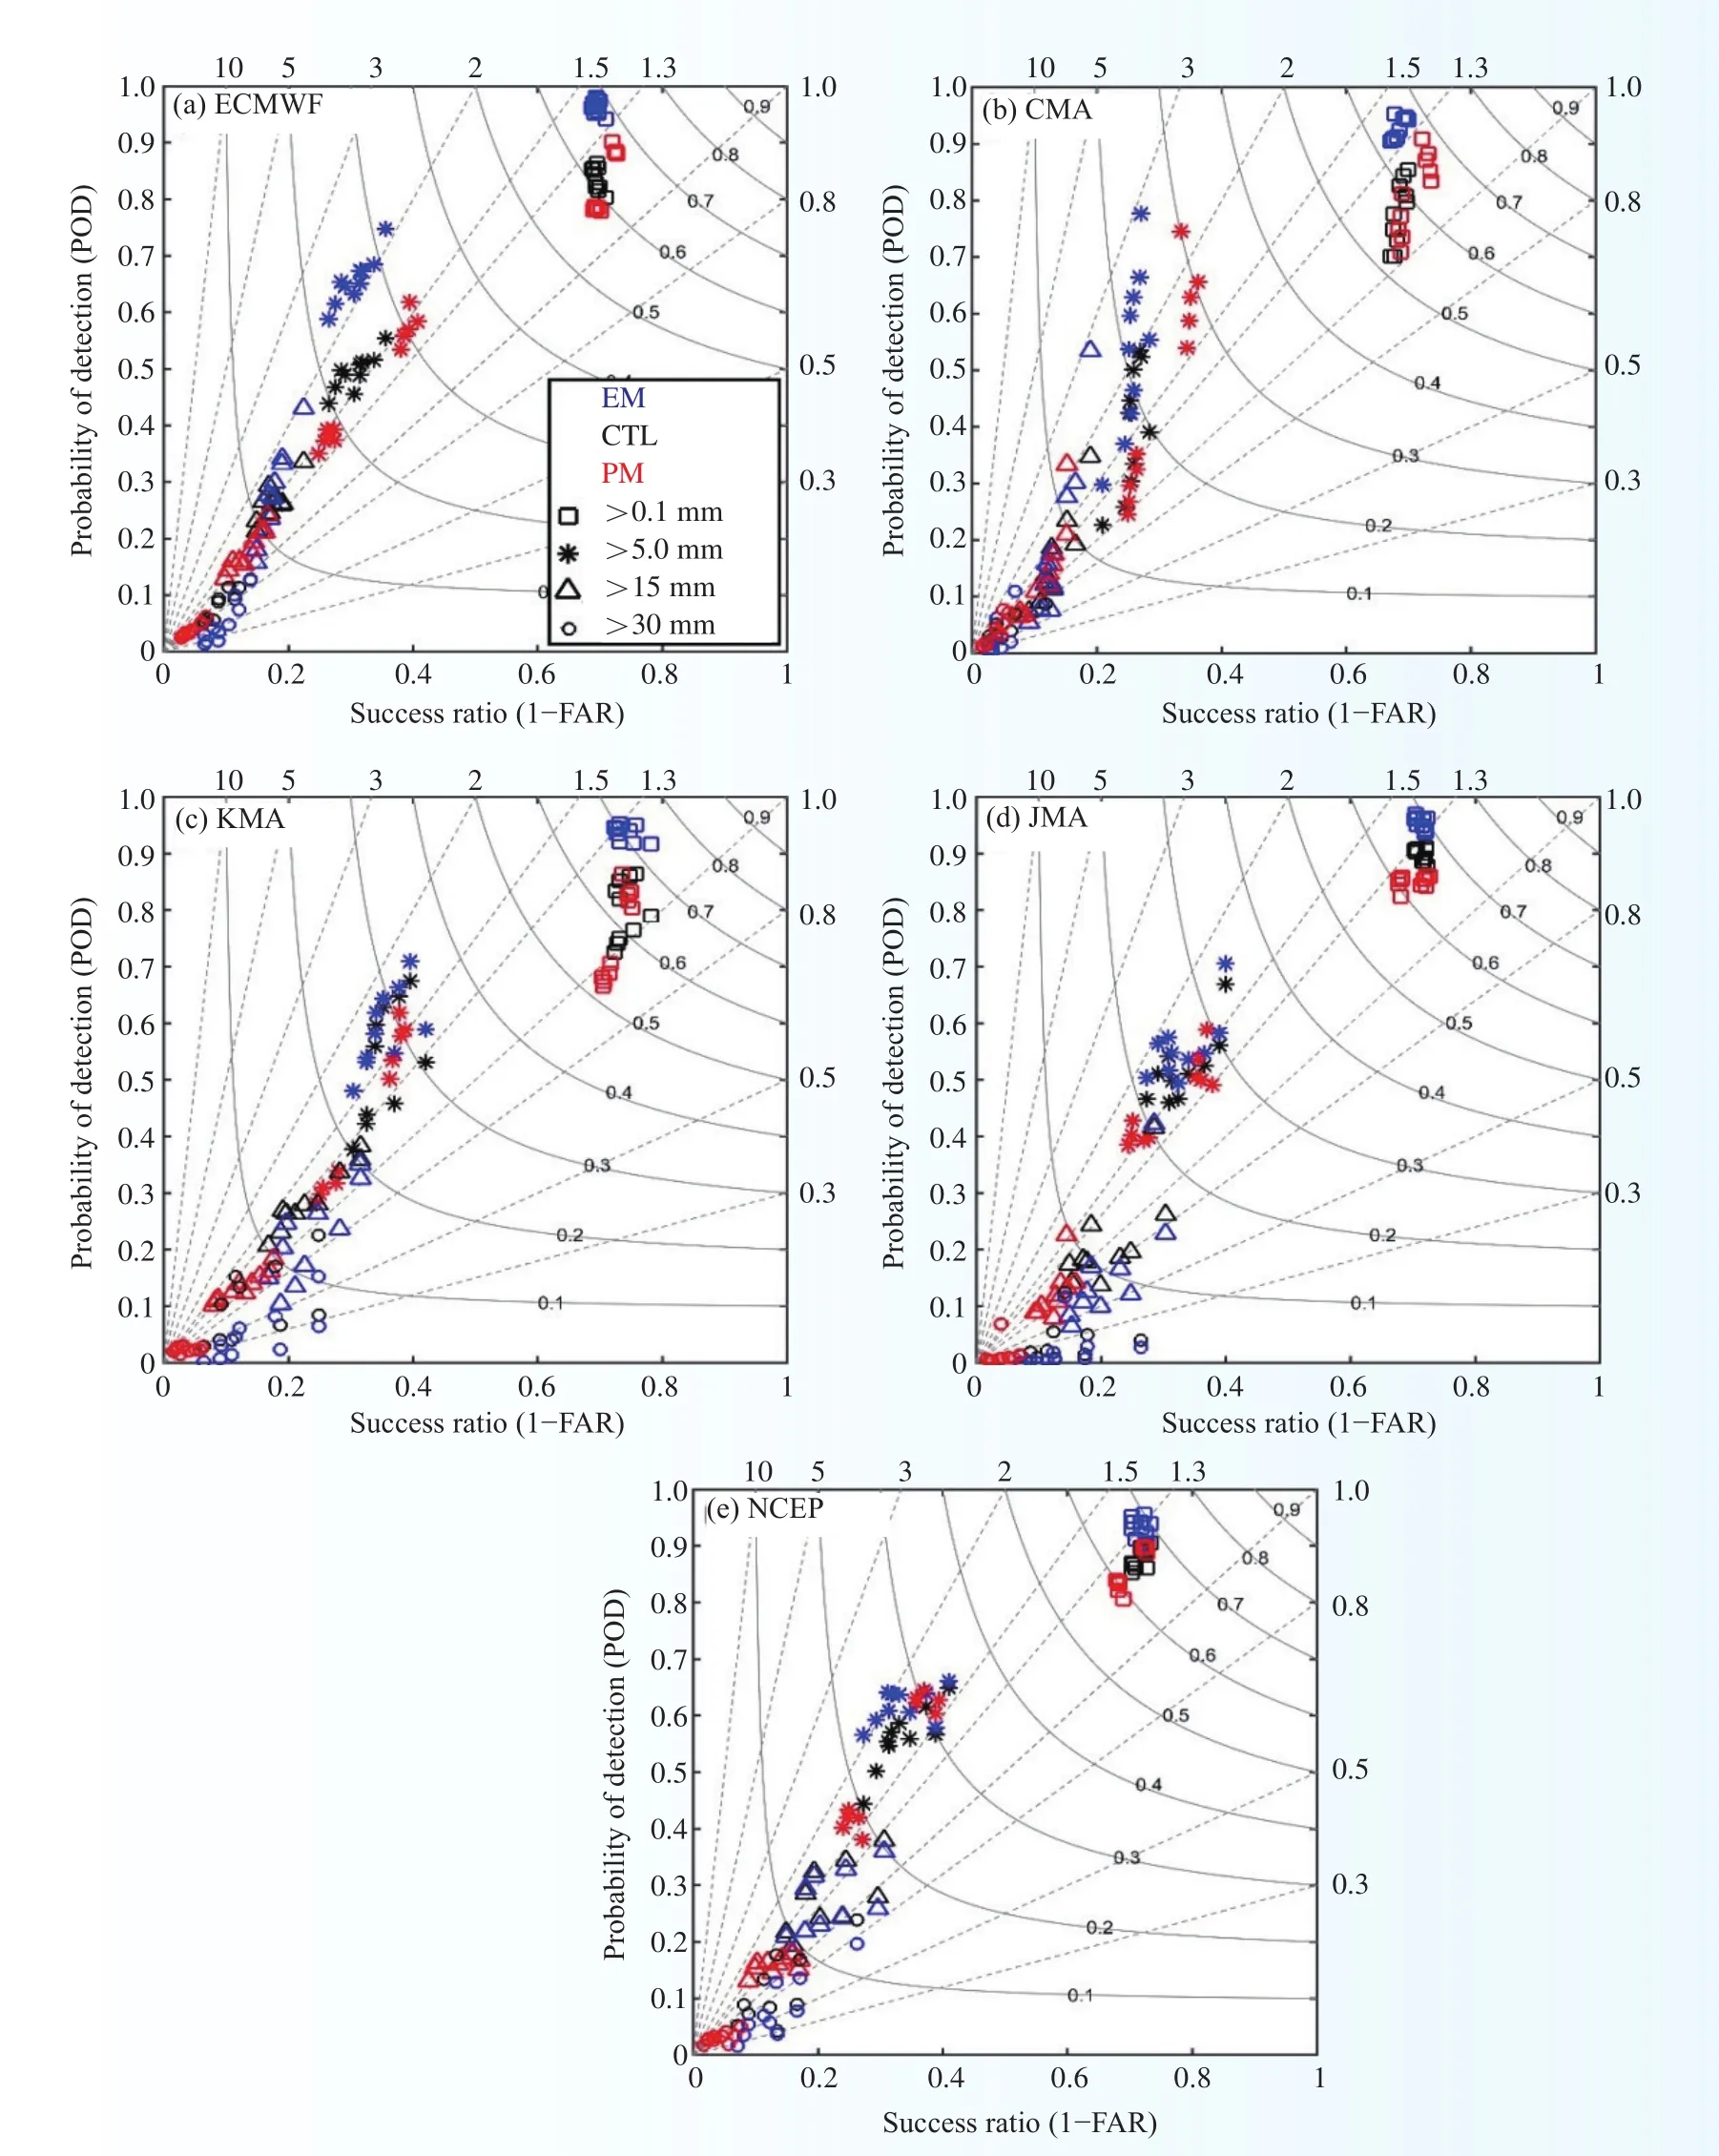
图4 全球五大业务中心的集合预报系统对华南2013—2015年4—6月0~5天逐12 h累计降水量的预报性能(X 轴表示成功率,即1减去虚报率,Y 轴表示预报成功的概率;灰色虚线表示概率偏差,实线代表TS评分;蓝色、红色和黑色符号分别代表集合平均、概率匹配和确定性预报的评估结果;正方形(星号/三角形/圆圈)表示评估的降水阈值为0.1(5.0/15.0/30.0)mm/12h;每个集合预报系统在每种阈值下有10个符号,代表每隔12 h共5天的预报)Fig.4 Performance diagram of (a) ECMWF, (b) CMA, (c) KMA, (d) JMA, and (e) NCEP, for the EM (blue), PM (red), and CTL (black) forecasts of the 12 h accumulative precipitation during April−June 2013−2015.The X-axis refers to the success ratio, i.e., one minus the false alarm ratio (1-FAR).The Y-axis is the probability of detection (POD).The dashed lines indicate the frequency bias (FBIAS), while solid curves show the threat score (TS).The squares (asterisks/triangles/circles) indicate the performance at a threshold of 0.1 (5.0/15.0/30.0, resp.) mm/12h.Each EPS, at each threshold, has 10 symbols for the forecast periods from 12 hours to 5 days, at every 12 h interval

图5 (a) 登陆台风距离台风中心不同半径圆环内(自0~1000 km每100 km一个圆环)降水率距平百分比的日变化信号(黑色实线,其中红色实线和蓝色实线分别代表谐波分析后得到的一波和二波信号);(b) 标准化的台风登陆后12 h内累积降水量随登陆时间的变化(其中黑色、红色和蓝色实线分别代表距离台风中心0~900 km、0~400 km以及400~900 km范围内降水量的平均)Fig.5 (a) Smoothed diurnal cycle in rain-rate percentage anomaly averaged in each 100 km annular area as a function of local time (black curves) up to the annulus between 900- and 1000 km radii.Red and blue curves indicate the diurnal and semidiurnal harmonics, respectively; (b) Standardized cumulative precipitation within 12 h after landfall as a function of landfalling local time.Black, red, and blue curves indicate the average annuli between 0- and 900 km, between 0- and 400 km, and between 400-and 900 km radii from the storm center, respectively

图6 数值理想模拟台风强度随时间变化:(a)为10 m 最大风速;(b)为中心最低气压(细线为集合预报试验,粗线为集合平均;蓝线表示初始涡旋最大风半径为100 km;红线表示初始最大风半径为60 km,径向风廓线虽半径缓慢变化;绿线为初始最大风半径为60 km,径向风廓线随半径缓慢变化)Fig.6 Time evolutions of maximum 10 m wind speed (m s−1) and minimum central sea level pressure (hPa) in experiments R60B10 (blue), R60B05 (red), and R100B10 (green).Shown are results for all individual runs (thin) and their ensemble mean(thick) for each experiment.The two dashed horizontal lines indicate storm intensity between 25 m s−1 and 45 m s−1, helping identify the starting and ending times of the RI period for the three experiments (see text for more details)

图7 不同SST环境下热带气旋24 h强度变化和东(灰色线)/西(黑色线)切变的相关关系及对应样本数(柱状)(线上实心代表相关系数通过95%显著性检验,空心代表未通过检验)Fig.7 Moving correlation between TC 24 h intensity change and zonal VWS with respect to various SST at 0.5 K intervals(line) and the corresponding samples (bar).The solid marks on line indicate the corresponding correlation is significant at 95%conf i dence level, while the hollow ones are not statistically significant
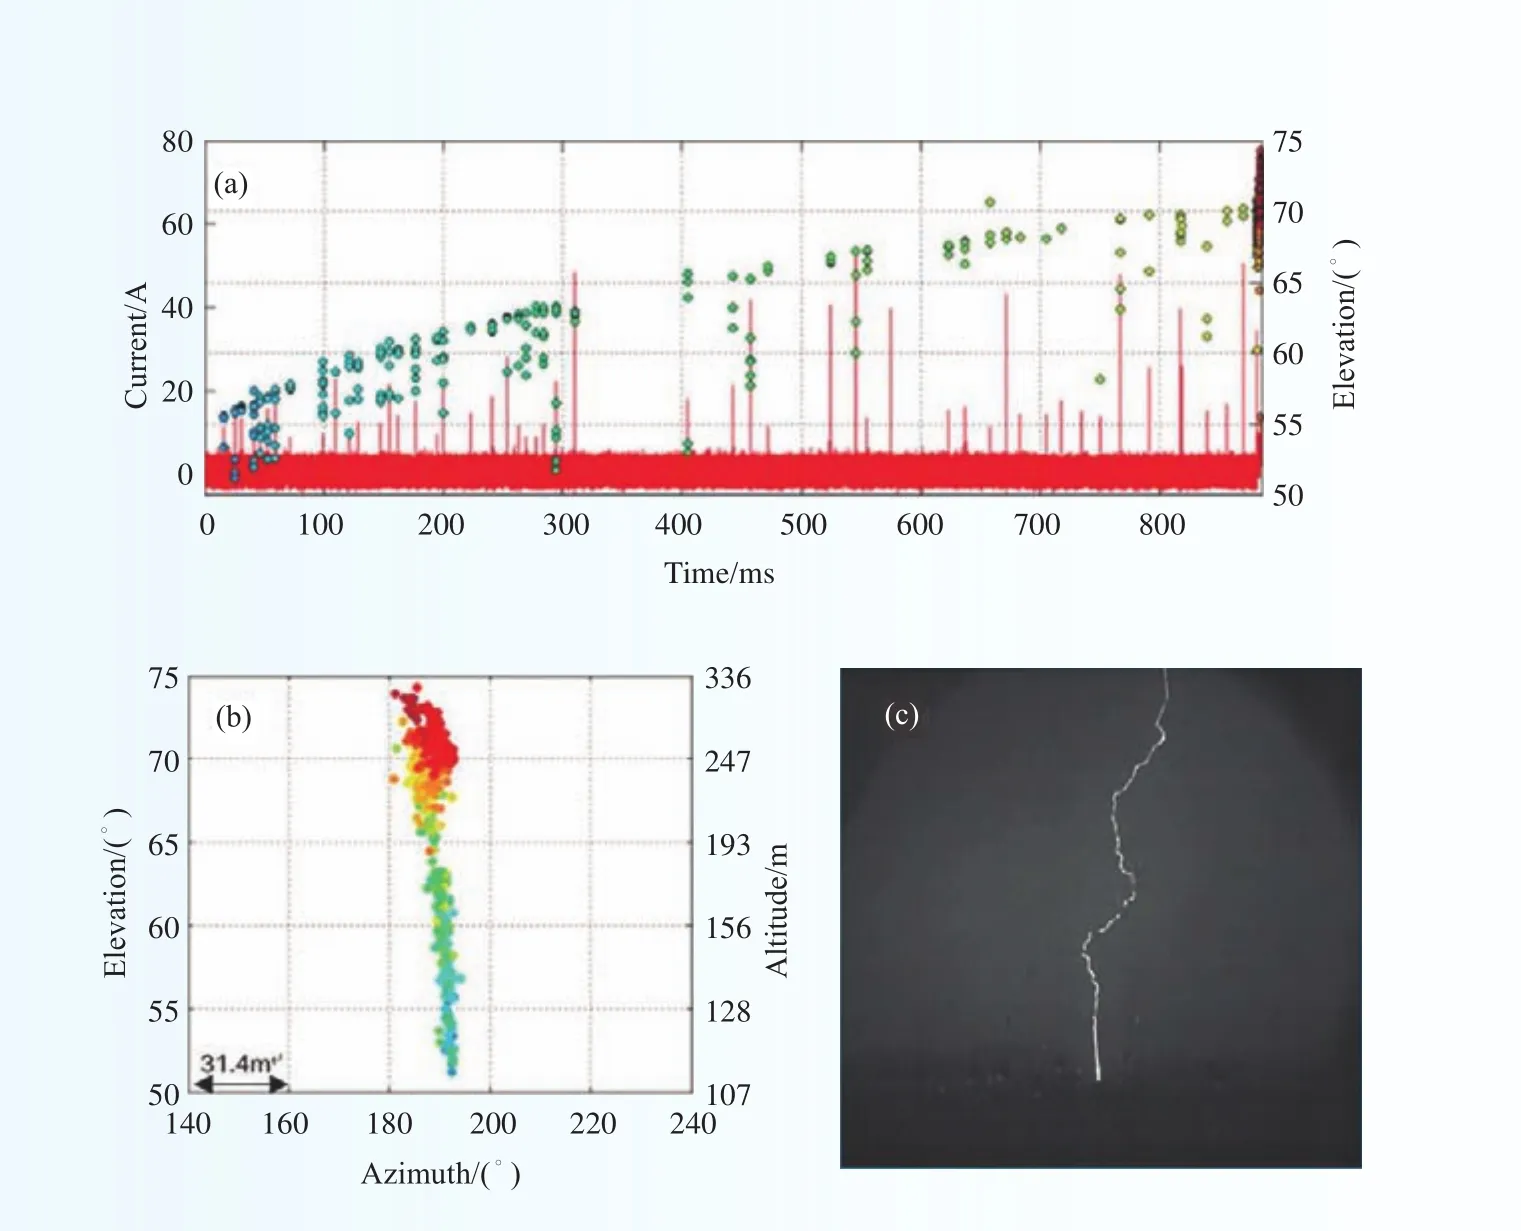
图8 闪电始发先驱放电的辐射源定位和高速摄像记录Fig.8 Radiation source location and high speed images of precursor discharge during lightning initiation stage

图9 采用非结构网格计算模拟框架进行的标量物质传输测试(a~d为4种不同的传输算法的计算结果,测试算例为变形流场+高斯山)Fig.9 Scalar transport tests using the unstructured grid modeling system, (a−d) computational results from four different transport methods, the selected test case is deformational flow of two Gaussian hills
Advances in Severe Weather Research
1 Severe weather monitoring technology
1.1 Microphysical structures of cloud and precipitation observation and radar data merging algorithm in South China
To improve our understanding of the cloud and precipitation properties in South China, the field campaigns on heavy rainfall were carried out by Chinese Academy of Meteorological Sciences (CAMS) in 2017.Vertical structures of nonprecipitating and precipitating clouds, 3D structures of strong convective precipitations have been observed with X band phased array radar, a Ka-band solid-state transmitter cloud radar (CR), a C-band frequency modulated continuous wave (CVPR) vertical pointing radar (CVPR) and a laser ceilometer (CEIL) in Guangdong Province, China.We evaluated the ability of the two radars to deliver consistent observational data and developed an algorithm to merge the CR, CVPR and CEIL data.CR plays a key role in high-level cloud observations, whereas CVPR is important for observing low- and mid-level clouds and heavy precipitation.CEIL helps us diminish the effects of “clear-sky” in the planetary boundary layer.The corrected CR reflectivity and velocity data were then merged with the CVPR data and CEIL data to fill the gaps during the heavy precipitation periods and reduce the effects of Bragg scattering and fog on cloud observations in the boundary layer (Fig.1).(Liu Liping, Ruan Zhen, Cui Zhehu)
1.2 Advances in chinese dual-polarization and phased-array weather radars: observational analysis of microphysical and dynamical processed in a supercell in South China
In the summer of 2016, a joint radar observation of one phased-array weather radar and two polarimetric weather radars, which represent the advance of radar technique in China, was deployed in Foshan area for the study of severe storms over South China.The advantages of above dual-polarization and phased-array radars are discussed through the observational analysis of a supercell on 9 May 2016.The polarimetric signatures within the supercell are associated with specific microphysical processes that can reveal different stages of storm evolution.The hydrometeor classification algorithm (HCA) is a more straightforward and reliable method for nowcasting than conventional algorithms, which makes it possible for further recommendation in China.During the mature and dissipating stages of this supercell, observations of phased-array radar show detailed changes on short time scales that cannot be observed by parabolic-antenna radars.The convective trigger and megger of new cells are found in the peak-inflow region, and formation and dissipation of the hook echo are associated with the relative intensity of inflow and outflow.The above results demonstrate that the phased-array and dual-polarization radars recently developed in China are powerful tools for better understanding the storm evolution for nowcasting and scientific research.(Liu Liping, Wu Chong)
1.3 Convective cloud structures with dual polarimetric radar in Naqu, Tibet
Based on the data in July and August, 2014 in Naqu region, Tibet, detected with the mobile C-band dual polarimetric radar (C-POL) and Chinese new generation weather radar in Naqu (CINRAD/CD), the hailstorm cell and its dynamical, microphysical and thermodynamic characteristics are detailed by means of dual Doppler radar wind field retrieval and dual polarization radar hydrometeor class identification technique.In the RHI(range height indicator) images of ZH, ZDR and Class, the whole dynamical and microphysical processes can be obviously seen where the hydrometeor particles raise and grow up following the “zero line” and accompanying the echo intensity increase, then form a hail wall dropping down in the other side of the main updraft after overtaking it.From the successive three RHI scans, the phases of particle change from wet snow to hailstorm during the evolution process are found in one convective cell.The height of the echo is lower and its intensity is very weak when the cell is just triggered.However, when a large amount of wet snows appear in region above the melting level, it always hints that the updraft is so strong that the wet snows are brought back to high levels while they have not completely melted in the air below the melting level.Through physical processes such as condensation, rime, and attachment, the wet snow can rapidly grow into hailstones in just over 10 minutes.During the re-condensation of wet snows, the unstable structures are promoted and the updraft and downdraft are strengthened further because of latent heat release.Therefore, if numerous wet snows appear in a newly generated weak echo region above the melting level, it usually indicates that the strong updraft occurs in the region and a strong cell will develop rapidly.The configuration of wind field in different heights obtained by 3D wind field inversion shows that the existence of wind shear not only provides horizontal rotation, but also accelerates the vertical circulation.This is conducive to the conversion of unstable potential energy to kinetic energy, and cells can develop rapidly (Fig.2).(Hu Zhiqun)
1.4 Climatological beam propagation conditions for China
The vertical refractivity gradient (VRG) is critical to weather radar beam propagation.The most common method to calculate beam paths uses the 4/3 Earth radius model, which corresponds to standard refraction conditions.VRG spatial and temporal variations in the first kilometers above the surface are explored using 6 years sounding observations.Under the effects of both regional climatic and topographic conditions, VRG values for most of the radars are generally smaller than those of the standard conditions for much of the year.There are similar or slightly larger values at only a few radar sites.Smaller VRG values are more frequent and widespread, especially during rainy seasons when weather radar observations are important.In such conditions, beam heights estimated using standard atmospheric refraction are overestimated relative to actual heights for most of the radars.Underestimates are much less common and of much shorter duration.However,height deviations are acceptable for being well within the uncertainty of radar echo height owing to the 1°beamwidth.In coastal areas and the middle and lower reaches of the Yangtze River, radar observations should be applied with much more caution because of the greater risk of beam blockage and clutter contamination.This work better documents propagation conditions for radar electromagnetic waves and helps fully benef i t from observations taken from the new-generation weather radar network in China.(Wang Hongyan)
2 Research on weather over the Tibetan Plateau
2.1 The regional difference of TCSs in boreal summer
The Tibetan Convective Systems (TCSs) observed over the southeastern Tibetan Plateau (TP) in boreal summer show two local maximum centers in the central and eastern TP.Results indicate that there are more TCSs in the eastern TP than in central TP.20%−30% of TCSs over the eastern TP are associated with shear line, vortex, and low pressure systems, while 70%−80% of TCSs are formed locally.In contrast, 50%−70%of TCSs over the central TP are linked to synoptic weather systems.TCSs over the eastern TP tend to have smaller size, higher humidity, and more rainfall than those over the central TP, and also more likely to move out of the TP.TCSs are mostly generated in mid-afternoon with more rainfall in evening over the central TP and in midnight over the eastern TP (Fig.3).(Hu Liang, Xu Xiangde, Zhao Ping)
2.2 Large-eddy simulation (LES) of shallow cumulus over the Tibetan Plateau (TP)
Shallow cumulus (ShCu) forced by the surface sensible heat flux (H) and latent heat flux (LE) over the TP are simulated by a LES model.The macroscopic variables of ShCu (horizontal scale spectrum, cloud bottom height, cloud friction, vertical velocity in ShCu, etc) are calculated.The focus of the study is on the influence of strong turbulence on ShCu over the TP in low air density conditions.(Wang Yinjun, Xu Xiangde)
2.3 The statistical characteristics of planetary boundary layer height (PBLH) in the Tibetan Plateau(TP) and other regions in China
The PBLH is calculated by using the radiosonde sounding data including 128 sites in China.The frequency distributions of PBLH variations under different regimes (CBL the convective boundary layer, NRL the neutral residual layer, and SBL the stable boundary layer) can be well fi tted by a Gamma distribution at different regions of China, and the shape parameterskand scale parameterssvalues have been obtained, and the difference between them are pointed out.(Wang Yinjun, Xu Xiangde, et al.)
2.4 The influence of the Tibetan Plateau on air pollution and precipitation in eastern China
In eastern China (EC), the strong anthropogenic emissions deteriorate the atmospheric environment,building a south–north distribution of high aerosols harbored by the upstream Tibetan and Loess plateaus in China.The extreme precipitation events presented an interannual variability pattern similar to that of the frequent haze events over EC.Accompanied by the frequent haze events in EC, light rain frequency significantly decreased and extremely heavy precipitation events have occurred more frequently.There were significant differences in the interdecadal variation trends in light rain and rainstorm events between the highly aerosol polluted area in EC and the relatively clean area on the western plateaus of China.The aircraft measurements over EC confirmed that the diameters of cloud droplets decreased under high aerosol concentration conditions, thereby inhibiting weak precipitation process.(Xu Xiangde, Guo Xueliang, et al.)
2.5 Quantifying oceanic moisture exports to mainland China in association with summer precipitation
Oceanic moisture exports (OMEs) are considered major moisture sources for precipitation over Mainland China during the boreal summer season.The spatiotemporal structure of OME-based precipitation over Mainland China was explored.The main research conclusions are summarized as follows.(1) Climatologically,the OMEs were originated from the Arabian Sea (AS), the Bay of Bengal (BOB), and the South China Sea(SCS) made roughly equivalent contributions to the entire areal-averaged precipitation over Mainland China on a seasonal scale, but the preferred regions influenced by the three oceanic sources differed strongly from each other.(2) The relative contributions of OME from the three specific subsections to precipitation varied significantly on the sub-seasonal scale.During the onset of summer monsoon, the AS region ranked the first as an important oceanic source, followed by the BOB and the SCS, whereas during the withdrawal of summer monsoon, this order was reversed.(3) The interannual anomalies of OME-based precipitation from the SCS and the BOB regions were negatively correlated with those outside the AS region.(Chen Bin, Xu Xiangde)
2.6 A new path for the effect of the Tibetan Plateau heating on the global climate trough modulating the Asian-Pacific Oscillation (APO)
Two kinds of numerical experiments are carried out to simulate the synergic effect of the Tibetan Plateau(TP) dynamical and thermal anomalies and the individual effect of the TP thermal anomaly, through adjusting the TP topographic height and modulating the surface vegetation type of the TP, respectively.The results show that the two kinds of numerical experiments reproduce the physical processes that the TP triggers anomalous vertical circulations between Asia and the North Pacific and therefore successfully force the typical structure of the summer Asia-Pacific Oscillation (APO).The above results confirm that the TP thermal anomaly dominates during summer, and it should be considered as an important contributor to the variation of the summer APO.This work reveals a new path that the TP thermal anomaly can affect the global climate through regulating the APO.(Liu Ge, Zhao Ping, Chen Junming)
3 Heavy rainfall and strong convection
3.1 Evaluation of quantitative precipitation forecasts by TIGGE ensembles for South China during the presummer rainy season
Based on The Observing System Research and Predictability Experiment (THORPEX) Interactive Grand Global Ensemble (TIGGE) dataset, this study evaluates the performance of five global ensemble prediction systems (EPSs) from the European Centre for Medium-Range Weather Forecasts (ECMWF), US National Centers for Environmental Prediction (NCEP), Japan Meteorological Agency (JMA), Korean Meteorological Administration (KMA), and China Meteorological Administration (CMA), respectively, on predicting the presummer rainy season (April−June) precipitation in South China.Evaluation for the 5 day forecasts in three seasons (2013−2015) indicates higher skill of the probability matching forecast than either the simple ensemble mean or the deterministic forecasts.The EPSs overestimate the light-to-heavy rainfall (0.1 to 30 mm/12h),while underestimate the heavier rainfall (>30 mm/12h), with JMA being the worst.By analyzing the synoptic situations predicted by the identified skillful (ECMWF and CMA) and less skillful (JMA) EPSs, as well as the ensemble sensitivity for four representative torrential rainfall cases, the low-level southwesterly flow upstream of the torrential rainfall regions that transports warm, moist air to South China is found to be a key synoptic factor that controls the QPF.The results also suggest that prediction of the locally produced torrential rainfall is more challenging than the more extensively distributed torrential rainfall.A slight improvement in the performance by shortening the forecast lead-time from 30−36 h to 18−24 h and to 6−12 h is noticed in the large-scale forcing case, but not in the locally produced cases (Fig.4).(Huang Ling, Luo Yali)
3.2 Synoptic analysis of extreme hourly precipitation in Taiwan during 2003−2012
This study investigates the statistical characteristics of extreme hourly precipitation over Taiwan during 2003−2012 that exceeds the 5, 10, and 20 years return values and 100 mm h−1.All the extreme precipitation records are classified into four types according to the synoptic situations under which they occur: tropical cyclones (TCs), fronts, weak-synoptic forcing, and vortex/shear line types.The TC type accounts for over three-quarters of the total records, while the front type and weak-synoptic forcing type are comparable(9%–13%).Extreme hourly precipitation is mostly caused by meiyu fronts during May–mid–June and by TCs during July–October.The TC type tends to have a long duration time (>12 h) with a symmetrical evolution of hourly rainfall intensity, while the front type and weak-synoptic forcing type mainly occur over a short period(<6 h) with a slightly asymmetrical evolution pattern.The TC type is further divided into seven subtypes according to the location of the TC center relative to the island.When the TC center is over the island or near the coastline (distance<100 km), the spatial distribution of subtypesⅠ−Ⅳ is largely determined by the interaction between the TC circulation and topography when a TC center is over the northwest, south, east, or northeast portion of Taiwan, respectively.When the TC center is far away (distance>100 km) from the island,the strength of the environmental southwesterly or northeasterly winds and the impingement of TC circulation on the eastern side of the Central Mountain Range are also key factors determining the spatial distribution of subtypesⅤ−Ⅶ.(Luo Yali, Wu Mengwen)
3.3 An extreme rainfall event in coastal South China during SCMREX-2014: Roles of rainband and echo trainings
This study investigates an extreme rainfall event that occurred in coastal South China on 11 May 2014 using integrated observations provided by the South China Monsoon Rainfall Experiment (SCMREX).The extreme rainfall is mostly produced by two consecutive mesoscale convective systems (MCSs) that consist of multiple meso-β-scale rainbands of 30−80 km length.A dual-Doppler wind synthesis shows that the two MCSs are maintained by lifting southerly oceanic flows over a quasi-stationary mesoscale outflow boundary (MOB),enhanced by convectively generated weak cold pool, along the coastline.The subsequent northeastward “echo training” of convective cells, under the influence of environmental southwesterly flows, leads to the formation of various meso-β-scale rainbands.The subsequent propagation of the rainbands, together with the “echo training”, along the coastline accounts for the production and distribution of extreme rainfall.An analysis of the S-band dual-polarization radar data reveals the generation of more moderate-sized raindrops and slightly larger maximal size of raindrops with stronger convective updrafts and more active ice-phase microphysical processes in the second MCS with heavier-rain-production than in the first MCS, likely due to the presence of larger convective available potential energy in the afternoon.The generation of the multiple rainbands in the second MCS is examined.The results show that its leading rainband develops a bow structure and later breaks into two parts due to the development of strong westerly rear inflows.Shortly after they strengthen into two well-organized rainbands as a result of convective initiation near the MOB, leading to a growing member of heavy-rain-producing bands.A conceptual model of the extreme-rain-producing MCS consisting of multiple rainbands along the coasts of South China is established.(Luo Yali, Liu Xi, Zhang Dalin)
3.4 Features of extreme hourly precipitation over South China during the presummer rainy season
The general features of extreme hourly rainfall (>60 mm h−1) over South China (SC) during the presummer rainy season (April–June) of 2011–2017 are studied using an 8 km-resolution gridded hourly rainfall analysis based on rain gauge measurements, weather maps, reanalysis data, and every 6 min mosaics of composite radar reflectivity (1 May–15 June 2013–2017).A total of 2659 extreme hourly rainfall records are found over the analysis region (covering mainly Guangxi and Guangdong provinces), with 262, 1405, 992 in April, May, and June, respectively.Three areas with high frequency of occurrence are located in the north Guangxi (NGX), southeast Guangxi (SEGX), and central coastal area of Guangdong (MCGD), respectively.Their diurnal variations in the three areas, respectively, show a single peak around the middle night, a major peak in the early morning, and a minor peak in the late afternoon, and a lack of distinct peak.The hourly extreme rainfall records are classified into five types according to the synoptic situations under which they occur: the surface front, low-level vortex, low-level shear line, weak synoptic forcing, and tropical cyclone.They contribute 35.5%, 8.9%, 16.4%, 38.1%, and 1%, respectively, to the total occurrence and present distinctive characteristics in regional distribution over the analysis region.The extreme rainfall in Guangxi occurs generally with favorable dynamical lifting by the synoptic weather systems, while that occurs in Guangdong often without.The mosaics of composite radar reflectivity patterns are analyzed for the 1716 extreme rainfall records during 1 May–15 June of 2013–2017.Among them, 51.4% are produced by MCSs with a prominent convective line (linear MCSs), 7.7% by MCSs consisting of multiple rainbands (MRBs), and 41% by smaller-scale storms.The extreme rainfall produced by the linear MCSs is distributed quite extensively over South China, with a major high frequency area in north Guangxi and a secondary high frequency area in central costal Guangdong.The extreme rainfall produced by the MRB-type MCSs mostly influences central inland and coastal Guangdong, and that by smaller-scale storms distributes extensively over South China but have higher frequency in Guangxi than in Guangdong except for central Guangdong.Further analysis of the duration and the development types (abrupt, growing, continuous) of the hourly extreme rainfall events also demonstrates distinct regional features.(Luo Yali, Chen Yangruixue, Li Zhenghui)
3.5 Assimilating Doppler radar observations with an ensemble Kalman filter for convectionpermitting prediction of convective development in a heavy rainfall event during the pre-summer rainy season of South China
This study examines the effectiveness of an ensemble Kalman filter based on WRF model to assimilate Doppler-radar radial-velocity observations for convection-permitting prediction of convection evolution in a high-impact heavy-rainfall event over coastal areas of South China during the pre-summer rainy season.An ensemble of 40 deterministic forecast experiments (40 DADF) with data assimilation (DA) are conducted,in which the DA starts at the same time but lasts for different time spans (up to 2 h) and with different time intervals of 6, 12, 24, and 30 min.The reference experiment is conducted without the DA (NODA).It is found that the DA experiments generally improve the convection prediction.The 40 DADF experiments can forecast a heavy-rain-producing MCS over land and an MCS over the ocean with high probability, despite slight displacement errors.Compared with the experiments using the longer DA time intervals, assimilating the radial-velocity observations at 6-min intervals tends to produce better forecasts.The experiment with the longest DA time span and shortest time interval shows the best performance.However, a shorter DA time interval (e.g., 12 min) or a longer DA time span does not always help.In the optimal DADF experiment, an improved representation of the initial state leads to dynamical and thermodynamic conditions that are more conducive to earlier initiation of the inland MCS and longer maintenance of the offshore MCS.(Bao Xinghua,Luo Yali)
3.6 Observational analysis of a record-breaking rain-producing convective storm influencing Guangzhou during SCMREX-2017
A meso-β-scale storm that produced extreme rainfall over Guangzhou megacity on 7 May 2017 is studied using integrated observations by various instruments deployed during the IOP of the South China Monsoon Rainfall Experiment (SCMREX), and the high-resolution gridded datasets generated using a four-dimensional variational Doppler radar analysis system (4D VDRAS).Results show the initiation and subsequent organization of convective cells in a meso-β-scale convergence region on the northern edge of Guangzhou,where an onshore low-level jet stream with ample moisture embedded in a weak ambient flow decelerated as it moved across the urban areas, and then converged as it hit the mountainous region to the north.The enhanced urban frictional dissipation and the topographical blocking effects accounted for the formation of such a convergence region, while the urban heat island effect helped maintain conditionally unstable columns during this night-time period with a relatively deeper boundary layer over the Megacity.The onshore flows gave rise to the development of deep moist columns over the Megacity.The deep moist columns, the weak environmental winds, and the moderate height of LNB (about 10 km ASL) favored the storm’s stagnation and high precipitation efficiency by inhibiting intense updrafts and detrainment of hydrometeors at higher levels.
Examination of the VDRAS outputs revealed the presence of a moderately deep, meso-γ-scale, circular convective core (C3) within a meso-β-scale vortex.Vorticity diagnosis indicated that tilting of environmental horizontal vorticity played a key role in the early development of the vortex, while stretching effect associated with low-level convergence was responsible for the vorticity maintenance.The thermal buoyancy resulting from latent heat release was the prime forcing and the dynamical vertical perturbation pressure gradient force was secondary in supporting the upward motion in the C3.A large number of raindrops with moderate-to-large sizes were produced through active warm rain processes, which might be attributed to the presence of large sea-salt aerosols in the southerly inflow acting as cloud condensation nuclei.(Luo Yali, Ma Ruoyun, Zhang Dalin, Chen Mingxuan)
3.7 Synoptic control of convective rainfall rates and cloud to ground lightning frequencies in warmseason mesoscale convective systems over North China
This study examines whether environmental conditions can control convective rainfall rates and cloudto-ground (CG) lightning frequencies in mesoscale convective systems (MCSs) over North China (NC).Sixty identified MCSs over NC during June–August of 2008–2013 were classified into four categories based on their high/low convective rainfall rates (HR/LR) and high/low lightning frequencies (HL/LL), i.e., HRHL,HRLL, LRHL and LRLL MCSs.MCSs with HR (HL) occurred most frequently in July (August), while those with LR or LL occurred most frequently in June; they followed closely seasonal changes.All MCSs were apt to form during afternoon hours.HRLL MCSs also formed during evening hours while HRHL MCSs could occur at any time of a day.A composite analysis of environmental conditions shows obvious differences and similarities among the HRHL, HRLL and LRLL categories, while the LRHL MCSs exhibited little differences from the climatological mean due to its small sample size.Both the HRHL and HRLL MCSs occurred in the presence of upper-level anomalous divergence, a midlevel trough, and the lower-tropospheric southwesterly transport of tropical moist air.In contrast, LRLL MCSs took place due to daytime heating over mountainous regions, with little midlevel forcing over NC.The HRHL, HRLL, LRHL and LRLL categories exhibited orders of the highest to smallest convective available potential energy and precipitable water but the smallest to largest convective inhibition and lifted indices.It is concluded that the environmental conditions determine to some extent convective rainfall rates and CG lightning activity, although some other processes (e.g., cloud microphysics) also play certain roles, especially in CG lightning production.(Xia Rudi, Zhang Dalin)
3.8 On the mechanism of the North Atlantic Oscillation
In this study, the relationship between the Madden-Julian Oscillation (MJO) and the North Atlantic Oscillation (NAO) is investigated based on the European Centre for Medium-Range Weather Forecasts Re-Analysis (ERA-Interim) dataset, which provides a guideline for the extended-range prediction.When the MJO is active, negative (positive) NAO events are preceded by enhanced MJO closely resemble the northern annular mode (NAM).The MJO-related NAO events are also long-lived, persisting for approximately 30 days.In contrast, when the MJO is inactive, there is little change to the zonally symmetric component of the lower stratospheric zonal wind, these events are relatively short-lived, lasting for about 10 days, and the NAO corresponds to a dipole that is confined to the North Atlantic.(Jiang Zhina)
3.9 A numerical study of the convection triggering and propagation associated with sea breeze circulation over Hainan Island
Based on high-resolution numerical simulations, the effects of sea breeze circulation (SBC) on associated convective initiation and propagation over Hainan Island are investigated.The results show that the blocking of synoptic wind on the windward side of the mountains inhibits the occurrence of windward-side valley breeze and sea breeze.In the context of low mountains, weak synoptic wind not only favors the combination of the SBC with the valley breeze circulation on the leeward side of the mountains but also makes the convergence zone between the synoptic wind and the leeward-side combined circulation stay near the tops of the mountains,leading to the accumulation of large quantities of water vapor taking place over the mountaintops.The combined effect of enhanced water vapor and high temperatures over the mountaintops can result in the generation of much larger convective available potential energy (CAPE) than the surrounding areas.The coupling of the large CAPE with the considerable converging ascending motion and abundant water vapor near the tops of the mountains promotes the occurrence of a strong convection band (CB) over the mountaintops.During the CB propagation under the steering of synoptic wind, the flow across the CB continuously and strongly opposes the SBC front and the fronts of the Kelvin-Helmholtz billows behind, resulting in successive and strong lifting motion as well as large quantities of water vapor and high CAPE near these fronts.These lead to an apparent downstream wave-like propagation of the CB.(Liang Zhaoming, Wang Donghai, Liu Ying)
4 Typhoon research
4.1 Diurnal cycle of rainfall associated with landfalling tropical cyclones in China from rain gauge observations.
The diurnal variation of rainfall over China associated with landfalling tropical cyclones (TCs) is investigated using hourly rain gauge observations obtained from conventional meteorological stations in China.The harmonic analysis shows an obvious diurnal signal in TC rainfall with a rain-rate peak in the early morning and a minimum in the afternoon.The diurnal cycle in the outer region (between 400 and 900 km radii from the storm center) is found to be larger than in the core region (within 400 km of the storm center.As the result of this diurnal cycle, TCs making landfall at night tend to have cumulative precipitation, defined as the precipitation cumulated from the time at landfall to 12 h after landfall, about 30% larger than those making landfall around noon or afternoon (Fig.5).(Hu Hao,Duan Yihong, Wang Yuqing)
4.2 Effect of the initial vortex structure on intensification of a numerically simulated tropical cyclone
The dependence of intensification rate (IR) of a tropical cyclone (TC) on its initial structure, including the radius of maximum wind (RMW) and the radial decay rate of tangential wind outside the RMW, is examined based on ensemble of simulations using a nonhydrostatic axisymmetric cloud-resolving model.It is shown that the initial spinup period is shorter and the subsequent IR is larger for the storm with the initially smaller RMW or with the initially more rapid radial decay of tangential wind outside the RMW.The results show that the longevity of the initial spinup period is determined by how quickly the inner-core region becomes nearly saturated in the middle and lower troposphere and thus deep convection near the RMW is initiated and organized.Because of the larger volume and weaker Ekman pumping, the inner-core of the initially larger vortex takes longer time to become saturated and thus experiences a longer initial spinup period.The vortex initially with the larger RMW (with the slower radial decay of tangential wind outside the RMW) has lower inertial stability inside the RMW (higher inertial stability outside the RMW) develops more active convection in the outer-core region and weaker boundary-layer inflow in the inner-core region and thus experiences lower IR during the primary intensification stage (Fig.6).(Xu Jing, Wang Yuqing)
4.3 Characteristics of tropical cyclone-induced winds over complex terrains of China coast
Based on the ERA-Interim reanalysis data (0.5°× 0.5°, 6-hourly) from 1979 to 2015, the best track dataset from the CMA and the JTWC, characteristics of tropical cyclone (TC) low-level wind fields around the Taiwan and the Hainan Island are statistically analyzed, respectively.Main results are summarized here.(1) When TC centers locate around the island, positive and negative vorticity belts are found to distribute alternately in TC’s periphery between the islands.(2) The TC-induced high winds mainly appear on the east and northeast of Taiwan Island and the Taiwan Strait.For Hainan Island, high winds tend to occur on the northeast of the island and the Beibu Gulf.Winds on the island are much weaker.(3) The averaged radius of maximum wind (RMW)for TCs around Taiwan Island is 51.3 km, which is smaller than 58.3 km around Hainan Island.On average,RMWs of TCs on the west (northeast) of Taiwan Island are the largest (smallest).For Hainan Island, RMWs of TCs on the island (the northwest of the island) are the largest (smallest).(4) The 34-kts wind circle transforms to a certain degree when a TC approaches the islands.The longest wind radius is located on the eastern part of the TC circulation.On average, the wind circle may have the largest deformation when a TC occurs on the northwestern (southwestern) side of Taiwan (Hainan) Island.(Li Ying, Xue Lin)
4.4 Climatic characteristics of binary tropical cyclones in the Northwest Pacific Ocean
Based on typhoon best track data of China Meteorological Administration and NCEP global reanalysis data, this study analyzes characteristics of binary tropical cyclones in the Northwest Pacific during 1951–2014 by using the objective determination standard.Results show that there were 699 pairs of binary typhoons in the Northwest Pacific during 1951–2014.Among these cases, there were 446 pairs of typical binary typhoons and 253 pairs of typical cases, respectively, or 63.8% and 36.2% of the total.The proportion of typical cases increased with the separation distance decreased, while the proportion of atypical cases decreased with the separation distance decreased.Binary typhoons mainly appeared between 110° to 150°E and 10° to 30°N.Most cases appeared in the northern South China Sea and east of Philippines, with Taiwan Island being included.Binary typhoons most frequently occurred in August and September.When the speed of typical binary typhoons moving towards each other reached the peak, binary typhoons mainly orientated in the east to west direction.At this time typhoons were controlled by the easterlies south of the subtropical high.In this situation,the east typhoon moved toward the west typhoon quickly.When the anticlockwise angular velocity of typical binary typhoons reached the peak, the binary cases distributed northeast to southwest or east-northeast to west-southwest, appearing in the west and southwest edge of the subtropical high and mainly controlled by southeasterly flow, thus benef i ted the anticlockwise rotation between the typical binary typhoons.(Ren Fumin)
4.5 Comparison of the effect of easterly and westerly vertical wind shear on tropical cyclone intensity change over the western North Pacific
The effects of vertical wind shear (VWS) with different directions on tropical cyclone (TC) intensity change are compared in this statistical study based on TCs occurring between 1982 and 2015 over the western North Pacific (WNP).Results show that a westerly VWS has a much higher correlation (−0.36) with change in TC intensity than an easterly VWS (−0.07) over the WNP, especially a southwesterly VWS (−0.43).Sea surface temperature (SST) is found to modulate the effect of VWS on TC intensity change as it has a close relationship with zonal VWS (−0.48).The favorable effect of SST, which increases with the increase in easterly VWS, could offset the detrimental effect of VWS, leading to a relatively low correlation coefficient between easterly VWS and TC intensity change.By contrast, westerly VWS increases with decreasing SST, and the largest correlation coefficient appears when SST is around 301 K.Therefore, it is suggested that the direction of VWS as well as its value should be taken into consideration in statistical models used to predict TC intensity(Fig.7).(Wei Na, Li Ying)
5 Lightning research
5.1 Assimilation of special observation data and research on detecting and forecasting methods for severe thunderstorms
A three-dimensional charge-discharge numerical model is used, in a semi-idealized mode, to simulate a thunderstorm cell.Characteristics of the graupel microphysics and vertical air motion associated with lightning initiation are revealed, which could be useful in retrieving charge strength during lightning when no chargedischarge model is available.The results show that the vertical air motion at the lightning initiation sites (Wini)has a cubic polynomial correlation with the maximum updraft of the storm cell (Wcell-max), with the adjusted regression coefficient of approximately 0.97.Meanwhile, the graupel mixing ratio at the lightning initiation sites (qg-ini) has a linear correlation with the maximum graupel mixing ratio of the storm cell (qg-cell-max)and the initiation height (zini), with the coefficients being 0.86 and 0.85, respectively.These linear correlations are more significant during the middle and late stages of lightning activity.A zero-charge zone, namely, the area with very low net charge density between the main positive and negative charge layers, appears above the area of qg-cell-max and below the upper edge of the graupel region, and is found to be an important area for lightning initiation.Inside the zero-charge zone, large electric intensity forms, and the ratio of qice (ice crystal mixing ratio) to qg (graupel mixing ratio) illustrates an exponential relationship to qg-ini.These relationships provide valuable clues to more accurately locating the high-risk area of lightning initiation in thunderstorms when only dual-polarization radar data or outputs from numerical models without charging/discharging schemes are available.The results can also help understand the environmental conditions at lightning initiation sites.(Wang Fei)
The charge structure and formation in Typhoon Molave (2009) before and after its landfall and during the decaying stage are investigated using satellite, lightning detection data and a mesoscale simulation.Results show that Molave was intensifying prior to landfall, with a well-defined eye and relatively high-frequency lightning activity in the eyewall.Convection near the eyewall exhibited positive tripole charge structure, with negative charge located between the levels of −25 ℃ and −10 ℃ sandwiched by two positive charge regions.However, the charge structure of convection becomes negative bipole, along with negative charge in the middle and positive charge at the bottom of convective clouds after Molave reaches its maximum intensity.The charge structure of eyewall convection is closely associated with typhoon intensity, but not in a direct correlation with landfall.The outer spiral rainband cells display a positive tripole charge or a positive bipole in different stages of the typhoon.Previous studies suggested that outer rainband only features a positive bipole charge structure.The positive tripole charge structure forms with different mechanisms: one resembles that in the eyewall, and the other has a positive charge region composed by hail and a positive bipole region composed by graupel and ice crystals in the upper levels.During the decaying stage of the storm, weak convection is mainly featured by a negative bipole, similar to the terrestrial thunderstorms in the dissipative stage.(Xu Liangtao, Zhang Wenjuan)
5.2 Influence of the Canton Tower on the cloud-to-ground lightning in its vicinity
The influence of the Canton Tower on cloud-to-ground lightning in its vicinity is analyzed based on the data obtained by Lightning Location System (LLS) of the Guangdong Power Grid Corporation from 1999 to 2015.The LLS data obtained before (1999–2005) and after (2010–2015) the erection of the Canton Tower were compared.The flash/stroke density showed a significant increase in the immediate vicinity around the Canton Tower within a radius of 1 km, and a clear decrease in the annular vicinity with a radius from 1 km to 4 km.The arithmetic mean and median LLS-inferred peak current of strokes occurred in 1 km radius area around the Canton Tower exhibited a significant increase, while that of the strokes occurred beyond 1 km did not show a clear change.It is speculated that the Canton Tower induced lots of upward flashes and attracted some downward flashes around it within several kilometer radius to itself.(Lyu Weitao, Qi Qi, Ma Ying, Yao Wen)
5.3 Characteristics of initial stage for triggered lightning
Upward positive leader (UPL) is the key discharge during the initiation of upward negative lightning and the connection of downward negative lightning.However, it is not enough to understand the physical mechanism during the inception stage of UPL.Based on the synchronous data of channel-base current and close-distance electric field generated by triggered lightning detected in Guangdong comprehensive observation experiment for lightning discharge, the discharge characteristics of UPL during the initial stage of triggered lightning are analyzed.The waveform of channel-base current for upward positive leader exhibits discontinuous pulses, which occur separately or in groups.Statistical analysis shows that the geometric mean(GM) values of current peak, 10%–90% rise time, duration, half peak width, transferred charge, and pulse interval for the pulses generated before the appearance of continuously upward leader are 28 A, 0.33 μs, 2.3 μs, 0.73 μs, 27 μC, and 25 μs, respectively.The GM values of the corresponding parameters for the pulses generated during the initiation of continuously upward leader are 32 A, 0.54 μs, 3.5 μs, 0.93 μs, 46 μC and 24 μs, respectively.Compared with the discharge process before continuous propagation of UPL, the discharge process during the inception of continuously upward leader transfers more charge.Also, the waveforms of close-distance electric field show obviously a step-change, and each pulse of electric field corresponds to the channel-base current pulses in time sequence, indicating that the cascade development has characteristics of upward positive leader during the initial stage of artificially triggered lightning.(Zhang Yang, Zhang Yijun,Lyu Weitao, Zheng Dong, Xu Liangtao)
5.4 Detailed discharge process of lightning initial stage
During 2016, we developed continuous interferometer which can accurately locate and detect the breakdown activity with sub microsecond and meter-scale resolutions.We observed a triggered lightning on 9 June 2016 during the Guangdong Comprehensive Observation Experiment on Lightning Discharge.The discharge produced 54 precursor current pulses (PCPs) over 883 ms during the rocket’s ascent.The interferometer observations show that the PCPs were produced by breakdown at the ascending tip of the rocket,and that individual PCPs were produced by weak upward positive breakdown over meter-scale distances,followed by more energetic, fast downward negative breakdown over several tens of meters distance.The average propagation speeds were 5×10⁶m s−1and 3×10⁷m s−1, respectively.The sustained upward positive leader (UPL) was initiated by a rapid, repetitive burst of 14 precursor pulses.Upon initiation, the VHF radiation abruptly became continuous with time.Significantly, breakdown during the UPL appeared to extend the discharge in a similar manner to that of the precursor pulses.Our research provides valuable insights into the triggering mechanism and positive breakdown processes (Fig.8).(Zhang Yang, Zhang Yijun, Lyu Weitao,Zheng Dong)
5.5 Characteristics of the initial stage and return stroke currents of rocket-triggered lightning flashes in South China
This study investigates the initial stage (IS) and return stroke (RS) currents of 50 triggered lightning flashes (TLFs) that were conducted in South China.The IS of the negative TLFs has a longer duration and larger average current, charge transfer, and action integral than those reported elsewhere, with geometric means (GMs) of 347.9 ms, 132.5 A, 45.1 C, and 10.0× 10³A2s, respectively.Two positive TLFs containing no RS have much greater average currents, charge transfers, and action integrals in the IS when compared with the negative TLFs.The RS has a greater peak current (17.2 kA; GM, same as below), charge transfer within 1 ms (1.3 C), and action integral within 1 ms (5.8×10³A2s), and shorter 10% to 90% rise time (0.4 μs)than elsewhere.The peak current is prominently correlated with the rate of rise, charge transfer within 1 ms,and action integral within 1 ms.Furthermore, when the total duration of the RS and any following continuing currents is longer than 40 ms, the peak current, charge transfer within 1 ms, and action integral within 1 ms of the RS are seldom greater than 25 kA, 2.6 C, and 15×103A2s, respectively.It is indicated that TLFs containing RSs tend to have a longer duration but a smaller charge transferred during the IS than those without RS.The peak current of the RS is weakly correlated with its preceding silence period when there was no channel base current.(Zheng Dong, Zhang Yijun, Zhang Yang, Lyu Weitao)
5.6 Spatial-temporal characteristics of lightning flash size in a supercell storm
The flash sizes of a supercell storm, in New Mexico on October 5, 2004, are studied using the observations from the New Mexico Lightning Mapping Array and the Albuquerque, New Mexico, Doppler radar (KABX).First, during the temporal evolution of the supercell, the mean flash size is anti-correlated with the flash rate, following a unary power function, with a correlation coefficient of −0.87.In addition, the mean flash size is linearly correlated with the area of reflectivity >30 dBz at 5 km normalized by the flash rate,with a correlation coefficient of 0.88.Second, in the horizontal, flash size increases along the direction from the region near the convection zone to the adjacent forward anvil.The region of minimum flash size usually corresponds to the region of maximum flash initiation and extent density.The horizontal correspondence between the mean flash size and the flash extent density can also be fi tted by a unary power function, and the correlation coefficient is >0.5 in 50% of the radar volume scans.Furthermore, the quality of fi t is positively correlated with the convective intensity.Third, in the vertical direction, the height of the maximum flash initiation density is close to the height of maximum flash extent density but corresponds to the height where the mean flash size is relatively small.In the discussion, the distribution of the small and dense charge regions when and where convection is vigorous in the storm, is deduced to be responsible for the relationship that flash size is temporally and spatially anti-correlated with flash rate and density, and the convective intensity.(Zheng Dong, Zhang Yijun)
5.7 Relationship between lightning activity and vertical airflow characteristics in thunderstorms
Cloud-to-ground (CG) lightning data, wind field data derived from dual-Doppler radars, and radar reflectivity data are combined to investigate the relationships between CG lightning and the parameters associated with vertical airflow.A new method for the identification of thunderstorm cells based on the aggregation of flashes is developed.It is found that approximately 79.1% of CG flashes are located in the region featuring weak vertical velocity at the 0 ℃ level, ranging from −5 to 5 m s−1, with the majority in the weak updraft region, especially for negative CG lightning and the CG lightning in the initial stage of thunderstorms.The CG lightning rate is correlated with the volume of updraft for vertical velocities within certain limits.The sum of absolute precipitation ice mass flux in the region from 7 to 11 km is more significantly correlated with the CG flash rate, with correlation coefficients of 0.73, 0.71, and 0.74 for the initial, mature, and dissipating stages of thunderstorms, respectively.On average, the updraft in the thunderstorm at the stage when the last CG flash occurs accounts for a much smaller ratio to the whole volume of the thunderstorm than that corresponding to the first CG flash.The maximum updraft and maximum height of the 10 and 20 m s−1updraft speeds are close for the first and last CG flashes, indicating the dependence of the lightning on strength of updraft.It is deduced that layered large-range charges may be more conducive to the generation of CG flashes than charge pockets in the thunderstorm.(Zheng Dong, Zhang Yijun, Liu Liping)
5.8 Low-frequency e-field detection array (LFEDA): Construction and preliminary results
In recent years, locating total lightning at the VLF/LF band has become one of the most important directions in lightning detection.The low-frequency e-field detection array (LFEDA) consisting of nine fast antennas was developed by the Chinese Academy of Meteorological Sciences in Guangzhou between 2014 and 2015.This study documents the composition of the LFEDA and a lightning-locating algorithm that applies to the low-frequency electric field radiated by lightning pulse discharge events (LPDEs).Theoretical simulation and objective assessment of the accuracy and detection efficiency of LFEDA have been done using Monte Carlo simulation and artificial triggered lightning experiment, respectively.The former results show that having a station in the network with a comparatively long baseline improves both the horizontal location accuracy in the direction perpendicular to the baseline and the vertical location accuracy along the baseline.The latter results show that detection efficiencies for triggered lightning flashes and return strokes are 100% and 95%,respectively.The average planar location error for return strokes of triggered lightning flashes is 102 m.By locating LPDEs in thunderstorms, we find that LPDEs are consistent with convective regions as indicated by strong reflectivity columns and present a reasonable distribution in the vertical direction.In addition, the LFEDA can reveal an image of lightning development through mapping the channels of lightning.Based on three-dimensional locations, the vertical propagation speed of the preliminary breakdown and the changing trend of the leader’s speed in an intra-cloud and a cloud-to-ground flash are investigated.Results show that the LFEDA has the capability for three-dimensional location of lightning, which provides a new technique for the study of lightning development characteristics and thunderstorm electricity.(Zheng Dong, Zhang Yang, Zhang Yijun, Lyu Weitao)
5.9 Identification method and analysis on lightning flash initiation phase and size
Based on the observation of Lightning Mapping Array, the statistical distribution of the characteristic parameters describing the lightning flash initiation and size in a supercell storm occurring on October 5, 2004 in New Mexico, United States is studied.A method automatically identifying the start and end of the negative leaders at initial stage of lightning is developed, and the flash convex hull, total channel length, horizontal and vertical extent are used to represent the flash size.The distributions and characteristics of flash initiation and size in this storm are summarized here.(1) It is found that the median values of the duration, three-dimensional displacement, vertical displacement and the average displacement velocity for the upward (downward)negative leaders at IS are 13.5 ms (7.5 ms), 1.4 km (1.0 km), 0.9 km (0.5 km), and 9.2×10⁴m s−1(1.2×10⁵m s−1), respectively.In addition, the average flash initiation velocity decreases with height from 6 km to 11 km.With time going by, the speed of upward negative leader at initial stage decreases before 24 ms (to ensure the samples is larger than 100), while that of the downward negative leader increases before 12 ms (to ensure the samples is larger than 50).The negative leaders are dominantly tilted at initial stage, considering that the median angles between the 3-D displacement direction and the vertical direction are 40° for upward leader and 54° for downward leader, respectively.(2) The probability density distribution of flash size described by flash convex hull and total channel length can be well fi tted by negative power function, and both of them bias to the small value, which means that the distribution and evolution of flash convex hull is consist with that of total channel length.In the vertical direction, the average flash sizes at middle and upper levels are smaller than at the lower levels.The median of flash duration is 271.0 ms, and the mean of that is 329.1 ms.The flash duration time and size are not significantly correlated.The flash with long duration time is not necessarily large.Moreover, the median of flash horizontal extent is 6.1 km while the vertical extent is 4.3 km, and there are 83%of flashes whose horizontal extent is greater than vertical extent.The flashes with horizontal extent greater than vertical extent are mainly initiated at 8.5 km, and those with vertical extent greater than horizontal extent are mainly initiated at 11 km.It is shown that the more horizontal the leader displacement direction at Initial stage is, the less the flash vertical extent is, which indicates that the leader displacement direction at the initial stage has an important influence on flash vertical extent.(Zheng Dong, Zhang Yijun)
5.10 Development of lightning detection technology and outfield experiment
During the 12th Guangdong comprehensive observation experiment on lightning discharge and the first observation on electric activity in Tibet thunderstorms, detailed observations of lightning discharge process and total flash in thunderstorm have been conducted, and significant progress in triggered lightning and research on lightning physical mechanism have been gained.The specific progresses are summarized as follows.(1)The numbers and success rate of triggered lightning were 16% and 80%, respectively, both keeping relatively on a high level.(2) Detailed positioning of lightning channel by continuous interferometer was improved.The long pre-trigger technology was developed, which helped describe the process of lightning discharge in a detailed and on a high time-resolution.(3) A further improvement of low frequency electric-field detection array (LFEDA) was made.Using the LFEDA, lightning activity in thunderstorms during 2017 was observed.The location was finer by optimizing the 3D location method.(4) A new sight about lightning initial discharge and radiation mechanism was obtained for the first time, based on the detailed observation on the instability discharge stage (precursor discharge).(5) The observation ability for high building lightning was significantly improved by optimizing the observation scheme.Based on could-to-ground (CG) lighting location data of Guangdong, the distribution differences of CG lightning flash before and after the construction of high building were revealed and the effects on CG flash distribution for different height buildings were analyzed.(6) The 3D total flash location array, LFEDA, including 8 substations were constructed on Tibet for the first time.The preliminary observation on Tibet thunderstorm activity indicated that the 3D locations of Tibet electric activity were reliable.(Zhang Yang, Lyu Weitao, Zheng Dong, Zhang Yijun, Yao Wen, Ma Ying, Xu Liangtao, Qi Qi,Wang Fei, Fan Xiangpeng, Fan Yanfeng)
6 Model and reanalysis data
6.1 Studies of key techniques associated with unified modeling of weather and climate
On the model dynamical framework, based on the technical features of unstructured grids, we presented a general formulation for the dynamical core and developed an unstructured grid modeling system.This system adopts the indirect addressing data structure, which is well suited for massive parallel computing.The system is equipped with separate mesh files, spherical operators, numerical solvers and I/O capability, which make it a new prototype of a dynamical framework.The model may be combined with both quasi-uniform and variable-resolution meshes and can be used for resolving various physical problems.Based on this system, we developed high-order numerical methods and applied them to two-type physical problems: a scalar transport problem and a potential vorticity transport problem.Results suggest that in the scalar transport problem, using high-order methods can effectively reduce numerical errors produced by low-order schemes; in the potential vorticity transport problem, using high-order upwind methods well controls the increase of potential entrophy,damps the numerical noise and reduces the numerical errors.On the model physics, a new aerosol scheme is incorporated to the CAMS-CSM model, which will be used for participating the CMIP6 experiments.Regarding the coupled model, we have completed the final version of CAMS-CSM model for participation in CMIP6, downloading and generating of CMIP6 forcing data for CAMS-CSM model, and developing corresponding reading modules for the model, the development of aerosol modules for CAMS-CSM model.Tentative CMIP6 DECK experiments were carried out using CAMS-CSM model.The assessment of the results shows that this version of CAMS-CSM can successfully capture the major features of large-scale circulation and major modes of the global climate, laying a solid foundation for conducting the final CMIP6 experiments(Fig.9).(Zhang Yi, Chen Haoming, Rong Xinyao)
6.2 Progress in East Asia regional atmospheric reanalysis data
The East Asian regional reanalysis system has been further improved and optimized so that the system can operate continuously and steadily in a long period integration.Besides, assimilation operator of radar radial wind and radar mosaic technology have been improved, and significant progress has been achieved in the application of radar data assimilation.As for sounding data, a comparison has been made between the number of the sounding data and its vertical levels used in the East Asia region reanalysis data and those included in GDAS, and comparative analysis was conducted by assimilating the two types of data.Furthermore, one year reanalysis dataset was produced using the optimized East Asian regional reanalysis system and the data were evaluated based on both surface and sounding observations.The results show that the developed reanalysis data performs a little better than ERA-Interim data within China.(Liang Xudong, Yin Jinfang, Chen Feng, Xie Yanxin, Liu Ying, He Huizhong, Zou Haibo)
6.3 Comparative analysis of integrated bias correction to ensemble forecast of precipitation in Southeast China
Based on the 24 h precipitation ensemble forecasts from three global numerical forecast centers (CMA,ECMWF and NCEP) and rain gauge data in the southeast region from 1 June to 31 July 2015 and using the Bayesian Model Averaging (scheme A) and combined Bayesian Model Averaging and statistically downscale(scheme B), we have corrected the three single-center and multi-center grand ensemble precipitation predictions, compared the adjustment effects of the two schemes, and then selected the precipitation forecasts from 1 to 31 August in 2015 to perform an independent sample test, and analyzed the skills of precipitation prediction before and after the correction.Taking 50th percentile precipitation forecast of three single center and grand ensemble as example, the results indicate that scheme A eliminates a large number of the false alarm of light rain and corrects the bias for light and moderate rains remarkably.But the correction of the precipitation intensity for those exceeding heavy rain is not evident.With the precipitation thresholds increasing, the correction of scheme A becomes weak.The correction to the orientation of rain belt is not clear and reduces the magnitude of precipitation area of heavy rain, or even makes the area disappear.After adopting scheme B adjustment, it not only reduces the false alarm of raw ensemble forecasts, but also corrects the precipitation intensity and the rainfall area, so that the range and magnitude of the precipitation forecasts are closer to observations.But its effect is still not significant to correct high-graded precipitation such as those exceeding 50.0 mm.(Yang Ruiwen, Zhao Linna)
7 Experiment and research platform
7.1 Atmospheric Science Experiment and Research Platform (formerly Scientific Research Data Sharing Platform) progress
We have completed construction of phaseⅠof Scientific Research Data Sharing Platform, which is fully operational and provides online data sharing service.We have received basic research funding support from department for construction of phaseⅡof the platform for a new project.We plan to complete the construction of Atmospheric Science Experiment and Research Platform in three years from 2017 to 2019.The project includes (1) development of atmospheric science experiment data management standards; (2) establishment of atmospheric science experiment data resources; (3) visualization of scientific experiment scene; (4)optimization of data sharing platform.(Gao Mei, Zhang Wenhua, Li Bin, Zhu Kongju)
