2015年西北太平洋台风季提早展开:2015/2016超级厄尔尼诺的影响
2017-01-06钱伊恬徐邦琪
钱伊恬,徐邦琪
南京信息工程大学 气象灾害教育部重点实验室/气候与环境变化国际联合实验室/气象灾害预报预警与评估协同创新中心,江苏 南京 210044

2015年西北太平洋台风季提早展开:2015/2016超级厄尔尼诺的影响
钱伊恬,徐邦琪*
南京信息工程大学 气象灾害教育部重点实验室/气候与环境变化国际联合实验室/气象灾害预报预警与评估协同创新中心,江苏 南京 210044
2016-03-03收稿,2016-10-12接受
国家自然科学基金资助项目(41375100);国家重点基础研究发展计划(973计划)资助项目(2015CB453200)
2015年1—5月西北太平洋上异常出现了7个热带风暴(Tropical Storms,TS),其中有5个发展成台风(Typhoons,TY),分别为气候平均态(1979—2015年)的2.5和3.6倍,亦即2015年的台风季提前展开。利用ERA-Interim再分析资料、JTWC热带气旋最佳化路径数据等资料,通过计算台风生成指数(Genesis Potential Index,GPI)和比较天气尺度和季节内振荡分量,探讨2015年台风季提前的原因。结果表明:1)2015年初异常活跃的台风活动与2015/2016年超级El Niño事件于西北太平洋上引发的海气状态异常有关。2)通过对大尺度环境场和台风潜在生成指数(GPI)的诊断分析发现,动力因子(低层涡度、垂直速度)和热力因子(与海表面温度、大气温度有关的潜在强度、中低层大气相对湿度)均对2015年1—5月台风的发生有正贡献。其中,涡度项的贡献最大,相对湿度的贡献次之。3)3~10 d天气尺度扰动和10~90 d季节内振荡在2015年1—5月也异常活跃,有利于TS和TY的生成与发展。
2015超级El Niño
台风活动
GPI
高、低频扰动
厄尔尼诺—南方涛动(El Niño-Southern Oscillation,ENSO)为赤道中东太平洋海气相互作用的大尺度气候异常,其为年际时间尺度上最显著的信号之一。ENSO与赤道太平洋的海表温度(Sea Surface Temperature,SST)的变化有密切的关系,并且将影响到全球的气温、环流和降水(Bradley et al.,1987;Ropelewski and Halpert,1987)。厄尔尼诺(El Niño)和拉尼娜(La Niña)分别是其暖事件和冷事件,周期一般是3~7 a(Collins,2005;Camargo et al.,2010)。业务监测和预报上通常用Niño3.4区(170~120°W,5°S~5°N)3个月滑动平均的逐月海温距平(SST Anomaly,SSTA)来衡量El Niño的强度(Trenberth,1997;Gergis and Fowler,2005)。
2015—2016年冬季爆发了一次超级El Niño事件,这次事件的强度与20世纪1997/1998年的超级El Niño事件相当,2015—2016年全球各地出现了不同的气候异常特征,例如:在肯尼亚和乌干达等东非国家在10—12月的降水增加,而在南非地区却遭遇了干旱,造成了粮食危机;处于西南季风区的南亚地区,6—9月的降水明显增加,西南太平洋的降水减少,中东太平洋地区对流频发,导致东南亚国家(如印度尼西亚等国)的干旱、森林火灾等自然灾害频发;在美洲中南部,墨西哥、秘鲁北部等地区春季的降水增加,而在哥伦比亚和巴拿马地区降水减少,美国南(北)部降水增加(减少)。值得注意的是,气象学家原本认为在2015/2016超级El Niño发生前1 a(2014/2015)可能会出现本世纪的超级El Niño事件。从2014年5月开始,赤道中东太平洋的海温距平(SSTA)开始逐渐上升,11月时,Niño3.4区的海温距平就已经超过了0.5 ℃,但是在2014年末时,SSTA却开始下降。对于2014/2015 El Niño事件的意外夭折,有些学者(Su et al.,2014;Levine and McPhaden,2016)认为是由于在2014年夏季时,持续的西风停止,取而代之的是东风爆发(easterly wind burst),这一东风爆发阻止了2014—2015年的冬季El Niño的发展,并且根据充放电理论(Jin,1997),爆发的东风阻碍了暖水向两极输送,暖水储存了下来。因此停止的El Niño却没有在2015年转变成La Niña,反而为2015/2016的超强El Niño积蓄了力量(Levine and McPhaden,2016)。因此从2015年2月开始,海温又重新升高,在8月Niño3.4区的SSTA超过1.5 ℃,并且在北半球冬季达到鼎盛状态,继而发展成为一个超级El Niño事件。
作为年际尺度上最重要的变化之一,ENSO与台风的发生有非常密切的关系,许多学者都对此有很深入详细的研究(Chan,1985;Dong,1988;Wu et al.,2004;陶丽等,2013),并且在不同的海域中的影响结果往往不同。最早Gray(1984)就研究了大西洋上的台风与El Niño的关系,发现El Niño发生时,大西洋上的台风个数往往低于气候平均;而在La Niña年,会有更多的飓风在大西洋上产生(Pielke and Landsea,1999)。西北太平洋上台风的年际变化也与ENSO关系密切,Wang and Chan(2002)发现强El Niño事件发展阶段(北半球夏季),西北太平洋上会有更多的台风,在El Niño成熟期过后的夏天,台风个数会明显减少,台风数量的变化与海温异常相关的Walker环流经向偏移有关(Chan,1985;Wu and Lau,1992;Chan,2000)。ENSO不仅影响台风的个数,也与台风生成的位置和轨迹相关,对于西北太平洋上的台风而言,在El Niño(La Niña)年,台风会生成在比较偏东南(西北)方(Chan,1985;Chen et al.,1998;Chia and Ropelewski,2002;Wang and Chan,2002),并且台风轨迹更加往东北方弯曲且向北深入(Camargo et al.,2007)。除此之外,还有学者对于El Niño对台风生成时间的影响进行了研究。Chan(2000)统计了El Niño年每个月发生台风的个数,发现9、10月中国南海的台风偏少而在西北太平洋东部的台风偏多,在El Niño之后的1 a整个西北太平洋上的台风都偏少。
在这次2015/2016超级El Niño发展成熟之前,西北太平洋上的台风活动出现异常特征。例如:进入典型台风季(6—10月)开始前,西北太平洋上出现多个超强热带气旋系统,2015年5月16日在西北太平洋上生成的超强台风Dolphin(Category 5,风速>114 knots)已是2015年西北太平洋第3个超强台风。同样是超级El Niño,1997年西北太平洋上第3个Cat 5台风发生于7月22日,比2015年晚了两个月。换言之,2015年的台风季于年初(1—5月)即已展开。ENSO或是超级El Niño如何影响台风季的开始时间?对此学界还少有研究,本文以2015/2016超级El Niño事件为例,探讨2015年初台风活动异常活跃的原因,包括:诊断西北太平洋上大尺度热力、动力场对台风生成增多的相对贡献,以及探讨高频天气尺度扰动、季节内振荡活动的影响。
1 资料和方法
1.1 资料
1)台风最佳路径数据集:由美国海军太平洋气象及海洋中心下属的联合台风预警中心(Joint Typhoon Warning Center,JTWC)提供。前人研究指出(Song et al.,2010;Wu and Zhao,2012),相较于其他台风最佳路径数据(如:日本气象厅RSMC_Tokyo数据、上海台风所台风最佳路径数据等),JTWC对台风强度的掌握更为精确,因此本研究采用JTWC提供的热带气旋数据。时间长度从1979—2015年,时间间隔为6 h。根据Saffir-Simpson的热带气旋等级定义,本文中将最大地表风速大于34 knots定义为热带风暴(Tropical Storm,TS),大于64 knots定义为台风(TYphoon,TY)。热带气旋的生成频率是统计每个时次西北太平洋上每一个2.5°×2.5°格点上热带气旋生成的个数,热带气旋的出现频率是每一个格点中的热带气旋的经过总次数。TS(TY)的生成位置定义为热带风暴最大风速第一次超过34(64)knots的位置。
2)为了解大尺度海、气状态异常,本研究收集了欧洲中期天气预报中心提供的再分析资料(ERA-Interim;Dee et al.,2011)和美国国家海洋大气管理局的扩展重建海温[NOAA Extended Reconstructed Sea Surface Temperature(ERSST),Smith and Reynolds,2004],时间长度皆为1979—2015年,时间分辨率为逐月资料,ERSST的空间分辨率为2°×2°,ERA-Interim三维数据的空间分辨率为1.5°×1.5°,垂直方向有37层,变量有水平风速u和v,垂直速度w(Pa·s-1),温度T、比湿q。为了研究高频波动的影响,也采用了ERA-Interim日平均的风场数据。
3)月平均降水数据采用的是1979—2015年全球降水气候项目(Global Precipitation Climatology Project,GPCP;Adler et al.,2003),分辨率为2.5°×2.5°。
1.2 方法
1)热带气旋生成潜在指数(Genesis Potential Index,GPI)诊断
本文采用的是经过Murakami and Wang(2010)改进了之后的GPI,和原来的GPI公式(Emanual and Nolan,2004)相比,加入了垂直运动项,以下为GPI(IGPI)的公式:
(1)
其中:ζ是850 hPa的绝对涡度(单位:s-1);IRH是700 hPa的相对湿度(单位:%);Vpot是热带气旋的最大潜在强度(Potential Intensity,PI;单位:m·s-1);Vs是850 hPa和200 hPa之间的垂直风切变的大小(单位:m·s-1);ω是500 hPa的垂直速度(单位:Pa·s-1)。PI的定义是基于Emanuel(1995)的工作,同时经过Bister and Emanual(1998)的改进。
为了计算GPI变化量中各项物理过程的相对贡献,GPI的各项可以简单表示为:
IGPI=η·γ·ψ·s·ω。
(2)
其中:η代表低层涡度;Υ代表低层湿度;ψ代表有关海温及大气温度的PI项;s代表高低层的垂直风切变;ω代表垂直风速。将方程两边取对数后,可将非线性的各项相乘转为线性的各项相加,如下式:
ln(IGPI)=lnη+lnγ+lnψ+lns+lnω。
(3)

X=
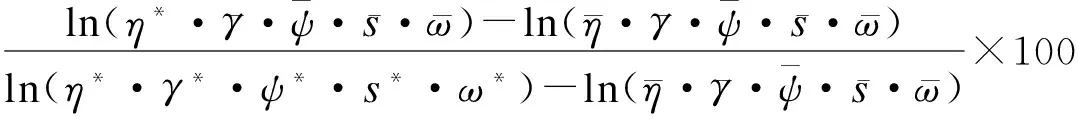
(4)
同理,可得其他项的相对贡献大小。各项贡献之和等于GPI相对于气候态的变化。分母是各项绝对值之和。
2)水汽方程诊断
根据Yanaietal.(1973),在等压面上某一层的水汽倾向方程可以表示为:
(5)
其中:q是比湿;t为时间;V是水平风;是水平梯度算符;p是气压;ω是垂直速度;Q2是视水汽汇(由于凝结和蒸发过程造成的潜热加热和次网格尺度的水汽通量辐合);L是凝结潜热。方程(5)左边代表水汽倾向或是水汽变化率,右边为造成水汽变化的物理过程,右边第1项-V·q为水汽平流的贡献;第2项为垂直平流的贡献;第3项与潜热释放有关的水汽源汇项。2015年初异常水汽的变化可能来自于不同时间尺度的运动引发的物理过程,为了定量研究水汽的变化来自于何种尺度相互作用,将每月的水汽倾向和各个变量都表示为气候态与距平场的和:
(6)

(7)
方程(7)左边表示水汽距平的倾向;右边的第1—3项分别表示异常风场辐合气候平均水汽场、气候风场辐合水汽距平场以及异常风场辐合水汽距平场;第4项代表垂直速度的距平场平流气候平均水汽;第5项代表气候平均的垂直速度平流水汽距平场;第6项代表垂直速度的距平场平流水汽距平场;第7项代表视水汽汇的距平。
3)再分析数据中对台风的滤除和带通滤波
再分析数据中的大尺度信号可能包含了台风本身,即台风的信号反馈可能隐含在大尺度场当中(Hsu et al.,2008)。为了滤除再分析数据中包含的台风信号,本文采用了Kurihara et al.(1995)运用在GFDL模式上的去除台风的方法,这种方法主要是根据切向风的径向梯度和大小来确定台风的边界。同时,为了提取3~10 d和10~90 d的环流信号,采用了Lanczos带通滤波(Duchon,1979)。
2 2015/2016超强El Nio的演变过程和台风特征
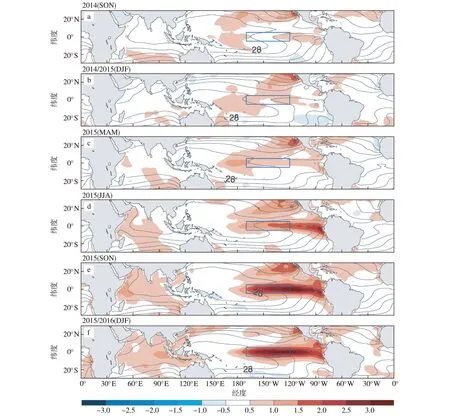
图1 2014—2016年各季节的平均海温(等值线)分布及其与气候平均态(1979—2015年)的差值(阴影,红色代表正距平大于0.5 ℃,蓝色代表负距平小于-0.5 ℃)[蓝色框代表Nio3.4区(170~120°W,5°S~5°N)的位置;单位:℃] a.2014年秋季;b.2014/2015年冬季;c.2015年春季;d.2015年夏季;e.2015年秋季;f.2015/2016年冬季Fig.1 2014—2016 seasonal mean SST(contours;units:℃) and its anomaly(relative to the climatology in 1979—2015)[red(blue) shading indicates SSTAs greater(smaller) than 0.5 ℃(-0.5 ℃);blue box represents the Nio3.4 region(5°S—5°N,170—120°W);units:℃]:(a)2014 autumn;(b)2014/2015 winter;(c)2015 spring;(d)2015 summer;(e)2015 autumn;(f)2015/2016 winter
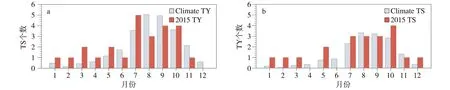
图2 1979—2015年气候平均(灰色)和2015年(红色)各月在西北太平洋(100~200°E,0~40°N)上发生的TS(a)及TY(b)个数Fig.2 1979—2015 climatological mean(gray bars) and 2015(red bars) (a)TS and (b)typhoon counts over the western North Pacific(0—40°N,100—200°E) in each month
对应热带太平洋海温异常的演化,西北太平洋台风活动也出现明显的异常。由热带气旋每月在西北太平洋上生成的个数(图2)可以看出,就气候平均(1979—2015)而言,在西北太平洋海域,全年都有TS(图2a)和TY(图2b)生成,每年6—10月为台风季,生成在6—10月的TS(TY)占全年的73%(80%)。值得注意的是,在2015年的台风季(6—10月)期间,热带气旋的个数与气候平均并没有太大的差别,并且全年总个数也没有太大差距,反而在台风季发生之前的1—5月,2015年的热带气旋个数在每个月均大于气候平均。2015年1—5月TS的个数为7个,而气候平均只有2.8个(图2a),2015年是气候平均的2.5倍。2015年1—5月TY的个数也达5个,大约是气候平均(1.4个)的3.6倍。
图4是TY的生成和出现频率,与TS结论一致,菲律宾海以东的热带太平洋(130~170°E,2.5~12.5°N)洋面上有较多TY生成,西北太平洋上TY频次增加。下文将进一步讨论有利于2015年年初热带气旋活动的关键大尺度环境场以及高频扰动。
3 大尺度环境场对2015年初台风活动活跃的贡献
3.1 大尺度环境场分析
热带气旋的生成与大尺度大气与海洋状况有密切的关系(Gray,1979),图5显示与2015年1—5月台风生成有关的大尺度环境距平场。2015年年初时,热带太平洋的海温异常增暖(图5a),并且赤道中东太平洋有一个暖水异常中心,东太平洋/加州西岸亦为暖水异常区,这些暖海温异常与这次El Nio事件在2015年春季开始迅速发展有关。赤道中东太平洋的暖海温对应低压异常(图5f)及低层的辐合/气旋式环流异常(图5b、e)的发生,低层西风使信风存在负异常,日界线附近垂直风切变减小(图5d)。同时,Walker环流上升区异常东移至中太平洋150~180°E一带(图5c)。伴随着异常低压气旋和异常上升运动,赤道西太平洋140°E以东,大气中层水汽呈正异常(图5g)、降水引发较强的非绝热加热异常(图5h),这些大尺度的变化提供了热带扰动产生和发展的环境。
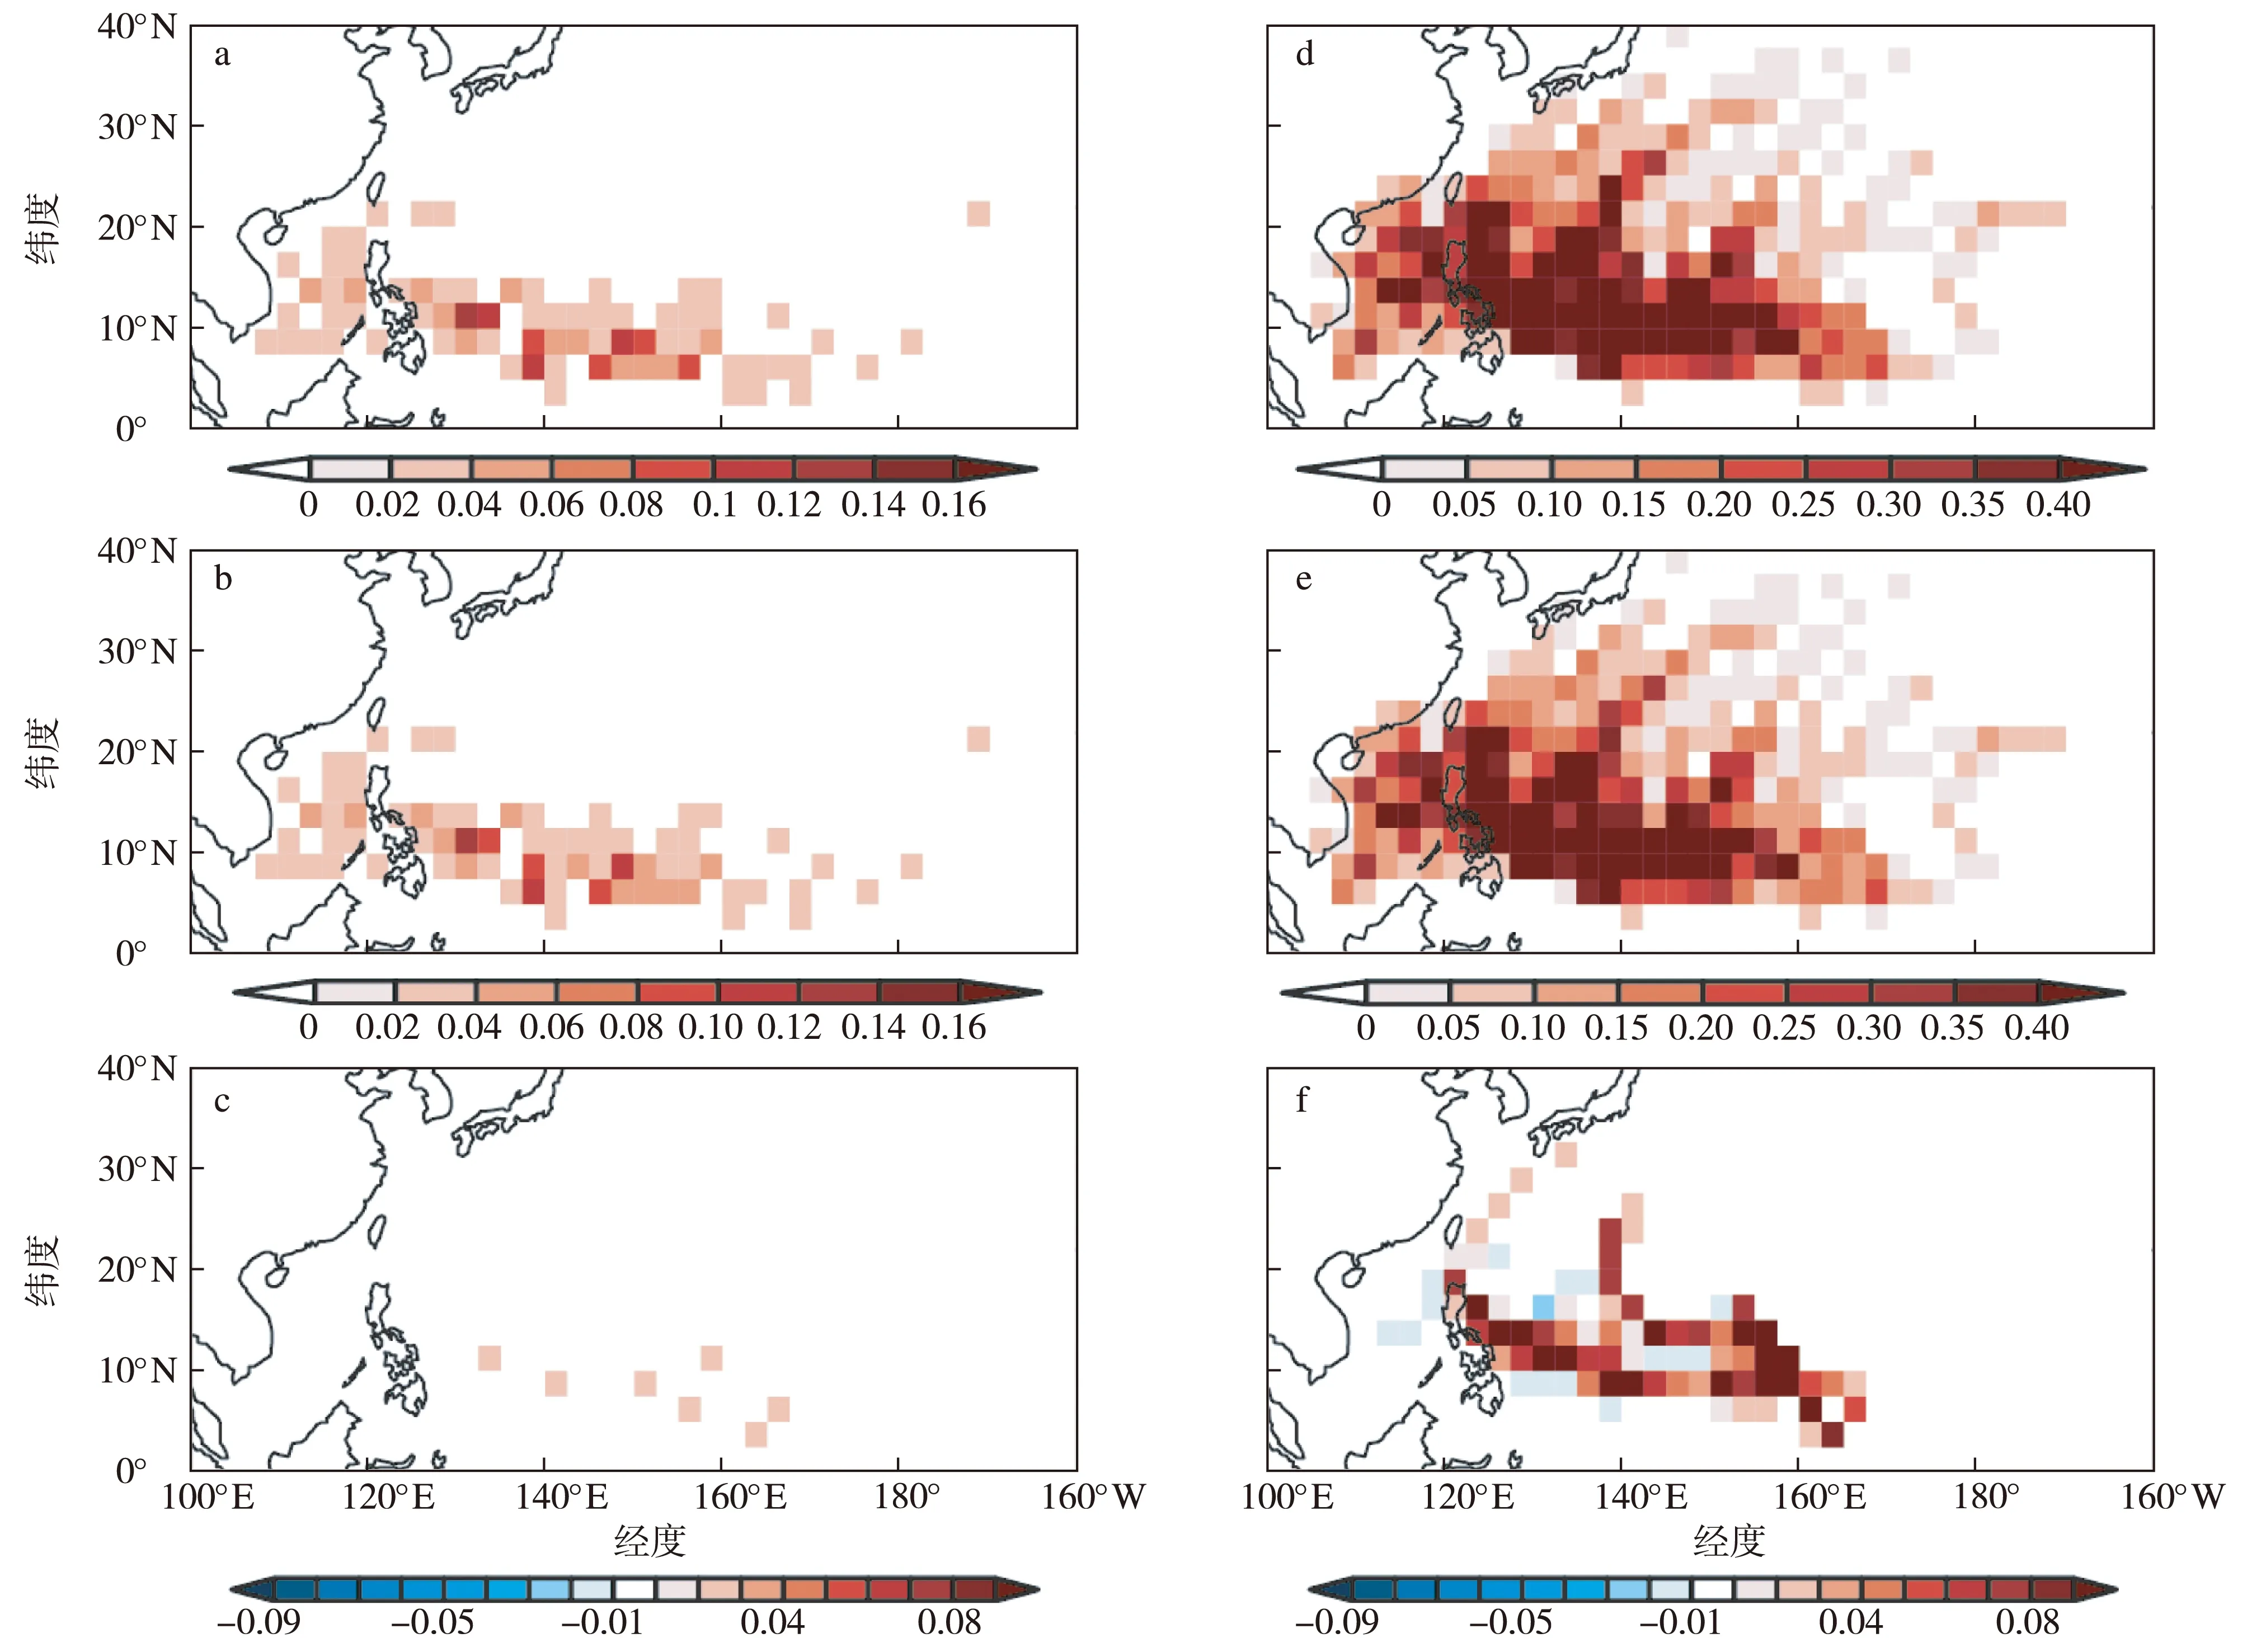
图3 西北太平洋1—5月TS生成(a—c)及出现(d—f)频率分布(单位:a-1) a,d.1979—2015年气候平均;b,e.1979—2014年气候平均;c.a与b的差值;f.d与e的差值Fig.3 The frequency of TS (a—c)genesis and (d—f)occurrence(units:a-1) during January to May over the western North Pacific:(a,d)1979—2015 climatological mean;(b,e)1979—2014;(c)difference between (a) and (b);(f)difference between (d) and (e)
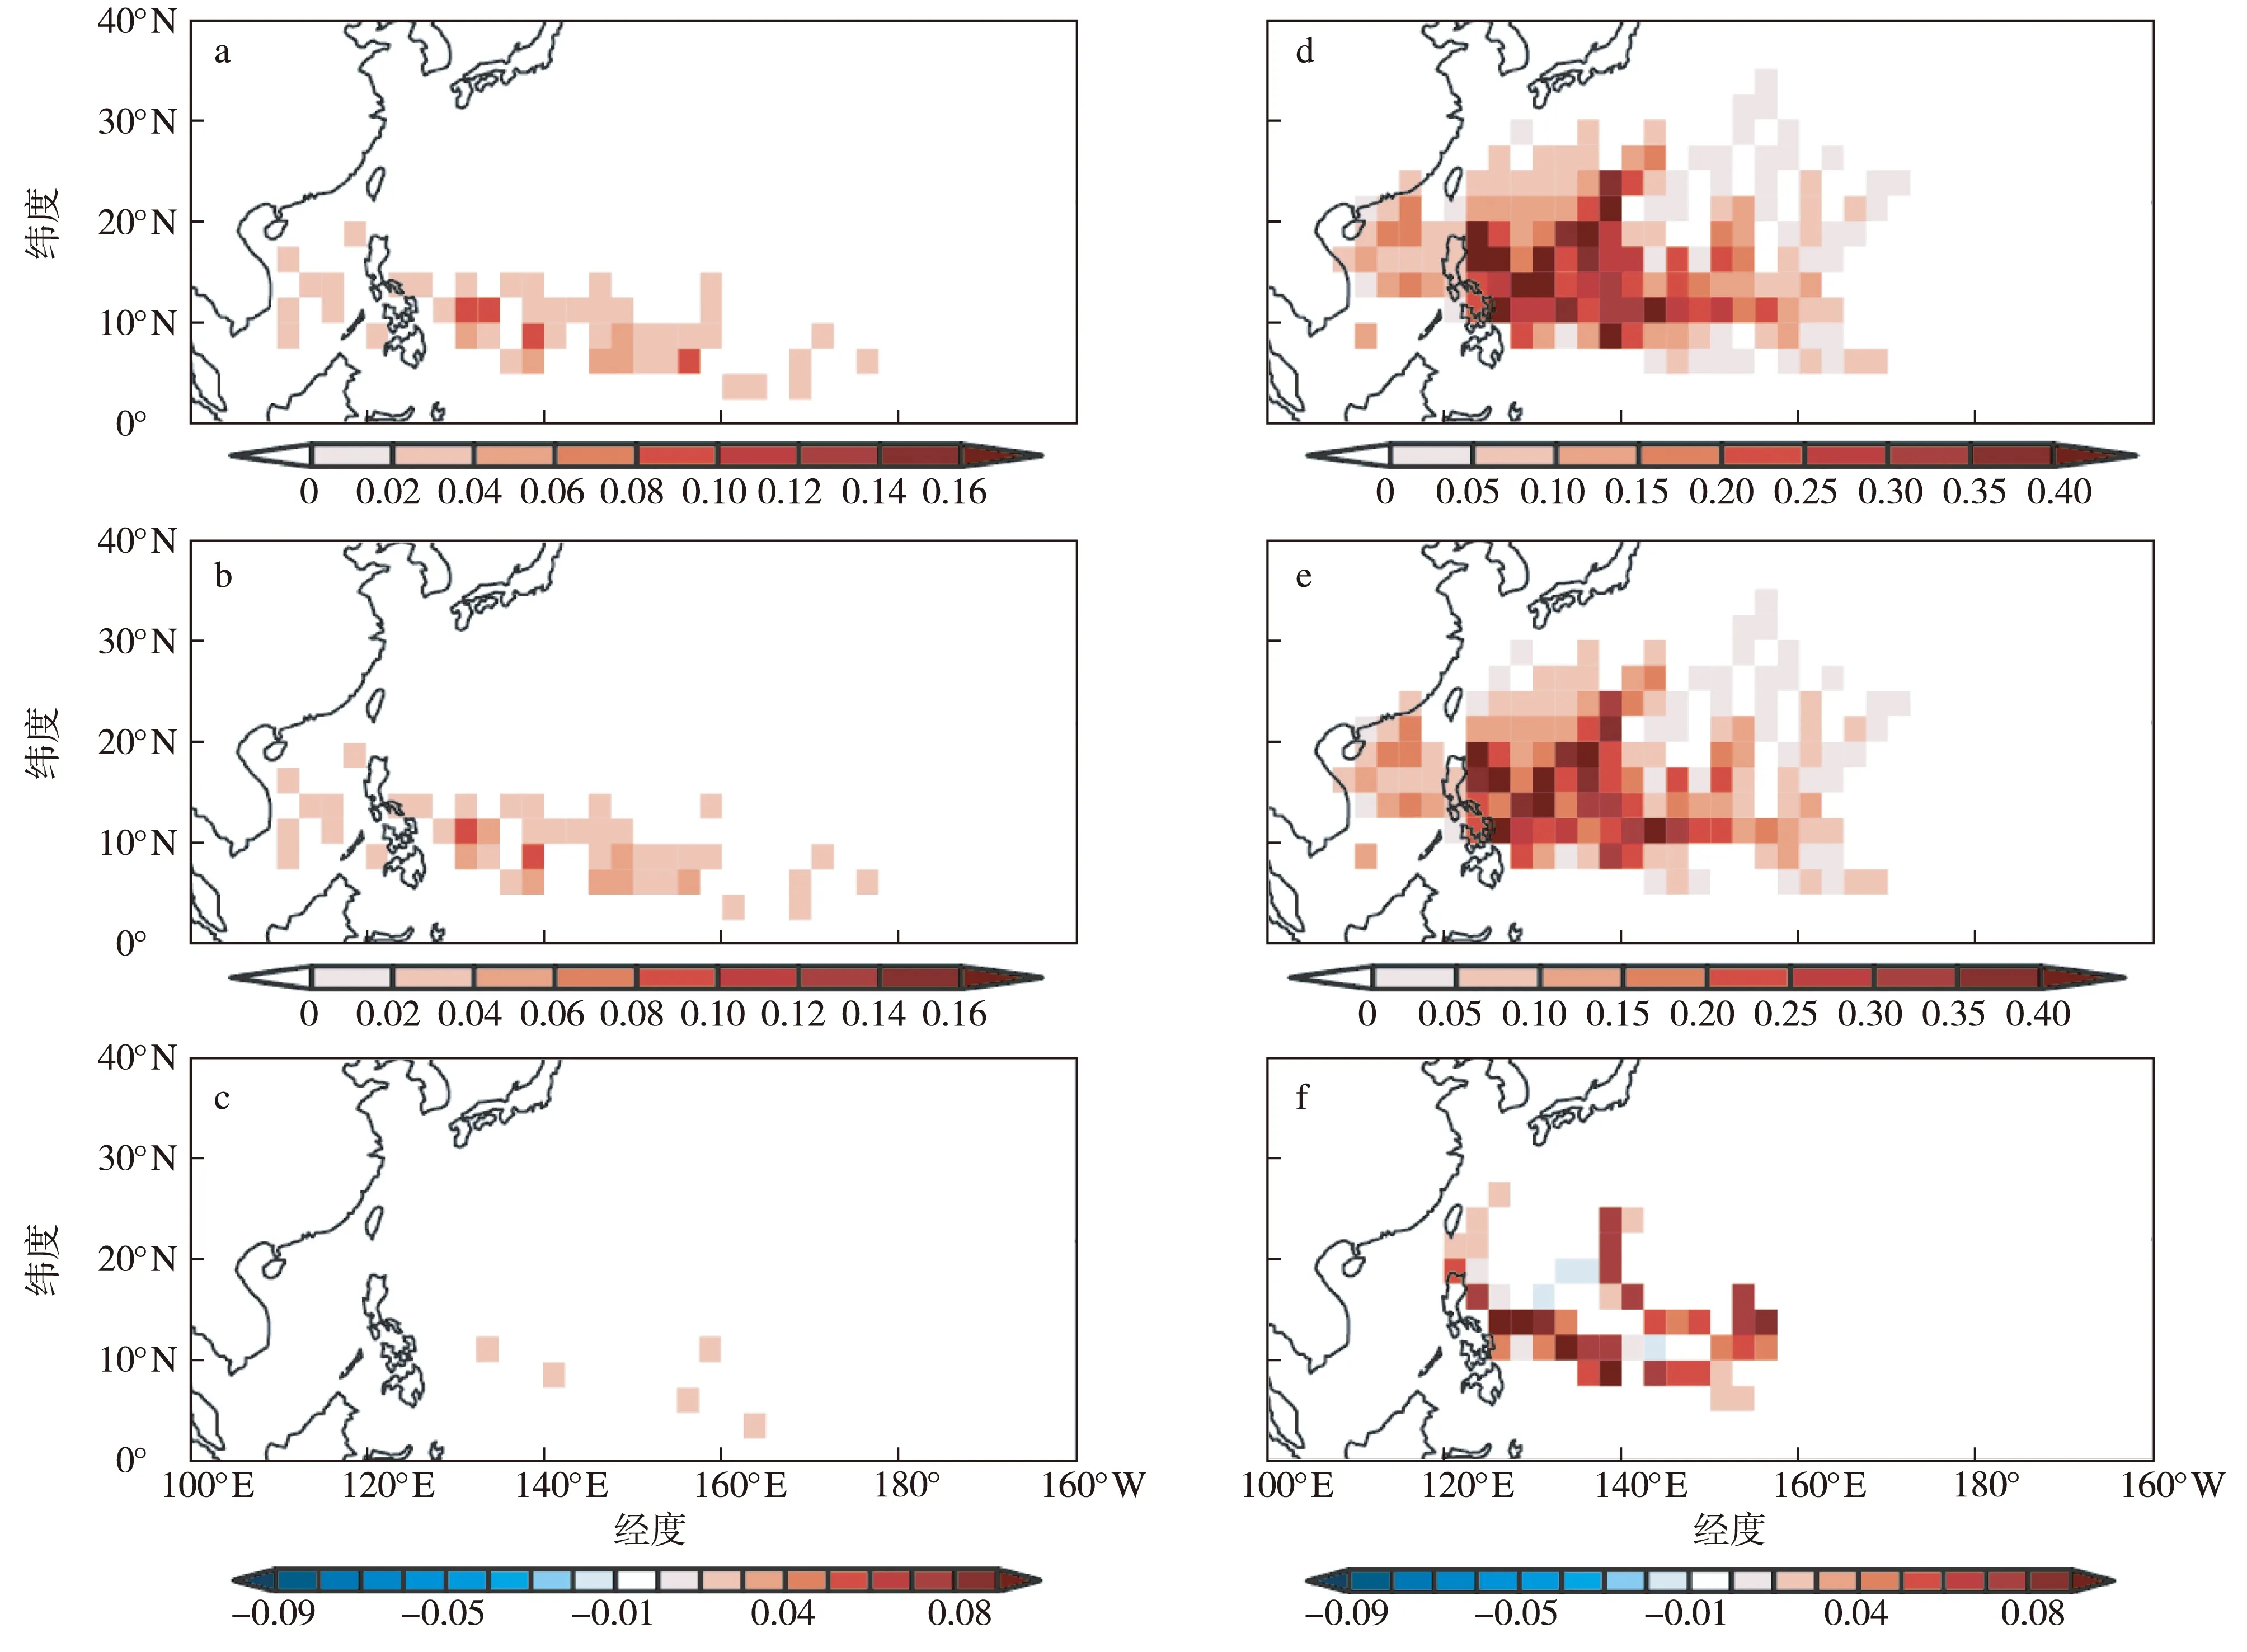
图4 西北太平洋1—5月TY生成(a—c)及出现(d—f)频率分布(单位:a-1) a,d.1979—2015年气候平均;b,e.1979—2014年气候平均;c.a与b的差值;f.d与e的差值Fig.4 The frequency of TY (a—c)genesis and (d—f)occurrence(units:a-1) during January to May over the western North Pacific:(a,d)1979—2015 climatological mean;(b,e)1979—2014;(c)difference between (a) and (b);(f)difference between (d) and (e)
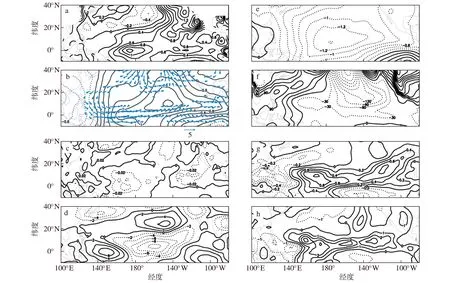
图5 2015年1—5月海表面温度(a;单位:℃)、850 hPa流函数[b;蓝色风标为风场(单位:m·s-1);单位:10-6 m2·s-1]、500 hPa垂直速度(c;单位:Pa·s-1)、垂直风切变(d;单位:m·s-1)、850 hPa的速度势(e;单位:10-6 m2·s-1)、平均海平面气压(f;单位:Pa)、400~700 hPa各层平均的比湿(g;单位:10-3kg·kg-1)和(h)降水(h;单位:mm·d-1)的距平场分布(实线代表正距平,虚线代表负距平)Fig.5 Large-scale environmental anomalies for January to May 2015:(a)SST(units:℃);(b)850 hPa stream function(units:10-6 m2·s-1) and wind fields(blue vectors;units:m·s-1);(c)ω(units:Pa·s-1);(d)vertical wind shear(units:m·s-1);(e)velocity potential(units:10-6 m2·s-1);(f)mean sea level pressure(units:Pa);(g)400—700 hPa averaged humidity(units:10-3 kg·kg-1);(h)precipitation(units:mm·d-1)(solid lines represent positive anomalies;dotted lines represent negative anomalies)
3.2 潜在生成指数(GPI)分析
图5说明了西北太平洋上的动力因子(低层正涡度、低压、上升运动、垂直风切变)和热力因子(暖海温、湿度增加)均提供了2015年年初台风发生的有利条件,为了进一步确认这些因子的相对贡献,进一步计算热带气旋的潜在生成指数(GPI)。图6是2015年1—5月的GPI相对于气候平均的总变化(图6a)和GPI每一项变量的改变造成的GPI的变化(图6b—6f)。GPI的正异常距平区位于140°E以东的热带太平洋区,与TS/TY生成增多的区域(图3c,图4c)非常接近。异常的气旋性涡度(图6b)、较湿的中低层大气(图6c)、上升运动(图6f)以及与海温及大气温度有关的PI项(图6d)都在2015年1—5月提供了一个有利热带气旋生成的环境条件。通过对它们在TS/TY生成关键区域(130~170°E,2.5~12.5°N)进行区域平均后发现(图7),其中涡度项的贡献最大,达到了83%,其次是相对湿度项(45%),PI项和垂直速度项作用相当(18%),而垂直切变项的正贡献出现在170°E以东,在关键区的平均贡献为负值(-64%)。
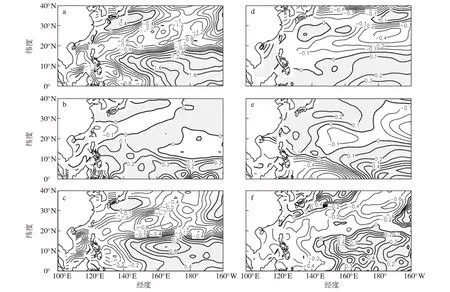
图6 2015年1—5月的GPI距平(a)及由各分项导致的GPI差异(b—f分别为涡度、相对湿度、PI、垂直风切变和垂直速度的贡献;阴影部分代表正距平的区域)Fig.6 (a)GPI anomaly during January—May 2015 and the GPI changes induced by individual terms:(b)vorticity;(c)RH;(d)PI;(e)vertical shear;(f)ω effects(shading represents positive anomalies)
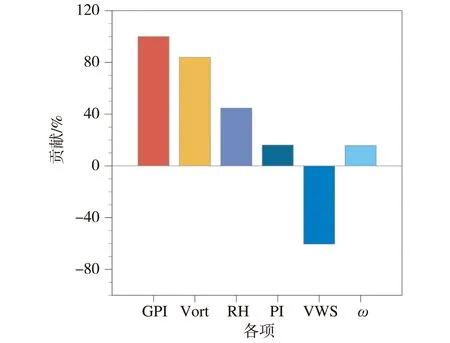
图7 TS/TY生成关键区(130~170°E,2.5~12.5°N)区域的平均GPI变化(各项贡献之和)及其各项贡献的百分比(单位:%)Fig.7 Changes in total GPI(sum of each budget term) and each budget term over the key region(2.5—12.5°N,130—170°E) for tropical storms/typhoon genesis
3.3 水汽方程诊断分析
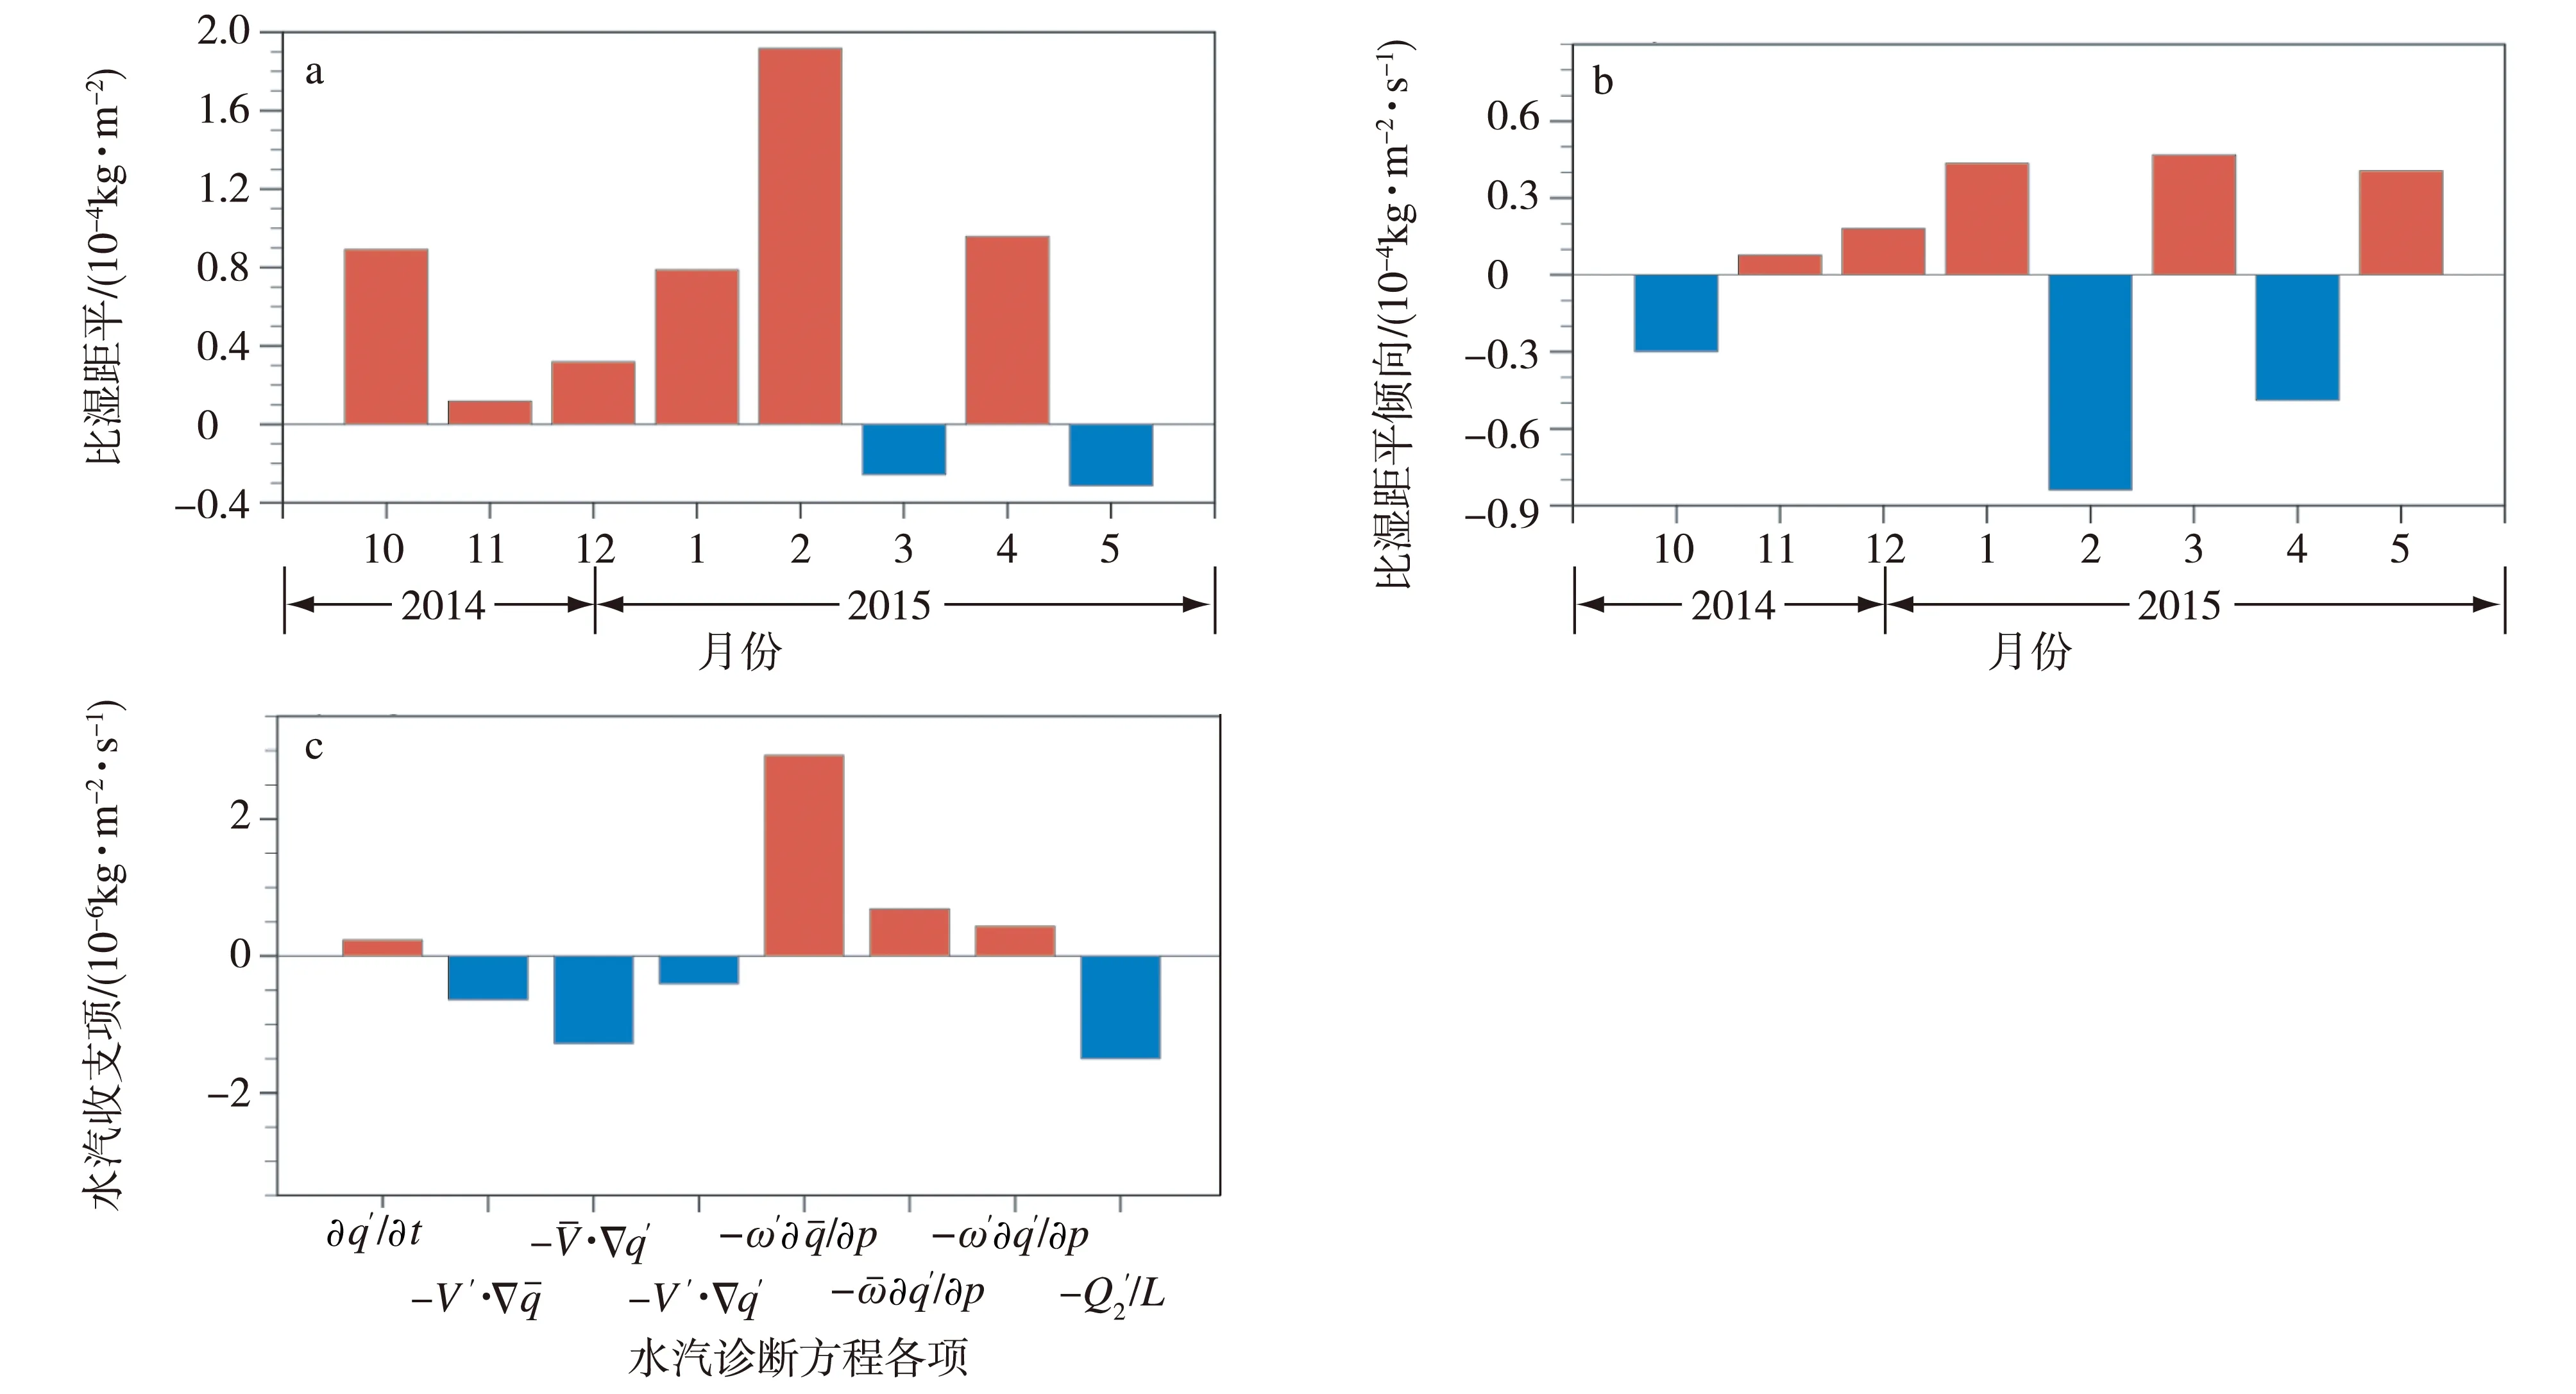
图8 2014年10月—2015年5月逐月的400~700 hPa积分的比湿距平(a;单位:10-4 kg·m-2)、比湿距平倾向(b;单位:10-6 kg·m-2·s-1)在TS/TY生成关键区(130~170°E,2.5~12.5°N)的变化以及2014年11月—2015年1月平均的400~700 hPa积分的水汽收支项(c;单位:10-6 kg·m-2·s-1)Fig.8 (a)400—700 hPa integrated monthly moisture anomaly(units:10-4 kg·m-2) and (b)anomalous moisture tendency(units:10-6 kg·m-2·s-1) over the TS/typhoon genesis region(2.5—12.5°N,130—170°E) during October 2014 to May 2015,and (c)moisture budget terms(units:10-6 kg·m-2·s-1) averaged from November 2014 to January 2015
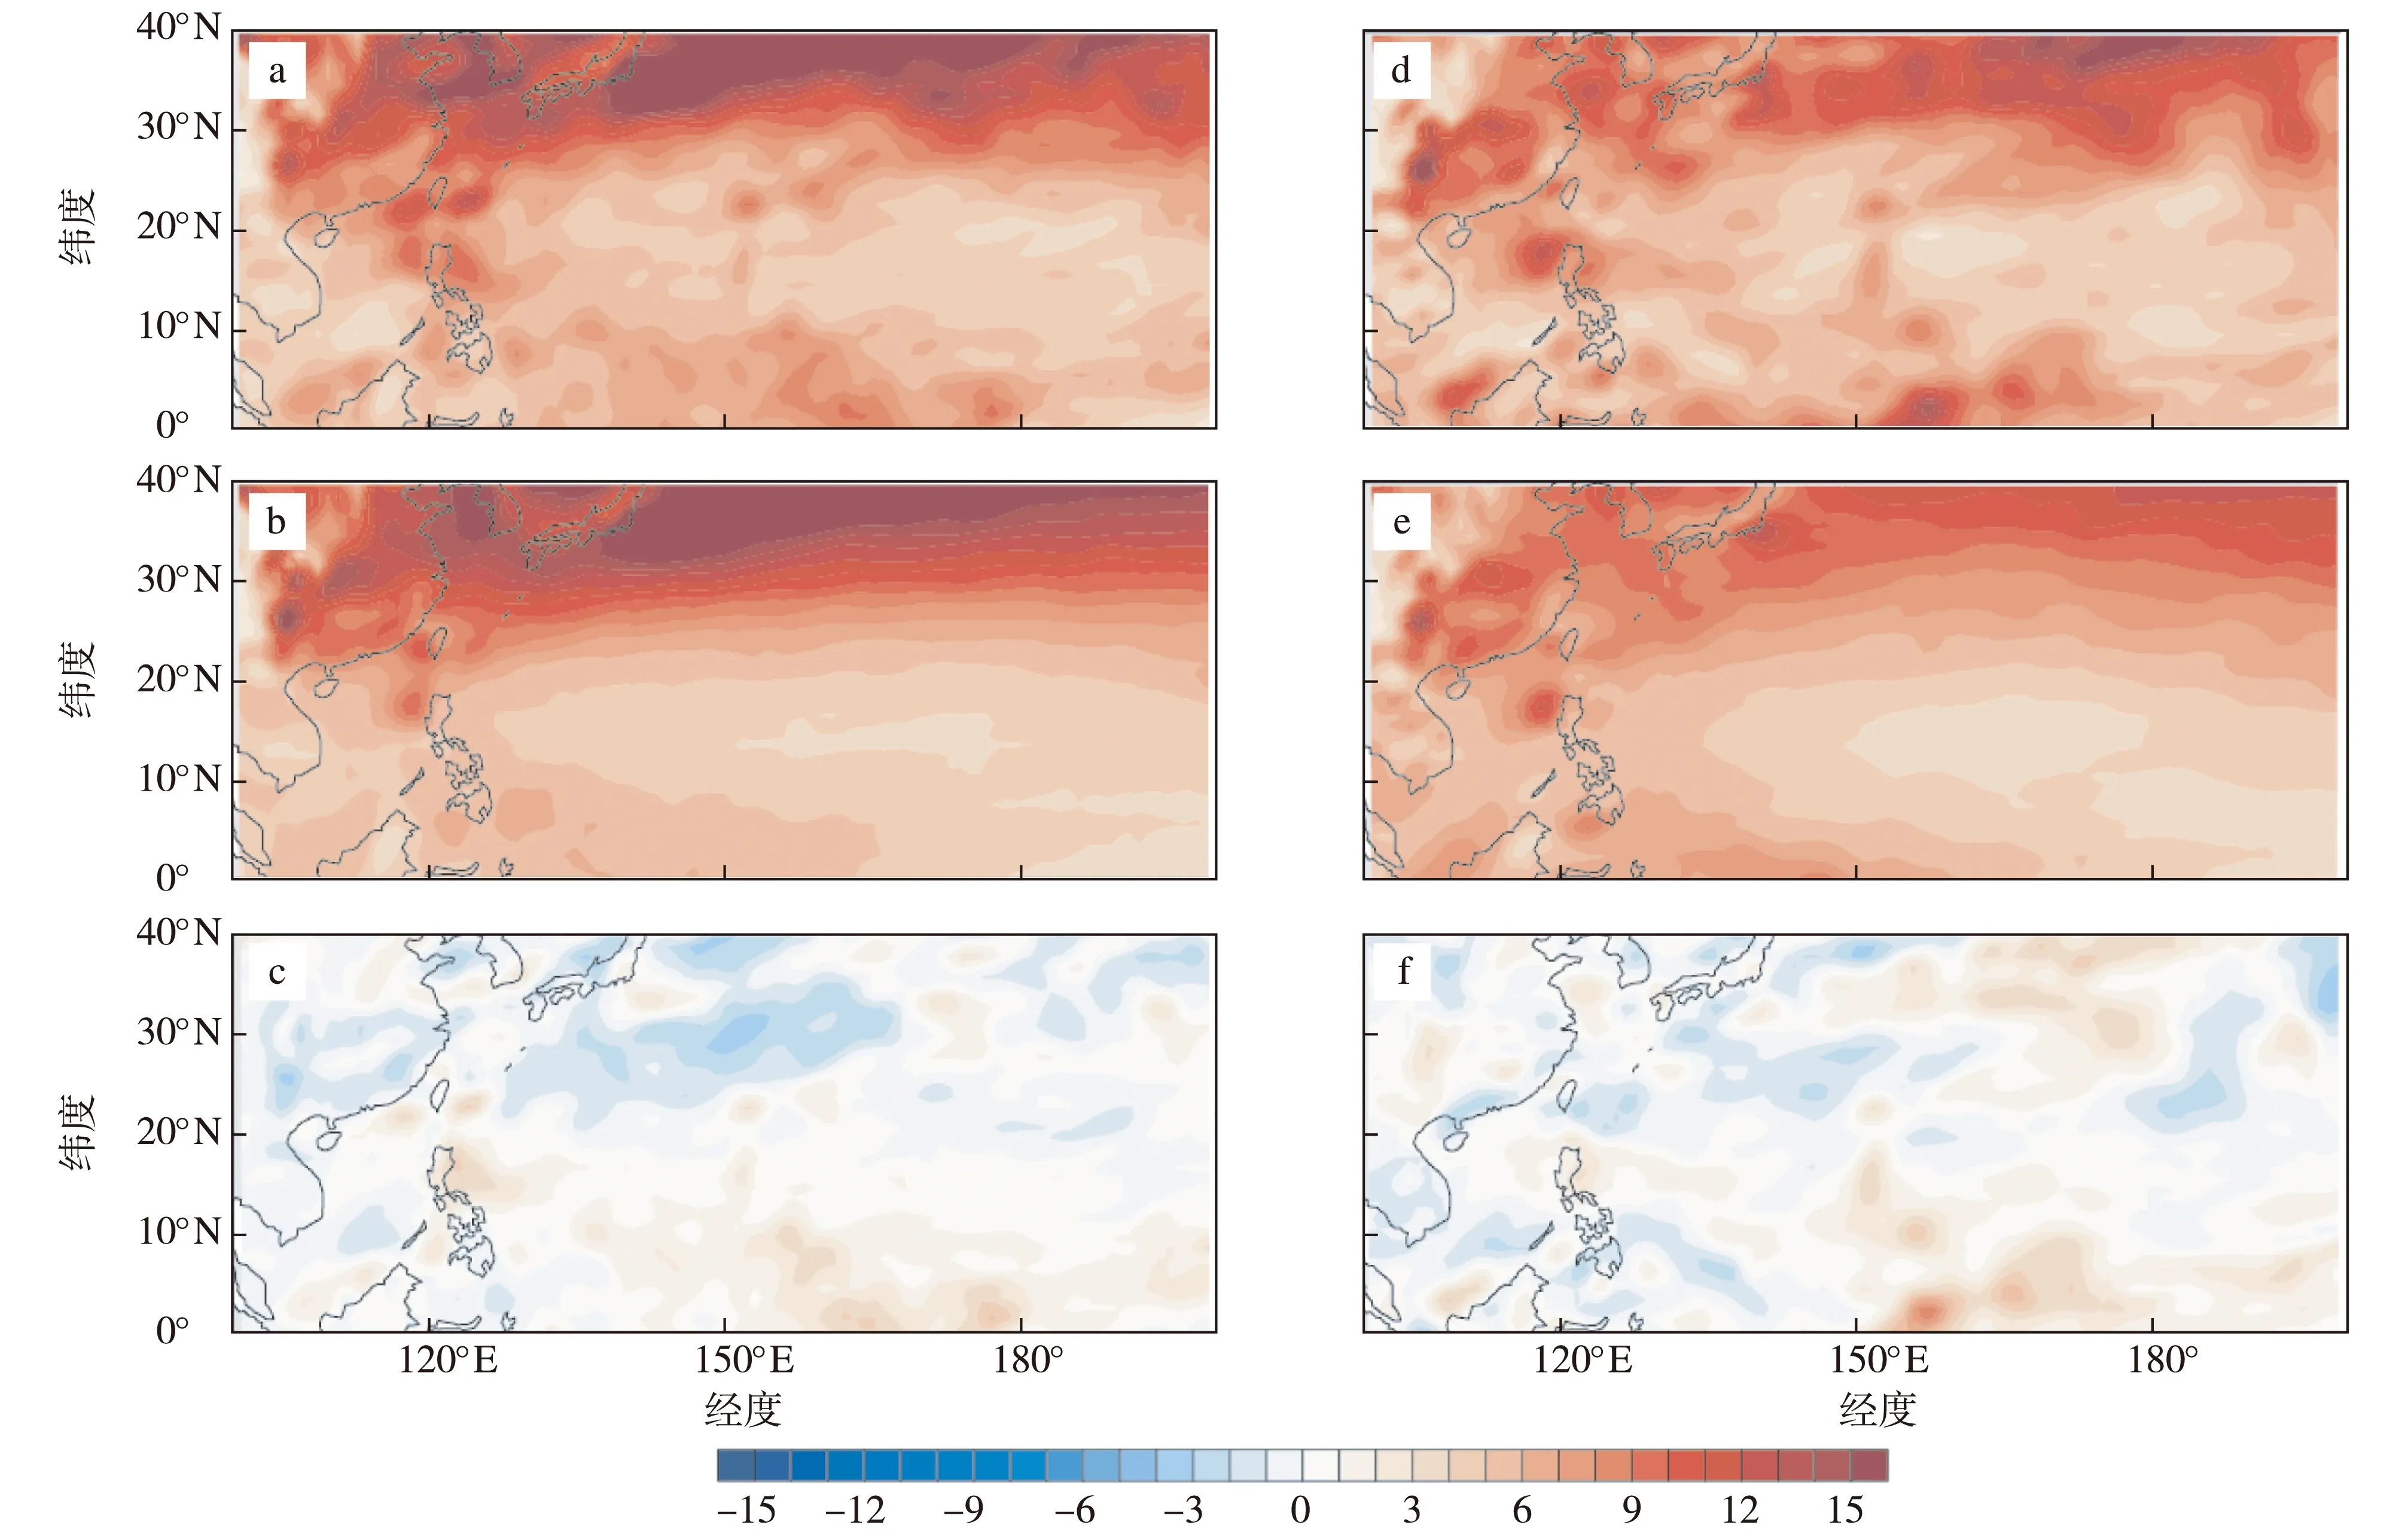
图9 2015年1—5月平均(a,d)和1979—2015年1—5月气候平均(b,e)的3~10 d(a—c)和10~90 d(d—f)涡度标准差以及两者的差值(c,表示a减去b;f,表示d减去e)(单位:10-5s-1)Fig.9 Standard deviations of (a—c)3—10-day and (d—f)10—90-day band-pass filtered vorticity in (a,d)January—May 2015 and (b,e)the 1979—2015 climatological mean,and (c,d)their respective differences(units:10-5 s-1)
4 天气尺度扰动和季内振荡异常的贡献
除了大尺度环境背景场的作用之外,许多学者的研究结果都表明天气尺度扰动和季节内振荡都对台风产生明显影响。北半球夏季期间,西北太平洋上东北—西南倾斜的天气尺度波列显著,随时间向西北移行(Li,2006;Hsu and Li,2011),观测中有许多热带低压系统在天气尺度波列中生成,因此3~10 d的天气尺度波列也称为TD-type扰动(Liebmann and Hendon,1990;Takayabu and Nitta,1993;Dunkerton and Baldwin,2015)。图9a、9b是运用Kurihara et al.(1995)去除台风的方法将大尺度环境场中的台风去除以后得到的3~10 d扰动的强度。2015年年初,天气尺度扰动活动强于气候平均态(图9c),推测有较多的TS/TY可以生成于较活跃的TD-type扰动系统。
早期的观测已经发现热带气旋活动在时间和空间上具有群发的特性(丁一汇等,1977;Gray,1979),活跃和中断的周期约为2~3周。随着全球格点资料的逐渐丰富,许多研究进一步指出热带气旋活动的周期变化与季节内振荡有关(Liebmann et al.,1994;Maloney and Hartmann,2000;祝从文等,2004;Kim et al.,2008;孙长等,2009;李崇银等,2012;何洁琳等,2013),季节内振荡处于对流位相时,低频气旋性环流和辐合区均有利于天气尺度扰动从季节内振荡获得动能,因此有较多的台风发生并且增强(陈光华和黄荣辉,2009;Hsu et al.,2011)。Camargo et al.(2009)和Zhao et al.(2015)也指出季节内尺度的中层水汽场和低层涡度场与台风活动的低频变化密切相关,同时,季节内振荡对西北太平洋地区热带气旋路径也有一定的影响(陶丽等,2012)。与天气尺度扰动相似,10~90 d季节内振荡活动在2015年初也呈现较活跃的特征,大气低频扰动的增强也可能是2015年1—5月台风生成增多的原因之一。
5 结论
2015年初活跃的台风活动与热带太平洋海温引发的大气动力和热力状态的变化有关。2014/2015年的El Nio虽然夭折,但其余留下的赤道暖海温于2014年底至2015年初开始持续增强(图1),至2015年底达到最强。2015年初(1—5月)在赤道中东太平洋海温加热的作用下,西北太平洋大气出现罗斯贝波响应(Gill,1980),因此在西北太平洋上为气旋性环流盘据,低层西风使赤道信风减弱,垂直风切变随之减弱;同时Walker环流上升支加强,中低层大气水汽充足,降水导致较高的非绝热加热作用,这些大尺度海—气条件提供了TS/TY生成的有利大尺度环境(图5)。
而水汽平流为负贡献。
除了大尺度环境场对于台风生成的贡献之外,2015年年初西北太平洋地区的3~10 d天气尺度扰动和10~90 d季节内振荡活动也明显增强(图9),这些活跃的大气高频、低频扰动系统,也为TS/TY的生成提供了可能的有利条件(Takayabu and Nitta,1993;Liebmann et al.,1994;Maloney and Hartmann,2000)。
过去研究发现ENSO会影响西北太平洋台风季(6—10月)的TS活动(Chan,1985;Chen et al.,1998;Chia and Ropelewski,2002;Wang and Chan,2002),本研究则进一步指出,ENSO可能也会对台风季的起始产生调控作用。此次2015/2016超级厄尔尼诺事件使2015年台风季提早发生,且2016年台风季延迟发生(第1个台风出现在2016年7月)。本文讨论了2015年台风季提早发生的原因,未来将对2016年台风季延迟发生的原因,以及ENSO如何影响台风季早晚的机制进行深入研究。
References)

Adler R F,Huffman G J,Chang A,et al.,2003.The version 2 Global Precipitation Climatology Project(GPCP) monthly precipitation analysis(1979—present)[J].J Hydrometeor,4(6):1147-1167.
Bister M,Emanuel K A,1998.Dissipative heating and hurricane intensity[J].Meteor Atmos Phys,65(3):233-240.
Bradley R S,Diaz H F,Kiladis G N,et al.,1987.ENSO signal in continental temperatures and precipitation records[J].Nature,327(6122):497-501.
Camargo S J,Sobel A H,2005.Western North Pacific tropical cyclone intensity and ENSO[J].J Climate,18(15):2996-3006.
Camargo S J,Robertson A W,Gaffney S J,et al.,2007.Cluster analysis of typhoon racks:Part II:Large-scale circulation and ENSO[J].J Climate,20(14):3654-3676.
Camargo S J,Wheeler M C,Sobel A H,2009.Diagnosis of the MJO modulation of tropical cyclogenesis using an empirical index[J].J Atmos Sci,66(10):3061-3074.
Camargo S J,Sobel A H,Barnston A G,et al.,2010.The influence of natural climate variability on tropical cyclones,and seasonal forecasts of tropical cyclone activity[J].Global Perspectives on Tropical Cyclones,4(11):325-359.
Chan J C L,1985.Tropical cyclone activity in the Northwest Pacific in relation to the El Nio/Southern Oscillation phenomenon[J].Mon Wea Rev,113(4):599-606.
Chan J C L,2000.Tropical cyclone activity over the western North Pacific associated with El Nio and La Nia events[J].J Climate,13(16):2960-2972.
Chan J C L,2007.Interannual variations of intense typhoon activity[J].Tellus,59A(4):455-460.
陈光华,黄荣辉,2009.西北太平洋低频振荡对热带气旋生成的动力作用及其物理机制[J].大气科学,33(2):205-214. Chen G H,Huang R H,2009.Dynamical effects of low frequency oscillation on tropical cyclogenesis over the western North Pacific and the physical mechanisms[J].Chin J Atmos Sci,33(2):205-214.(in Chinese).
Chen T C,Weng S P,Yamazaki N,et al.,1998.Interannual variation in the tropical cyclone activity over the western North Pacific[J].Mon Wea Rev,126:1080-1090.
Chia H H,Ropelewski C F,2002.The interannual variability in the genesis location of tropical cyclones in the northwest Pacific[J].J Climate,15(20):2934-2944.
Dee D P,Uppala S M,Simmons A J,et al.,2011.The ERA-Interim reanalysisi:Configuration and performance of the data assimilation system[J].Quart J Roy Meteor Soc,137(656):553-597.
丁一汇,范惠君,薛秋芳,1977.热带辐合区中多台风同时发展的初步研究[J].大气科学,1(2):89-98. Ding Y H,Fan H J,Xue Q F,1977.A preliminary study on the simultaneous developments of the multiple typhoons in the intertropical convergence zone[J].Chin J Atmos Sci,1(2):89-98.(in Chinese).
Duchon C E,1979.Lanczos filtering in one and two dimensions[J].J Appl Meteor,18(8):1016-1022.
Dunkerton T J,Baldwin M P,2015.Observation of 3-6-day meridional wind oscillations over the tropical Pacific,1973—1992:Horizontal structure and propagation[J].J Atmos Sci,52(10):1585-1601.
Emanuel K A,1995.Sensitivity of tropical cyclones to surface exchange coefficients and a revised steady-state model incorporating eye dynamics[J].J Atmos Sci,52(22):3969-3976.
Emanuel K A,Nolan D S,2004.Tropical cyclone activity and global climate[C]//26th conference on hurricanes and tropical meteorology,Miami FL:Amer Meteor Soc.
Gergis J L,Fowler A M,2005.Classification of synchronous oceanic and atmospheric El Nio-Southern Oscillation(ENSO) events for palaeoclimate reconstruction[J].Int J Climatol,25(12):1541-1565.
Gill A E,1980.Some simple solutions for heat-induced tropical circulation[J].Quart J Roy Meteor Soc,106(449):447-462.
Gray W M,1979.Hurricanes:Their formation,structure and likely role in the tropical circulation.Meteorology over the tropical oceans[M].Bracknall:Royal Meteorological Society.
Gray W M,1984.Atlantic seasonal hurricane frequency.Part I:El Nio and 30 mb quasi-biennial oscillation influences[J].Mon Wea Rev,112(9):1649-1668.
何洁琳,段安民,覃卫坚,2013.热带大气季节内振荡与西北太平洋热带气旋活动的季节预测:统计事实研究[J].气候与环境研究,18(1):101-110. He J L,Duan A M,Qin W J,2013.Statistics on the modulation of Madden-Julian oscillation on tropical cyclone activity in the western North Pacific[J].Climatic Environ Res,18(1):101-110.(in Chinese).
Hsu H H,Hung C H,Lo A K,et al.,2008.Influence of tropical cyclones on the estimation of climate variability in the tropical western North Pacific[J].J Climate,21(12):2960-2975.
Hsu P C,Li T,Tsou C H,2011.Interactions between boreal summer intraseasonal oscillations and synoptic-scale disturbances over the western North Pacific.Part I:Energetics diagnosis[J].J Climate,24(3):927-941.
Hsu P C,Li T,2011.Interactions between boreal summer intraseasonal oscillations and synoptic-scale disturbances over the western North Pacific.Part II:Apparent heat and moisture sources and eddy momentum transport[J].J Climate,24(3):942-961.
Jin F F,1997.An equatorial ocean recharge paradigm for ENSO.Part I:Conceptual model[J].J Atmos Sci,54(7):811-829.
Kim J H,Ho C H,Kim H S,et al.,2008.Systematic variation of summertime tropical cyclone activity in the western North Pacific in relation to the Madden-Julian oscillation[J].J Climate,21(6):1171-1191.
Kurihara Y,Bender M A,Tuleya R E,et al.,1995.Improvements in the GFDL hurricane prediction system[J].Mon Wea Rev,123(9):2791-2801.
Levine A F Z,McPhaden M J,2016.How the July 2014 easterly wind burst gave the 2015/2016 El Nio a head start[J].Geophys Res Lett,43(12):6503-6510.
李崇银,潘静,田华,2012.西北太平洋台风活动与大气季节内振荡[J].气象,38(1):1-16. Li C Y,Pan J,Tian H,2012.Typhoon activities over western North Pacific and atmospheric intraseasonal oscillation[J].Meteor Mon,38(1):1-16.(in Chinese).
Li T,2006.Origin of the summertime synoptic-scale wave train in the western North Pacific[J].J Atmos Sci,63(3):1390-1409.
Liebmann B,Hendon H H,1990.Synoptic-scale disturbances near the equator[J].J Atmos Sci,47(12):1463-1479.
Liebmann B,Hendon H H,Glick J D,1994.The relationship between tropical cyclones of the western Pacific and Indian Oceans and the Madden-Julian oscillation[J].J Meteor Soc Japan,72(3):401-411.
Maloney E D,Hartmann D L,2000.Modulation of hurricane activity in the Gulf of Mexico by the Madden-Julian oscillation[J].Science,287(5460):2002-2004.
Murakami H,Wang B,2010.Future change of North Atlantic tropical cyclone tracks:Projection by a 20-km-mesh global atmospheric model[J].J Climate,23(10):2699-2721.
Pielke J R A,Landsea C W,1999.La Nia,El Nio and Atlantic hurricane damages in the United States[J].Bull Amer Meteor Soc,80(10):2027-2033.
Ropelewski C F,Halpern M S,1987.Global and regional scale precipitation patterns associated with the El Nio/Southern Oscillation[J].Mon Wea Rev,115(8):1606-1626.
Smith T M,Reynolds R W,2003.Extended reconstruction of global sea surface temperatures based on COADS data(1854—1997)[J].J Climate,16(10):1495-1510.
Song J J,Wang Y,Wu L,2010.Trend discrepancies among three best track data sets of western North Pacific tropical cyclones[J].J Geophys Res,115(D12),D12128.
Su J,Li T,Zhang R,2014.The initiation and developing mechanisms of central Pacific El Nio[J].J Climate,27(12):4473-4485.
孙长,毛江玉,吴国雄,2009.大气季节内振荡对夏季西北台平洋热带气旋群发性的影响[J].大气科学,33(5):950-958. Sun C,Mao J Y,Wu G X,2009.Influences of intraseasonal oscillations on the clustering of tropical cyclone activities over the western North Pacific during boreal summer[J].Chin J Atmos Sci,33(5):950-958.(in Chinese).
Takayabu Y N,Nitta T,1993.3~5 day-period disturbances coupled with convection over the tropical Pacific ocean[J].J Meteor Soc Japan,71(2):221-246.
陶丽,李双君,濮梅娟,等,2012.热带大气准双周振荡对西北太平洋地区热带气旋路径的影响[J].大气科学学报,35(4):404-414. Tao L,Li S J,Pu M J,et al.,2012.Impact of QBW on TC’s track change over the western North Pacific[J].Trans Atmos Sci,35(4):404-414.(in Chinese).
陶丽,靳甜甜,濮梅娟,等,2013.西北太平洋热带气旋气候变化的若干研究进展[J].大气科学学报,36(4):504-512. Tao L,Jin T T,Pu M J,et al.,2013.Review of the researches on climatological variations of tropical cyclones over western North Pacific[J].Trans Atmos Sci,36(4):504-512.(in Chinese).
Trenberth K E,1997.The definition of El Nio[J].Bull Amer Meteor Soc,78(12):2771-2777.
Wang B,Chan J C L,2002.How strong ENSO events affect tropical storm activity over the western North Pacific[J].J Climate,15(13):1643-1658.
Wu G,Lau N C,1992.A GCM simulation of the relationship between tropical-storm formation and ENSO[J].Mon Wea Rev,120(6):958-977.
Wu L,Zhao H,2012.Dynamically derived tropical cyclone intensity changes over the western North Pacific[J].J Climate,25(1):89-98.
Wu M C,Chang W L,Leung W M,2004.Impacts of El Nio southern oscillation events on tropical cyclone landfalling activity in the western North Pacific[J].J Climate,17(6):1419-1428.
Yanai M,Esbensen S,Chu J H,1973.Determination of bulk properties of tropical cloud clusters from large-scale heat and moisture budgets[J].J Atmos Sci,30(4):611-627.
Zhao H,Jiang X,Wu L,2015.Modulation of Northwest Pacific tropical cyclone genesis by the intraseasonal variability[J].J Meteor Soc Japan,93:103-119.
祝从文,Nakazawa T,李建平,2004.大气季节内振荡对印度洋—西太平洋地区热带低压/气旋生成的影响[J].气象学报,62(1):42-50. Zhu C W,Nakazawa T,Li J P,2004.Modulation of tropical depression/cyclone over the Indian western Pacific oceans by Madden-Julian oscillation[J].Acta Meteorologica Sinica,62(1):42-50.(in Chinese).
Early onset of the typhoon season over the western North Pacific in 2015:Influence of the 2015/2016 super El Nio event
QIAN Yitian,HSU Pang-chi
KeyLaboratoryofMeteorologicalDisasterofMinistryofEducation(KLME)/JointInternationalResearchLaboratoryofClimateandEnvironmentChange(ILCEC)/CollaborativeInnovationCenteronForecastandEvaluationofMeteorologicalDisasters(CIC-FEMD),NanjingUniversityofInformationScience&Technology,Nanjing210044,China
To investigate what mechanisms induced the earlier onset of the typhoon season in 2015,we diagnosed the large-scale environments from ERA-Interim and NOAA ERSST data.The results show that the unusual growth of TS activity in early 2015 was related to the anomalous air-sea conditions of the 2015/2016 super El Nio event.The anomalous warming over the central equatorial Pacific associated with the abortion of the 2014/2015 El Nio was accompanied by a cyclonic anomaly,low-level convergence and increased atmospheric moisture content over the WNP,where tropical cyclones were generated.We further analyzed the genesis potential index(GPI) to understand the relative roles of different dynamic and thermodynamic effects in the increased number of typhoons during January to May 2015,as compared to the climatological state.The results of the GPI diagnosis indicated that the dynamic(low-level vorticity and vertical velocity) and thermodynamic(potential intensity related to sea surface and air temperature and atmospheric relative humidity in the lower to middle levels) factors both contributed positively to the increases in typhoon genesis during January to May in 2015.The low-level vorticity anomaly showed the largest contribution,while the enhanced relative humidity was the secondary contributor.The former may have been related to the Rossby wave response to the warm sea surface temperature in the central equatorial Pacific.The low-level westerly wind associated with the cyclonic anomaly may have weakened the trade winds and vertical wind shear.The processes related to increased moisture content were examined in detail through moisture budget diagnosis.The leading term was related to the advection of low-level seasonal mean moisture in the warm pool via the anomalous ascending motion of the Walker circulation.The strengthened vertical moisture advection rapidly increased from November 2014 to January 2015 and reached its maximum value in February 2015,resulting in mid-level moistening and atmospheric diabatic heating.Apart from the influence of large-scale air-sea conditions,3—10-day synoptic-scale disturbances and 10—90-day intraseasonal oscillation were also enhanced during January to May 2015,favoring the genesis and development of tropical depressions/typhoon systems.
(责任编辑:孙宁)
钱伊恬,徐邦琪,2016.2015年西北太平洋台风季提早展开:2015/2016超级厄尔尼诺的影响[J].大气科学学报,39(6):788-800. Qian Y T,Hsu P C,2016.Early onset of the typhoon season over the western North Pacific in 2015:Influence of the 2015/2016 super El Nio event[J].Trans Atmos Sci,39(6):788-800.
10.13878/j.cnki.dqkxxb.20161012010.(in Chinese).
10.13878/j.cnki.dqkxxb.20161012010
*联系人,E-mail:pangchi@nuist.edu.cn
