miRNA targeted signaling pathway in the early stage of denervated fast and slow muscle atrophy
2016-12-01GangLiQingshanLiWenbinLiJianWeiWenkaiChangZhiChenHuyunQiaoYingweiJiaJianghuaTianBingshengLiangDepartmentofOrthopedicsSecondAffiliatedHospitalofShanxiMedicalUniversityTaiyuanShanxiProvinceChina
Gang Li, Qing-shan Li, Wen-bin Li, Jian Wei, Wen-kai Chang, Zhi Chen, Hu-yun Qiao, Ying-wei Jia, Jiang-hua Tian, Bing-sheng LiangDepartment of Orthopedics, Second Affiliated Hospital of Shanxi Medical University, Taiyuan, Shanxi Province, China
miRNA targeted signaling pathway in the early stage of denervated fast and slow muscle atrophy
Gang Li*,#, Qing-shan Li#, Wen-bin Li, Jian Wei, Wen-kai Chang, Zhi Chen, Hu-yun Qiao, Ying-wei Jia, Jiang-hua Tian, Bing-sheng Liang
Department of Orthopedics, Second Affiliated Hospital of Shanxi Medical University, Taiyuan, Shanxi Province, China
How to cite this article: Li G, Li QS, Li WB, Wei J, Chang WK, Chen Z, Qiao HY, Jia YW, Tian JH, Liang BS (2016) miRNA targeted signaling pathway in the early stage of denervated fast and slow muscle atrophy. Neural Regen Res 11(8)∶1293-1303.
Funding: This study was supported by the National Natural Science Foundation of China, No. 81101365, 81171722 and 81000805.
Gang Li,
ligang.shanxi@hotmail.com.
#These authors contributed
equally to this study.
orcid:
0000-0001-7530-0866
(Gang Li)
Accepted: 2016-07-26
Graphical Abstract

Denervation often results in skeletal muscle atrophy. Different mechanisms seem to be involved in the determination between denervated slow and fast skeletal muscle atrophy. At the epigenetic level, miRNAs are thought to be highly involved in the pathophysiological progress of denervated muscles. We used miRNA microarrays to determine miRNA expression profiles from a typical slow muscle (soleus muscle) and a typical fast muscle (tibialis anterior muscle) at an early denervation stage in a rat model. Results showed that miR-206, miR-195, miR-23a, and miR-30e might be key factors in the transformation process from slow to fast muscle in denervated slow muscles. Additionally, certain miRNA molecules (miR-214, miR-221, miR-222, miR-152, miR-320, and Let-7e) could be key regulatory factors in the denervated atrophy process involved in fast muscle. Analysis of signaling pathway networks revealed the miRNA molecules that were responsible for regulating certain signaling pathways, which were the final targets (e.g., p38 MAPK pathway; Pax3/Pax7 regulates Utrophin and follistatin by HDAC4; IGF1/PI3K/Akt/mTOR pathway regulates atrogin-1 and MuRF1 expression via FoxO phosphorylation). Our results provide a better understanding of the mechanisms of denervated skeletal muscle pathophysiology.
nerve regeneration; microRNA; expression profile; denervated skeletal muscle; gene functions; signaling pathways; neural regeneration
Introduction
Peripheral neuro-disconnection of skeletal muscle causes many types of pathophysiological changes, most importantly denervated skeletal muscle atrophy (Cea et al., 2013; Tajrishi et al., 2014). Extended disconnection from peripheral nerve fibers induces functional disorders of skeletal muscles, such as segment damage, myofibril degradation, decreased contraction speed, and disturbance of myotube formation and fibrillation (Borisov et al., 2005; de Castro Rodrigues et al., 2006; Midrio, 2006; Cea et al., 2013). These conditions eventually result in irreversible muscle dysfunction that is not rescued, even if the nerve fibers are reconnected (Salonen et al., 1985; Savolainen et al., 1988; Li et al., 2013).
MicroRNAs (miRNAs) are associated with the process of denervated skeletal muscle atrophy. The 22-nt length non-coding RNA molecules are able to regulate gene expression by inhibiting transcription and translation (Ambros, 2004; Bartel, 2004). A single mRNA has been shown to simultaneously regulated by several miRNAs (He and Hannon, 2004). Conversely, a single miRNA can target different mRNAs (Leung and Sharp, 2007). As a result, groups of proteins that are functionally connected to each other in a signaling pathway could be regulated by some miRNAs (Leung and Sharp, 2007).
Many types of skeletal muscle pathophysiologies are related to miRNA expression. Eisenberg et al. (2007) revealed differential expression patterns as a result of 185 miRNAs in primary muscle atrophy patients compared with normal patients, and 5 miRNAs (miR-146b, miR-221, miR-155, miR-214, and miR-222) were differentially expressed in those patients. Expression of miR-206 increases in the diaphragm of a mouse model of Duchenne muscular dystrophy (McCarthy et al., 2007), and miR-1 and miR-133a have been shown tobe downregulated 1 month after denervation of the rat soleus muscle and miR-206 was upregulated almost 3-fold after 1 month (Jeng et al. 2009). However, after 4 months, the same miRNA molecules were upregulated by approximately 2-fold. Injection of double-stranded (ds) miR-1, miR-133, and miR-206 into damaged skeletal muscle in rats resulted in morphological and physiological regeneration of skeletal muscle, which effectively prevented skeletal muscle fibrillation (Nakasa et al., 2010). Using microarray analysis, Hsieh et al. (2011) revealed significant expression changes in 37 of 350 miRNAs molecules.
Rapid and obvious atrophy of skeletal muscle occurs in the early stage of denervation (Adhihetty et al., 2007); the original rest satellite cells under the skeletal muscle membrane are stimulated and then differentiate into myoblasts, but those cells have difficulty forming contractile proteins with a reduced number of myotubes (Borisov et al., 2005; de Castro Rodrigues et al., 2006). The weight of the soleus and extensor digitorum longus decreases by 46.3% and 40.3%, respectively, by 14 days after denervation (Jakubiec-Puka et al., 1999). There is also evidence that slow muscle atrophies at a higher rate than fast muscle (Zeman et al., 1987; Agbenyega and Wareham, 1990; Jakubiec-Puka et al., 1999), suggesting different mechanisms for denervation in slow and fast muscles.
Very little is known about the regulatory mechanisms of miRNAs in denervated slow and fast muscle. Through the use of miRNA microarray technology, we analyzed miRNA expression in denervated skeletal muscles during the early stage of denervation (1 month after denervation). Subsequently, we identified the miRNAs that might play a key role in denervated classic slow (soleus muscle) and fast (tibialis anterior muscle) muscle atrophy. After comparing these results with the miRNA target regulatory database, we analyzed target genes and their related functions associated with signaling pathways.
Materials and Methods
Animal surgery and tissue preparation
Female adult Sprague-Dawley rats (DKY-B20121406), weighing 220-240 g, were purchased from the Department of Laboratory Animal Science, Fudan University, Shanghai, China. Animals were raised in a quiet, humidity-controlled room (22 ± 3°C and 62 ± 7% relative humidity) with a 12-hour reverse light/dark cycle and were provided a standard rodent diet and clean water ad libitum. All animal procedures were performed in accordance with the National Institutes of Health (NIH) guidelines (National Institutes of Health Publications, No. 80-23, revised 1978) by Ethics Committee, Shanxi Medical University, China. Rats (n = 20) were randomly assigned to four groups (0-, 7-, 14-, and 28-day groups), and each group contained five rats.
The animals were anesthetized by intraperitoneal injection (i.p.) of 500 mg/kg chloral hydrate. Surgery was performed under a surgical microscope. The sciatic nerve was exposed at the mid-thigh level following a dorsolateral skin incision. Right sciatic nerve severance was performed on the sciatic nerve 1 cm proximal to the nerve trifurcation. For rats in the denervation group, surgical removal of a 1-cm segment of the proximal nerve was performed, and the stump of the proximal nerve ending was ligated and cephalically transferred into the proximal thigh muscle to prevent regenerative terminal or spontaneous collateral sprouting. The rats were sacrificed, and the soleus and tibialis anterior muscles on the experimental limb were collected on days 0, 7, 14, and 28 in the above-mentioned groups (the control group was treated for muscle denervation on day 0). Tissues were stored at -80°C.
RNA extraction and miRNA microarray analysis
For Affymetrix microarray profiling, total RNA was harvested from skeletal muscle and preserved with TRIzol® reagent (Invitrogen, Vancouver, Canada), followed by purification using the RNeasy Mini Kit (Qiagen, Dusseldorf, Germany), which included DNase digestion treatment to ensure that the purification method retained low molecular weight (LMW) RNA. RNA concentrations were determined by absorbance at 260 nm, and the quality control standard was an A260/A280of 1.8-2.1, using NanoDrop 2000 (Thermo, 81 Wyman Street, Waltham, Massachusetts, USA). RNA was labeled using a FlashTag® Biotin HSR labeling kit following manufacture instructions (Genisphere, Hatfield, PA, USA). Labeled RNA was hybridized with a GeneChip® microRNA 2.0 array (Affymetrix, Santa Clara, CA, USA) according to the user manual. Affymetrix® miRNA QCTool (version 1.1.1.0 or greater) was used for the microarray analysis, including data normalization, summarization, and quality control assessment. Median-centric normalization was used for the custom microRNA oligonucleotide chips. Affymetrix chips were normalized using the robust multichip analysis (RMA) procedure (Lau et al., 2015). Clustering was performed using Cluster V.3.0 and patterns were created and viewed using Java TreeView software.
Quantitative polymerase chain reaction (q-PCR)
miRNAs were isolated with a miRNA purification kit (Kangwei Company, Xi’an, China), and synthesis of the first chain of miRNA cDNA was processed with a miRNA cDNA kit (Kangwei Company). Amplification and fluorescence tests were performed using the miRNA Real-Time PCR Assay kit (Kangwei Company) and a 7900 fluorescence quantitative PCR instrument (Applied Biosystem, Foster City, CA, USA), respectively. Relative gene sequences were searched in the miRBase database (http://www.mirbase. org/) and GeneBank. Primers (miR-10a-5p-F, ACC CTG TAG ATC CGA ATT TGT G; miR-30c-1★-F, CTG GGA GAG GGT TGT TTA CTC C; miR-30e-F, GTA AAC ATC CTT GAC TGG AAG; miR-195-F, TAG CAG CAC AGA AAT ATT GGC; miR-378-F, CTC CTG ACT CCA GGT CCT GTG T; miR-let-7c-F, TGA GGT AGT AGG TTG TAT GGT T; mir133a-F, TTT GGT CCC CTT CAA CCA GCT G; mir133b-F, TTT GGT CCC CTT CAA CCA GCT A; miR-206-F, TGG AAT GTA AGG AAG TGT GTG G; U6-F, GCT TCG GCA GCA CAT ATA CTA AAA T; and U6-R, CGC TTC ACG AAT TTG CGT GTC AT) were designed with Primer 5 software. Primer synthesis was performed by theSangon Biotech Company (Shanghai, China). U6 was used for miRNA template normalization. The reaction conditions were as follows: initial denaturation for 10 minutes at 95°C, followed by 40 cycles of denaturation for 15 seconds at 95°C, annealing for 1 minute at 60°C and extension for 1 minute at 60°C. The relative expression level of each miRNA was determined by 2-ΔΔCt, in which ΔCt = CtmiRNA-CtU6. Each sample was replicated five times.

Figure 1 Hierarchical cluster analysis.

Figure 2 miRNA expression patterns analyzed by miRNA chip and qPCR.
Significant miRNA expression pattern analysis
To effectively increase the degrees of freedom for small samples, a RVM (random variance model) corrected t-test was applied to distinguish differentially expressed genes between the control and experimental groups. Differentially expressed miRNAs were indicated by a P-value <0.05 (Wright and Simon, 2003; Yang et al., 2005; Clarke et al., 2008). Differentially expressed miRNAs were analyzed against the time after surgery with RVM-corrective ANOVA analysis. Significant miRNA expression profiles over time were captured from differentially expressed miRNAs with a Series Test of Cluster (STC) analysis (Miller et al., 2002; Ramoni et al., 2002).
TargetScan predicts biological targets of miRNAs by searching for the presence of conserved 8mer and 7mer sitesthat match the seed region of each miRNA. In mammals, predictions are ranked based on the predicted efficacy of targeting as calculated using the context+ scores of the sites. TargetScanHuman considers matches to annotated human UTRs and their orthologs as defined by UCSC whole-genome alignments. Conserved targeting has also been detected within open reading frames (ORFs). The method used by miRanda is based on dynamic programming and computing free energy. When the score value of aligning sequences (miRNA and 3′-UTR) and the free energy were greater than the corresponding pre-defined thresholds, respectively, then the gene, of which the 3′-UTR was a sub-sequence, was considered to be the target gene for that miRNA. During this process, concrete alignment was obtained.
Gene function enrichment analysis of miRNA target genes Gene Ontology (GO) analysis identified the functional characteristics of miRNA target genes that could help identify the main functions of differentially expressed miRNAs (Ashburner et al., 2000; Gene Ontology, 2006). Generally, the Fisher’s exact test and chi-square test were used to classify the GO categories, and the false discovery rate (FDR) (Dupuy et al., 2007) was calculated to correct the P-value. The significance threshold was defined by a P-value < 0.05 and FDR < 0.05.
Pathway analysis
Targeted gene pathways for differentially expressed miRNAs were explored by Pathway Analysis with KEGG (http://www. genome.jp/kegg)/, Biocarta (http://cgap.nci.nih.gov/Pathways/BioCarta_Pathways) and Reatome (http://www.reactome.org). We used Fisher’s exact test and the chi-square test to select the significant pathways. The significance threshold was defined by a P-value < 0.05 and FDR < 0.05 (Kanehisa et al., 2004; Yi et al., 2006; Draghici et al., 2007).
Interaction analysis between gene functions
GO-map (interaction map of GO terms for gene function) was employed to summarize functional interactions of differentially expressed genes. To directly and systemically identify interactions among the significant GOs based on GO interactions in Gene Ontology, a GO-map was built in the form of an interaction net of significant GOs for the differentially expressed miRNAs (Ashburner et al., 2000; Schlitt et al., 2003).
Path-Net
Path-Net mainly visualizes the interaction network of significant pathways for genes targeted by differentially expressed miRNAs. The Path-Net network was built from interactions among pathways in the KEGG database. It summarizes the pathway interactions of targeted genes of differentially expressed miRNAs and indicates the reason for activation of a certain pathway (Yi et al., 2006).
miRNA-Gene-Network
The miRNA-Gene-Network was built based on differential expression values that could help identify the relationship between miRNAs and genes established according to interactions of miRNAs and genes in the miRbase Database (http:// www.mirbase.org/). In the miRNA-Gene-Network graph, a circle represents a gene, and a square represents an individual miRNA; the relationship between them is represented by a line. The network center is represented by a degree. The degree quantifies the contribution of miRNA to its surrounding genes or contribution of a gene to its surrounding miRNAs. The key miRNAs and genes in the network always had the largest degree values (Enright et al., 2003; Joung et al., 2007; Shalgi et al., 2007).
miRNA-GO-Network
The miRNA-Go-Network was built from the relationships between significant GOs of miRNA-targeted genes. In this network graph, a circle represents a gene, and a square represents an individual miRNA; the relationship between them is represented by a line. The center of the network is represented by a degree. The degree quantifies the contribution of a miRNA to its surrounding GOs or the contribution of a GO to its surrounding miRNAs. The key miRNAs and network genes always show the largest degree values (Joung et al., 2007; Shalgi et al., 2007).
Results
Differentially expressed miRNAs in denervated soleus and tibialis anterior muscles
miRNA microarrays were used to identify miRNA expressions in denervated rat soleus and tibialis anterior muscles (Figure 1). We obtained a total of 389 miRNAs after removing noise from the miRNA profile. The microarray data showed that on days 7, 14, and 28 after surgery, there were 51, 54, and 57 differentially expressed miRNAs in the soleus muscle, respectively, compared with day 0 (RVM-F test, P < 0.05, FDR < 0.05, fold change > 2). Compared with the soleus muscle on day 0, 9.8% (n = 38) of the miRNAs were differentially expressed on days 7, 14, and 28, with 4 miRNAs (miR-17-1-3p, miR-152, miR-22, and miR-29a) significantly upregulated (P < 0.05) and 34 miRNAs significantly downregulated (P < 0.05). In the tibialis anterior muscle, compared with the day 0 condition, 29.3% (n = 93) of the miRNAs were differentially expressed on days 7, 14, and 28, with 29 significantly upregulated (P < 0.05) and 64 significantly downregulated (P < 0.05). From day 7 to day 28, 24 miRNAs were differentially expressed in both the soleus and tibialis anterior muscles, and 14 miRNAs were differentially expressed in the tibialis anterior muscle alone.
PCR and microarray showed same miRNA expression results
To confirm the reliability of the miRNA chip, we selected 5 miRNAs from the soleus muscle and 5 miRNAs from the tibialis anterior muscle from all 4 groups to test by quantitative PCR (q-PCR). Results showed no significant differences between q-PCR and gene-chip results in terms of expression tendency of the same miRNA (P > 0.05, Figure 2).
Differential expression profile of miRNAs between
denervated soleus and tibialis anterior muscles
Expression profiles showed different miRNA expressions in the denervated soleus and tibialis anterior muscles. STC was employed to compare miRNA expression profiles between denervated soleus and tibialis anterior muscles to identify miRNAs with the most obvious profile changes after denervation. Significance analysis showed expression profiles of miRNAs and single miRNAs included in each profile (Figure 3) (soleus muscle, P < 0.05; tibialis anterior muscle, P < 0.05).
There were three significant expression profiles and change trends in the soleus muscle (No. 1, No. 2, and No. 4), which were all consistently downregulated, suggesting similar functional and signal transduction levels for these 3 profiles. The miRNAs associated with profile No. 1 were miR-23a, miR-30a, and miR-678, those with No. 2 were miR-126, miR-133a, miR-133b, miR-145, and miR-30e, and those with No. 4 were miR-7c, miR-195, miR-206, and miR-378.
There were also three significant expression profiles and change trends (No. 0, No. 1, and No. 24) in the tibialis anterior muscle, with two (No. 1 and No. 24) showing both up- and downregulation, suggesting that miRNAs in these profiles might be related on a functional and signal transduction level. The miRNAs associated with the No. 0 profile were miR-30a, miR-30d, miR-133a, miR-133b, miR-434, and miR-382, those with No. 1 were miR-30c, miR-30a, miR-30b-5p, miR- 28, miR-28*, miR-378, miR-30c-2*, miR-126, miR-10a-5p, miR-30c-1*, miR-26a, miR-150, miR-329, miR-322, and miR-29c, and those with No. 24 were miR-7a, miR-7b, miR-7e, miR-152, miR-125b-5p, miR-214, miR-23a, miR-24, miR-320, and miR-672.
Prediction of target genes and related functions in denervated soleus and tibialis anterior muscle
To explore the regulatory functions of miRNAs, we employed TargetScan and Miranda to predict target genes for differentially expressed miRNAs in denervated soleus and tibialis anterior muscles. The target genes predicted by both systems were collected for post-target gene analysis. A total of 2,874 and 6,438 target genes were analyzed for the soleus and tibialis anterior muscles, respectively, in Figure 4. GO analysis was performed via Gene Ontology, and then a functional distribution map based on the degree of enrichment was created.
We found 3,167 functions that corresponded with target genes related to differentially expressed miRNAs in the soleus muscle, with 93 significant functions. In the tibialis anterior muscle, 2,501 functions were involved with target genes that corresponded with upregulated miRNAs, and 88 of these were significant. With respect to downregulated miRNAs, 3,467 functions were involved with related target genes, and 121 were significant, in Figure 4.
The relationship of gene functions associated with differentially expressed miRNAs in the denervated soleus and tibialis anterior muscles (GO-Map)
The functional relationship among target genes should be separated into different levels. However, the GO database only showed the relationship in vertical levels and not in horizontal levels. In Figure 5, we show the relationships among the gene functions in network form via the Gene Ontology database.
Signaling transduction pathways associated with target genes corresponding with differentially expressed miRNAs in the denervated soleus and tibialis anterior muscles
To identify the signal transduction pathways involved with the target genes, we employed Pathway Analysis using the KEGG and Biocarta databases. There were 124 signaling pathways involved with target genes in the soleus muscle, and 46 were significant. Figure 6A shows the distribution of the top 30 pathways based on the LgP value. There were 122 pathways involved with upregulated miRNAs in the tibialis anterior muscle, and 44 were significant. There were 127 pathways involved with downregulated miRNAs in the tibialis anterior muscle, and 51 were significant. Figure 6B shows the distribution of the top 30 pathways associated with upregulated miRNAs based on the LgP value, and Figure 6C shows the distribution of the top 30 pathways associated with downregulated miRNAs.
Key signaling transduction pathways involved with target genes corresponding with differentially expressed miRNAs in the denervated soleus and tibialis anterior muscles
A significant Path-Net map based on pathway significance analysis was performed. A systematic presentation of the sophisticated relationships among the significant pathways shows direct synergy between key pathways in the sample. When analyzing pathways via Path-Net, the standard is indicated by the degree value: a larger degree indicates greater pathway interaction. We predicted 36 pathways in the denervated soleus muscle, with the top 10 (based on the magnitude of the degree value) representing the MAPK signaling pathway, apoptosis, calcium signaling pathway, cell cycle, focal adhesion, Wnt signaling pathway, actin cytoskeleton regulation, adherens junction, cytokine-cytokine receptor interaction, and phosphatidylinositol signaling system (Figure 7A). In the denervated tibialis anterior muscle, we predicated 59 pathways, with the top 10 representing the MAPK signaling pathway, apoptosis, calcium signaling pathway, cell cycle, cytokine-cytokine receptor interaction, ubiquitin-mediated proteolysis, phosphatidylinositol signaling system, citrate cycle (TCA cycle), actin regulation, cytoskeleton, and p53 signaling pathway (Figure 7B).
Regulated networks of differentially expressed miRNAs and target genes in denervated soleus and tibialis anterior muscles
Generally, the greater number of target genes that are regulated by a single miRNA indicates greater importance of this miRNA in denervated muscle atrophy. Therefore, it is important to identify he miRNAs with the strongest regulatory potential and the related targets genes that are most frequently regulated. We used Functional and Pathway significanceanalysis to identify the significant target genes in the GO and Pathway databases. Then, we selected the genes contained in both databases and created a miRNA-Gene-Network based on the regulatory relationships between the miRNAs and their target genes (Figure 8).

Figure 3 Expression profiles of miRNAs in the denervated muscles.

Figure 4 Functional distribution map arranged by the top 30 enrichment values in the denervated soleus and tibialis anterior muscles.
Functional and Pathway Significance Analysis showed that 11 miRNAs were significantly involved with denervated soleus muscle atrophy, specifically miR-23a, miR-195, miR-30a*, miR-30e, miR-145, miR-206, let-7c, miR-133a, miR-133b, miR-378, and miR-678. There were 202 key target genes associated with these miRNAs, and the top 10 (based on the degree value) were Gja1, Pfn2, Ppm1d, Uba6, Unc5c, Actn4, Adrb2, Bdnf, Bet1, and Birc6. There were 30 miRNAs significantly involved with denervated tibialis anterior muscleatrophy, and the top 10 (based on the degree value) were miR-23a, miR-30d, miR-30a, miR-322, miR-30b-5p, miR-30c, miR-30a*, miR-26a, miR-329, and miR-320. Associated with these miRNAs were 343 key target genes, and the top 10 (based on the degree value) were Serpine1, Dll4, Pfn2, Unc5c, Adrb2, Birc6, Bmp5, Calm1, Col1a1, and Col5a2.

Figure 5 GO-Maps analyzed from denervated soleus muscle (A) and tibialis anterior muscle (B).
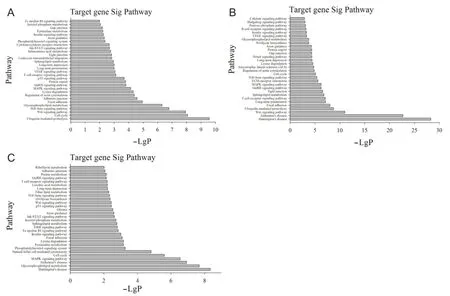
Figure 6 Pathways with the top 30 -LgP values.
Differentially expressed miRNAs and their regulatory networks in denervated soleus and tibialis anterior muscles
The Genome Database and Targeting Sequence Analysis Technique were employed to establish a miRNA-GO-Network to identify miRNAs with the strongest regulatory power and functions of the most frequently affected related target genes. The network directly indicates the regulatory relationships between miRNAs and gene functions. Additionally, it could identify key target genes regulated by multiple miRNAs by identifying multiple functions of miRNAs, as well as miRNAs with key regulatory functions through quantitative separation.
There were 11 key miRNAs involved with the denervated soleus muscle: miR-195, miR-23a, miR-30a*, miR-30e,miR-206, miR-145, let-7c, miR-378, miR-133a, miR-133b, and miR-678 (according to the degree value). These miRNAs regulated 88 key gene functions, including the following: apoptotic process, negative regulation of the apoptotic process, positive regulation of cell proliferation, signal transduction, angiogenesis, positive regulation of the I-kappaB kinase/NF-kappaB cascade, regulation of cell migration, response to hypoxia, organization of the actin cytoskeleton, negative regulation of cell proliferation, development of skeletal muscle tissue, and development of the nervous system (Figure 9A). In the denervated tibialis anterior muscle, there were 30 key miRNAs, and the top 10 (as indicated by the degree value) were miR-322, miR-30a*, miR-30d, miR-30b-5p, miR-30c, miR-30a, miR-23a, miR-329, miR-29c, and miR-30c-2*. There were 59 gene functions associated with these miRNAs, and the top 10 (as indicated by the degree value) were negative regulation of the apoptotic process, positive regulation of cell proliferation, angiogenesis, positive regulation of cell migration, protein auto-phosphorylation, response to hypoxia, the apoptotic process, positive regulation of the apoptotic process, induction of apoptosis, and the intracellular protein kinase cascade (Figure 9B).
Discussion
Denervated skeletal muscle recovers contractile function very poorly, even if the peripheral nerve is able to regenerate (Salonen et al., 1985; Savolainen et al., 1988; Li et al., 2013). During the early stages of denervation, skeletal muscle exhibits significant and immediately atrophy (Jakubiec-Puka et al., 1999; Borisov et al., 2005; de Castro Rodrigues et al., 2006; Adhihetty et al., 2007). On an epigenetic level, miRNA expression provides a deeper understanding of the pathophysiology involved in atrophy of denervated skeletal muscle. Additionally, miRNAs could serve as potential therapeutic targets for preventing atrophy of denervated muscles.
Using gene chip technology, we analyzed miRNA expression profiles in denervated classic slow (soleus muscle) and fast (tibialis anterior muscles) muscles during the early stage (day 0, day 7, day 14, and day 28). Our results showed that in soleus and tibialis anterior muscles, miRNAs exhibited different expression profiles during the early denervation process. We also identified a specific time sequence for expression of each miRNA in the atrophy process of denervated skeletal muscle. In soleus and tibialis anterior muscles, miR-1 and miR-133a expression was downregulated following denervation. However, miR-206 was upregulated in the tibialis anterior muscle and downregulated in the soleus muscle. On day 28, the miR-206 expression profile was upregulated by 1.37-fold in the tibialis anterior muscle and downregulated by 0.7-fold in the soleus muscle (Figure 1A, B). These results suggest that miR-206 could be a key factor associated with varying denervated atrophy conditions of the tibialis anterior and soleus muscles. Moreover, miR-206, combined with other key miRNAs, could play an important role in the atrophy of denervated slow and fast muscles.
In rats, denervation could eventually cause a switch from slow muscle to fast muscle during atrophy, which could help the muscle adapt to the denervated environment (d’Albis et al., 1994; Gene Ontology, 2006). Similarly, spaceflight also causes muscle atrophy and a switch from slow to fast muscle type, and miR-206 expression significantly decreases under this condition (Allen et al., 2009). Analysis of the same expression profile with miR-206 in denervated soleus muscle (Figure 3) showed that miR-206 has target genes in common with miR-195 (Bdnf, Mylk, Vegfa, and Ywhag), miR-23a (Ntrk2) and miR-30e (Ywha2). These genes were mainly associated with regulation functions of cytoskeleton organization, angiogenesis, apoptosis, and negative regulation of cell proliferation. Relative signaling pathways were associated with these gene functions, such as the MAPK signaling pathway, apoptosis, calcium signaling pathway, Wnt signaling pathway, TGF-beta signaling pathway, Jak-STAT signaling pathway, p53 signaling pathway, Toll-like receptor signaling pathway, and insulin signaling pathway. Most of these functions and signaling pathways provide evidence of muscle pathophysiology in denervated slow muscle atrophy in a spaceflight-like slow-tofast pattern (Gruener et al., 1994; O’Keefe et al., 2004; Shenkman and Nemirovskaya, 2008; Chopard et al., 2009; Benavides Damm et al., 2013). Therefore, miR-206, miR-195, miR-23a, and miR-30e might be key factors in the switching process from slow to fast muscle in denervated slow muscles.
In the anterior tibialis muscle, miR-214, miR-221, and miR-222 were upregulated, which was similar to the miR-206 profile, although there was no significant change in the denervated soleus muscle (Figure 1). In a previous study with 10 primary muscle disorders, miR-214, miR-221, and miR-222 were shown to be consistently upregulated (Eisenberg et al., 2007). We assumed that denervated fast muscle atrophy might share characteristics with primary muscle disorders such as Duchenne muscular dystrophy, Miyoshi myopathy, and facioscapulohumeral muscular dystrophy. For example, the gastrocnemius, which is composed of fast muscle fibers, is the earliest muscle affected in Miyoshi myopathy (Park et al., 2012). Therefore, miRNAs could be key regulatory factors in the denervated atrophy process involved in fast muscle and primary muscle disorders.
miR-1 and miR-206 appeared to play opposing roles in muscle cell proliferation and differentiation (Chen et al., 2006). Our study showed a tendency towards decreased miR-1 and miR-206 expression in the denervation of slow muscles and decreased miR-1 expression in fast muscles. We also found increased miR-206 expression in fast muscles. We speculate that miR-206 expression levels in slow muscles might contribute to atrophy more rapidly and obviously in denervated slow muscle compared with fast muscle. miR-206 promotes muscle cell differentiation by indirectly down-regulating Id1-3, MyoR, and MyoD (Kim et al., 2006). The MyoD family members (MyoD, Myf5, myogenin, and MRF4) play a vital role in complex mechanisms of skeletal muscle cell differentiation (Alves-Costa et al., 2013). miR-206 also enhances MyoD activation by suppressing Pax7 expression (Paired box 7) (Dey et al., 2011). In skeletalmyogenesis, MyoD promotes expression of Mef2 isoforms and actives the p38 MAPK pathway (Keren et al., 2006; Aziz et al., 2010). miR-206 also has a wide range of targets, including inhibitors of myogenic differentiation, such as Pax3, Pax7, Utrophin, follistatin, histone deacetylase (HDAC4), and insulin-like growth factor (IGF)-1 (Goljanek-Whysall et al., 2012). miR-206 has been shown to promote satellite cell differentiation by regulating Pax7 and Pax3 (Chen et al., 2010), and MyoD directly activates miR-206 expression, but miR-206 expression inhibits the Utrn and Fstl1 genes in myoblasts(Rosenberg et al., 2006). The IGF1/PI3K/Akt/ mTOR pathway regulates atrogin-1 and MuRF1 expression via FoxO phosphorylation, which negatively regulates muscle mass (White et al., 2013). Our study showed that the IGF signal pathway plays a critical role in denervated muscle atrophy (Figure 7A, B). Therefore, in the next study, we intend to further explore the mechanisms of various types of atrophy caused by miR-206 in denervated slow and fast muscles.
miRNAs are differently regulated in the early stages of denervated slow and fast muscle atrophy. By comparing miRNA expression profiles, we found that some groups of miRNAs were differentially expressed in the early stage of denervation between the soleus and tibialis anterior muscles. Analysis of target genes and their corresponding functions and related signaling networks revealed miRNA regulation of different patterns of denervated slow and fast atrophy. The miR-206 profiles might be reveal other miRNAs involved in denervated slow and fast muscles. Moreover, further analysis of related miRNAs grouped with significantly differentially expressed miRNAs between slow and fast muscles could provide a better understanding of the epigenetic mechanisms in denervated skeletal muscle atrophy, thereby providing treatment targets for preserving original skeletal muscle functions.
Author contributions: GL and QSL researched the latest knowledge and publications in the field, and wrote the article. GL, QSL, BSL designed, supervised, and corrected the article. GL, QSL, WBL, JW, WKC, ZC, HYQ, YWJ, JHT and BSL performed the experiments. All authors approved the final version of this paper for publication.
Conflicts of interest: None declared.
Plagiarism check: This paper was screened twice using Cross-Check to verify originality before publication.
Peer review: This paper was double-blinded and stringently reviewed by international expert reviewers.
References
Adhihetty PJ, O’Leary MF, Chabi B, Wicks KL, Hood DA (2007) Effect of denervation on mitochondrially mediated apoptosis in skeletal muscle. J Appl Physiol (1985) 102:1143-1151.
Agbenyega ET, Wareham AC (1990) Effect of clenbuterol on normal and denervated muscle growth and contractility. Muscle Nerve 13:199-203.
Allen DL, Bandstra ER, Harrison BC, Thorng S, Stodieck LS, Kostenuik PJ, Morony S, Lacey DL, Hammond TG, Leinwand LL, Argraves WS, Bateman TA, Barth JL (2009) Effects of spaceflight on murine skeletal muscle gene expression. J Appl Physiol (1985) 106:582-595.
Alves-Costa FA, Barbosa CM, Aguiar RC, Mareco EA, Dal-Pai-Silva M (2013) Differential expression of myogenic regulatory factor genes in the skeletal muscles of tambaqui colossoma macropomum (Cuvier 1818) from amazonian black and clear water. Int J Genomics 2013:465727.
Ambros V (2004) The functions of animal microRNAs. Nature 431:350-355.
Ashburner M, Ball CA, Blake JA, Botstein D, Butler H, Cherry JM, Davis AP, Dolinski K, Dwight SS, Eppig JT, Harris MA, Hill DP, Issel-Tarver L, Kasarskis A, Lewis S, Matese JC, Richardson JE, Ringwald M, Rubin GM, Sherlock G (2000) Gene ontology: tool for the unification of biology. The Gene Ontology Consortium. Nat Genet 25:25-29.
Aziz A, Liu QC, Dilworth FJ (2010) Regulating a master regulator: establishing tissue-specific gene expression in skeletal muscle. Epigenetics 5:691-695.
Bartel DP (2004) MicroRNAs: genomics, biogenesis, mechanism, and function. Cell 116:281-297.
Benavides Damm T, Richard S, Tanner S, Wyss F, Egli M, Franco-Obregon A (2013) Calcium-dependent deceleration of the cell cycle in muscle cells by simulated microgravity. FASEB J 27:2045-2054.
Borisov AB, Dedkov EI, Carlson BM (2005) Differentiation of activated satellite cells in denervated muscle following single fusions in situ and in cell culture. Histochem Cell Biol 124:13-23.
Cea LA, Cisterna BA, Puebla C, Frank M, Figueroa XF, Cardozo C, Willecke K, Latorre R, Saez JC (2013) De novo expression of connexin hemichannels in denervated fast skeletal muscles leads to atrophy. Proc Natl Acad Sci U S A 110:16229-16234.
Chen JF, Tao Y, Li J, Deng Z, Yan Z, Xiao X, Wang DZ (2010) microRNA-1 and microRNA-206 regulate skeletal muscle satellite cell proliferation and differentiation by repressing Pax7. J Cell Biol 190:867-879.
Chen JF, Mandel EM, Thomson JM, Wu Q, Callis TE, Hammond SM, Conlon FL, Wang DZ (2006) The role of microRNA-1 and microRNA-133 in skeletal muscle proliferation and differentiation. Nat Genet 38:228-233.
Chopard A, Hillock S, Jasmin BJ (2009) Molecular events and signalling pathways involved in skeletal muscle disuse-induced atrophy and the impact of countermeasures. J Cell Mol Med 13:3032-3050.
Clarke R, Ressom HW, Wang A, Xuan J, Liu MC, Gehan EA, Wang Y (2008) The properties of high-dimensional data spaces: implications for exploring gene and protein expression data. Nat Rev Cancer 8:37-49.
d’Albis A, Goubel F, Couteaux R, Janmot C, Mira JC (1994) The effect of denervation on myosin isoform synthesis in rabbit slow-type and fasttype muscles during terminal differentiation. Denervation induces differentiation into slow-type muscles. Eur J Biochem 223:249-258.
de Castro Rodrigues A, Andreo JC, de Mattos Rodrigues SP (2006) Myonuclei and satellite cells in denervated rat muscles: an electron microscopy study. Microsurgery 26:396-398.
Dey BK, Gagan J, Dutta A (2011) miR-206 and -486 induce myoblast differentiation by downregulating Pax7. Mol Cell Biol 31:203-214.
Draghici S, Khatri P, Tarca AL, Amin K, Done A, Voichita C, Georgescu C, Romero R (2007) A systems biology approach for pathway level analysis. Genome Res 17:1537-1545.
Dupuy D, Bertin N, Hidalgo CA, Venkatesan K, Tu D, Lee D, Rosenberg J, Svrzikapa N, Blanc A, Carnec A, Carvunis AR, Pulak R, Shingles J, Reece-Hoyes J, Hunt-Newbury R, Viveiros R, Mohler WA, Tasan M, Roth FP, Le Peuch C, Hope IA, Johnsen R, Moerman DG, Barabasi AL, Baillie D, Vidal M (2007) Genome-scale analysis of in vivo spatiotemporal promoter activity in Caenorhabditis elegans. Nat Biotechnol 25:663-668.
Eisenberg I, Eran A, Nishino I, Moggio M, Lamperti C, Amato AA, Lidov HG, Kang PB, North KN, Mitrani-Rosenbaum S, Flanigan KM, Neely LA, Whitney D, Beggs AH, Kohane IS, Kunkel LM (2007) Distinctive patterns of microRNA expression in primary muscular disorders. Proc Natl Acad Sci U S A 104:17016-17021.
Enright AJ, John B, Gaul U, Tuschl T, Sander C, Marks DS (2003) MicroRNA targets in Drosophila. Genome Biol 5:R1.
Gene Ontology C (2006) The Gene Ontology (GO) project in 2006. Nucleic Acids Res 34:D322-326.
Goljanek-Whysall K, Sweetman D, Munsterberg AE (2012) microRNAs in skeletal muscle differentiation and disease. Clin Sci (Lond) 123:611-625.

Figure 7 Path-Net map for denervated tibialis anterior muscle and soleus muscle.

Figure 8 miRNA-Gene-Net diagram.
Gruener R, Roberts R, Reitstetter R (1994) Reduced receptor aggregation and altered cytoskeleton in cultured myocytes after space-flight. Biol Sci Space 8:79-93.
He L, Hannon GJ (2004) MicroRNAs: small RNAs with a big role in gene regulation. Nat Rev Genet 5:522-531.
Hsieh CH, Jeng SF, Wu CJ, Lu TH, Yang JC, Chen YC, Lin CJ, Rau CS (2011) Altered expression of the microRNAS and their potential target genes in the soleus muscle after peripheral denervation and reinnervation in rats. J Trauma 70:472-480.
Jakubiec-Puka A, Ciechomska I, Morga J, Matusiak A (1999) Contents of myosin heavy chains in denervated slow and fast rat leg muscles. Comp Biochem Physiol B Biochem Mol Biol 122:355-362.
Jeng SF, Rau CS, Liliang PC, Wu CJ, Lu TH, Chen YC, Lin CJ, Hsieh CH (2009) Profiling muscle-specific microRNA expression after peripheral denervation and reinnervation in a rat model. J Neurotrauma 26:2345-2353.
Joung JG, Hwang KB, Nam JW, Kim SJ, Zhang BT (2007) Discovery of microRNA-mRNA modules via population-based probabilistic learning. Bioinformatics 23:1141-1147.
Kanehisa M, Goto S, Kawashima S, Okuno Y, Hattori M (2004) The KEGG resource for deciphering the genome. Nucleic Acids Res 32:D277-280.
Keren A, Tamir Y, Bengal E (2006) The p38 MAPK signaling pathway: a major regulator of skeletal muscle development. Mol Cell Endocrinol 252:224-230.

Figure 9 miRNA-GO-Network.
Kim HK, Lee YS, Sivaprasad U, Malhotra A, Dutta A (2006) Muscle-specific microRNA miR-206 promotes muscle differentiation. J Cell Biol 174:677-687.
Lau C, Olstad OK, Holden M, Nygard S, Fure H, Lappegard KT, Brekke OL, Espevik T, Hovig E, Mollnes TE (2015) Gene expression profiling of Gram-negative bacteria-induced inflammation in human whole blood: The role of complement and CD14-mediated innate immune response. Genom Data 5:176-183.
Leung AK, Sharp PA (2007) microRNAs: a safeguard against turmoil? Cell 130:581-585.
Li QT, Zhang PX, Yin XF, Han N, Kou YH, Deng JX, Jiang BG (2013) Functional recovery of denervated skeletal muscle with sensory or mixed nerve protection: a pilot study. PLoS One 8:e79746.
McCarthy JJ, Esser KA, Andrade FH (2007) MicroRNA-206 is overexpressed in the diaphragm but not the hindlimb muscle of mdx mouse. Am J Physiol Cell Physiol 293:C451-457.
Midrio M (2006) The denervated muscle: facts and hypotheses. A historical review. Eur J Appl Physiol 98:1-21.
Miller LD, Long PM, Wong L, Mukherjee S, McShane LM, Liu ET (2002) Optimal gene expression analysis by microarrays. Cancer Cell 2:353-361.
Nakasa T, Ishikawa M, Shi M, Shibuya H, Adachi N, Ochi M (2010) Acceleration of muscle regeneration by local injection of muscle-specific microRNAs in rat skeletal muscle injury model. J Cell Mol Med 14:2495-2505.
O’Keefe MP, Perez FR, Sloniger JA, Tischler ME, Henriksen EJ (2004) Enhanced insulin action on glucose transport and insulin signaling in 7-day unweighted rat soleus muscle. J Appl Physiol (1985) 97:63-71.
Park YE, Kim HS, Lee CH, Nam TS, Choi YC, Kim DS (2012) Two common mutations (p.Gln832X and c.663+1G>C) account for about a third of the DYSF mutations in Korean patients with dysferlinopathy. Neuromuscul Disord 22:505-510.
Ramoni MF, Sebastiani P, Kohane IS (2002) Cluster analysis of gene expression dynamics. Proc Natl Acad Sci U S A 99:9121-9126.
Rosenberg MI, Georges SA, Asawachaicharn A, Analau E, Tapscott SJ (2006) MyoD inhibits Fstl1 and Utrn expression by inducing transcription of miR-206. J Cell Biol 175:77-85.
Salonen V, Lehto M, Kalimo M, Penttinen R, Aro H (1985) Changes in intramuscular collagen and fibronectin in denervation atrophy. Muscle Nerve 8:125-131.
Savolainen J, Myllyla V, Myllyla R, Vihko V, Vaananen K, Takala TE (1988) Effects of denervation and immobilization on collagen synthesis in rat skeletal muscle and tendon. Am J Physiol 254:R897-902.
Schlitt T, Palin K, Rung J, Dietmann S, Lappe M, Ukkonen E, Brazma A (2003) From gene networks to gene function. Genome Res 13:2568-2576.
Shalgi R, Lieber D, Oren M, Pilpel Y (2007) Global and local architecture of the mammalian microRNA-transcription factor regulatory network. PLoS Comput Biol 3:e131.
Shenkman BS, Nemirovskaya TL (2008) Calcium-dependent signaling mechanisms and soleus fiber remodeling under gravitational unloading. J Muscle Res Cell Motil 29:221-230.
Tajrishi MM, Shin J, Hetman M, Kumar A (2014) DNA methyltransferase 3a and mitogen-activated protein kinase signaling regulate the expression of fibroblast growth factor-inducible 14 (Fn14) during denervation-induced skeletal muscle atrophy. J Biol Chem 289:19985-19999.
White JP, Gao S, Puppa MJ, Sato S, Welle SL, Carson JA (2013) Testosterone regulation of Akt/mTORC1/FoxO3a signaling in skeletal muscle. Mol Cell Endocrinol 365:174-186.
Wright GW, Simon RM (2003) A random variance model for detection of differential gene expression in small microarray experiments. Bioinformatics 19:2448-2455.
Yang H, Crawford N, Lukes L, Finney R, Lancaster M, Hunter KW (2005) Metastasis predictive signature profiles pre-exist in normal tissues. Clin Exp Metastasis 22:593-603.
Yi M, Horton JD, Cohen JC, Hobbs HH, Stephens RM (2006) WholePathwayScope: a comprehensive pathway-based analysis tool for high-throughput data. BMC Bioinformatics 7:30.
Zeman RJ, Ludemann R, Etlinger JD (1987) Clenbuterol, a beta 2-agonist, retards atrophy in denervated muscles. Am J Physiol 252:E152-155.
Copyedited by Cooper C, Raye W, Li CH, Song LP, Zhao M
10.4103/1673-5374.189195
*Correspondence to:
杂志排行
中国神经再生研究(英文版)的其它文章
- Secondary parkinsonism induced by hydrocephalus after subarachnoid and intraventricular hemorrhage
- Prospects for bone marrow cell therapy in amyotrophic lateral sclerosis: how far are we from a clinical treatment?
- Uncoupling protein 2 in the glial response to stress: implications for neuroprotection
- Selective neuronal PTEN deletion: can we take the brakes off of growth without losing control?
- TRPV1 may increase the effectiveness of estrogen therapy on neuroprotection and neuroregeneration
- Tamoxifen: an FDA approved drug with neuroprotective effects for spinal cord injury recovery