Discrepancies in boreal summer monsoon rainfall between GPCP and CMAP products during 1979-2014
2016-11-23HAOYuQinZHUCongWenndLIUBoQi
HAO Yu-Qin, ZHU Cong-Wennd LIU Bo-Qi,b
aInstitute of Climate System, Chinese Academy of Meteorological Sciences, Beijing, China;bState Key Laboratory of Numerical Modeling for Atmospheric Sciences and Geophysical Fluid Dynamics (LASG), Institute of Atmospheric Physics, Chinese Academy of Sciences, Beijing, China
Discrepancies in boreal summer monsoon rainfall between GPCP and CMAP products during 1979-2014
HAO Yu-Qiana, ZHU Cong-Wenaand LIU Bo-Qia,b
aInstitute of Climate System, Chinese Academy of Meteorological Sciences, Beijing, China;bState Key Laboratory of Numerical Modeling for Atmospheric Sciences and Geophysical Fluid Dynamics (LASG), Institute of Atmospheric Physics, Chinese Academy of Sciences, Beijing, China
This study compares the boreal summer monsoon (BSM) precipitation between the GPCP and CMAP products during 1979—2014. The authors apply temporal, spatial correlation and error evaluation methods to evaluate their discrepancies in terms of BSM distribution and summer rainfall interannual variability over the fve BSM regions. The results suggest that the climatology of the seasonal evolution of BSM rainfall is refected well in both datasets, and the summer rainfall anomalies of the two products are highly correlated. However, major diversity is found in the rainfall pattern and the magnitude in climatology over the oceanic monsoon areas, especially the western North Pacifc monsoon region, as well as in the interannual variability of summer rainfall anomalies over the North Africa and India monsoon regions. Although inconsistency between the two datasets is evident before the 1990s, the use of their arithmetic mean is demonstrated to be an efcient way to reduce the uncertainty between them.
ARTICLE HISTORY
Revised 3 March 2016
Accepted 7 March 2016
GPCP; CMAP; boreal summer monsoon; interannual
variability; data evaluation
GPCP和CMAP资料均广泛应用于降水变率的研究中,然而两者在描述北半球季风区降水年际变率上的差异较少受到关注。本文研究了1979—2014年北半球5大季风区降水因资料选择造成的研究结果差异。研究发现:在气候态上,西北太平洋季风区夏季降水的空间分布型和降水量差异较大;在年际变率上,北非季风区和印度季风区夏季降水存在较大差异。两者的差异在90年代后明显减小。一般来说,两者的算数平均可以减少资料不确定性带来的影响。
1. Introduction
Several gauge—satellite merged precipitation products have been developed since the 1970s and used for estimating precipitation amounts (Yin, Gruber, and Arkin 2004). Among these products, the GPCP and CMAP products have been particularly widely utilized, due to their global coverage and long-term records. For instance, the global monsoon, characterized by the annual variation in rainfall, has been recognized in detail, while the regional monsoons are treated as its components with intense precipitation. Since the interannual variability of summer rainfall varies across the diferent monsoon regions (Wang et al. 2012), its quantifcation and understanding within the context of the global monsoon is crucial.
The GPCP and CMAP datasets are widely utilized to examine precipitation variation on diferent timescales,but whether to use either GPCP or CMAP to investigate summer monsoon rainfall is arbitrary. For example, Lin,Zhou, and Qian (2014) used the GPCP product as the observation to evaluate reanalysis data when studying global monsoon precipitation changes, and Zhang and Cook (2014) used GPCP together with validation from TRMM to study the West African monsoon. Besides, Zhu et al. (2005) used the CMAP data-set to develop an East Asian monsoon index to represent the seasonal and interannual variations of the East Asian (EA) monsoon, and Janicot(2009) also used the CMAP product to compare the variability of the Indian (IND) and African monsoons at diferent time scales. Some studies have used the arithmetic mean to replace the original data-set, but the advantages have not been fully discussed. For instance, Hsu, Li, and Wang(2011) used both GPCP and CMAP to study global monsoon trends, and Prakash et al. (2015) used both GPCP and CMAP to study the Indian monsoon. Indeed, specifc analysis procedures and certain additional types of input data may produce distinct results between the two datasets(Gruber et al. 2000; Yin, Gruber, and Arkin 2004), leading to diferent variabilities of summer monsoon rainfall at both seasonal and interannual timescales. Recent studies havepointed out the diferent features of monsoon rainfall over land and its surrounding area as depicted by the GPCP and CMAP products (Prakash et al. 2015; Qi and Wang 2015). Meanwhile, the discrepancies over the BSM regions as a whole remain unclear, especially over the oceans where gauge observations are lacking.
The GPCP and CMAP products have some satellite input data in common, such as SSM/I emissions estimates, SSM/I scattering estimates, and GOES precipitation index and outgoing long-wave radiation (OLR) precipitation index estimates (Hufman et al. 1997; Adler et al. 2003). However,the two products difer in terms of: (1) some of their gauge data, such as the uncorrected gauges used by CMAP in the tropical Pacifc (Gruber et al. 2000), which may result in the diferent magnitudes of precipitation over land areas and the tropical oceans in the climatology (Yin, Gruber,and Arkin 2004); and (2) their merging procedures (Xie and Arkin 1997; Gruber et al. 2000), which implies a distinction in the intensity of BSM rainfall between the two datasets.
In the present study, we examine the recent releases of the GPCP and CMAP products during the period 1979—2014, and evaluate the quality of the data in indicating the climatological pattern and the interannual variability over the BSM regions. We apply the TRMM satellite product and global gauge observations to evaluate the similarities and discrepancies in BSM precipitation between the two datasets. The focus is on the climatology and interannual timescale over the BSM regions, and the aim is to try to provide an efective method for decreasing the uncertainty when studying the variation of boreal monsoon precipitation during a period demonstrating high levels of inconsistency.
2. Data and methods
The datasets used include the monthly GPCP (Hufman et al. 1997, 2009; Adler et al. 2003) and monthly CMAP (Xie and Arkin 1997) from 1979 to 2014, with a spatial resolution of 2.5° × 2.5°. In addition, the satellite-observed precipitation of TRMM 3B43 Version 7 during 1998—2014 is used to inspect the performance of the two datasets, in conjunction with the global gauge observations from the Global Historical Climatology Network (GHCN) Version 1.0 during 1979—1997. The TRMM product (Hufman et al. 2010), provided by the Distributed Active Archive Center, GSFC, NASA, is available via http://trmm/gsfc.nasa.gov/. The GHCN records (Vose et al. 1992) include 31,446 global stations, subjected to precise data integration and multiple statistical tests.
The focus in this work is on the area-averaged summer monsoon rainfall anomalies during 1979—2014 over the fve monsoon regions of the Northern Hemisphere,including the tropical monsoon over North America(NAM), North Africa (NAF), India (IND), and the western North Pacifc (WNP), and the subtropical summer monsoon over EA (Wang et al. 2012). The interannual variability of each element is obtained after removing the linear trend and the 11-yr running mean from its original value. The absolute diference and relative diference are calculated to reveal the discrepancies between GPCP and CMAP. In addition, temporal and spatial correlations are employed to evaluate the similarity in the rainfall anomalies between the two products over the monsoon regions, with the spatial correlation measured using the anomaly correlation coefcient (ACC) (Murphy and Epstein 1989). In addition,the frequency of discrepancy (defned as the ratio of the concurrent negative phases of rainfall anomalies between GPCP and CMAP in a 36-yr record), the RMSE (Levinson 1947) and the Taylor diagram (Taylor 2001) are used to quantitatively evaluate the interannual inconsistency between the two datasets. Meanwhile, the ability of the arithmetic mean in reducing the uncertainty in rainfall variability over the BSM regions is discussed.
3. Results
3.1. Climatological pattern
We begin by investigating the climatological pattern of the BSM based on the two diferent datasets. Following the defnition of Wang et al. (2012), the monsoon domain is defned here as where the local summer-minus-winter precipitation rate exceeds 2.5 mm d-1and the local summer precipitation exceeds 55% of the annual total. Considering the distinct characteristics of monsoon rainfall and circulation between the eastern Tibetan Plateau (TP) and India(Chu et al. 2011), we exclude the TP area (i.e. topography above 1500 m) from the IND monsoon region defned by Wang et al. (2012), as shown in Figure 1.
It is apparent that the BSM domains are generally refected in both the GPCP and CMAP products (Figure 1). Nonetheless, there are diferences in the domains, mostly in the WNP and EA monsoon regions. Specifcally, the CMAP WNP monsoon region is larger and extends eastward to 165°E (Figure 1(b)), while the GPCP EA monsoon region is larger and with its northern boundary near 56°N (Figure 1(a)). Thus, we select common domains for the subsequent data evaluation; the domain details are presented in Table 1.
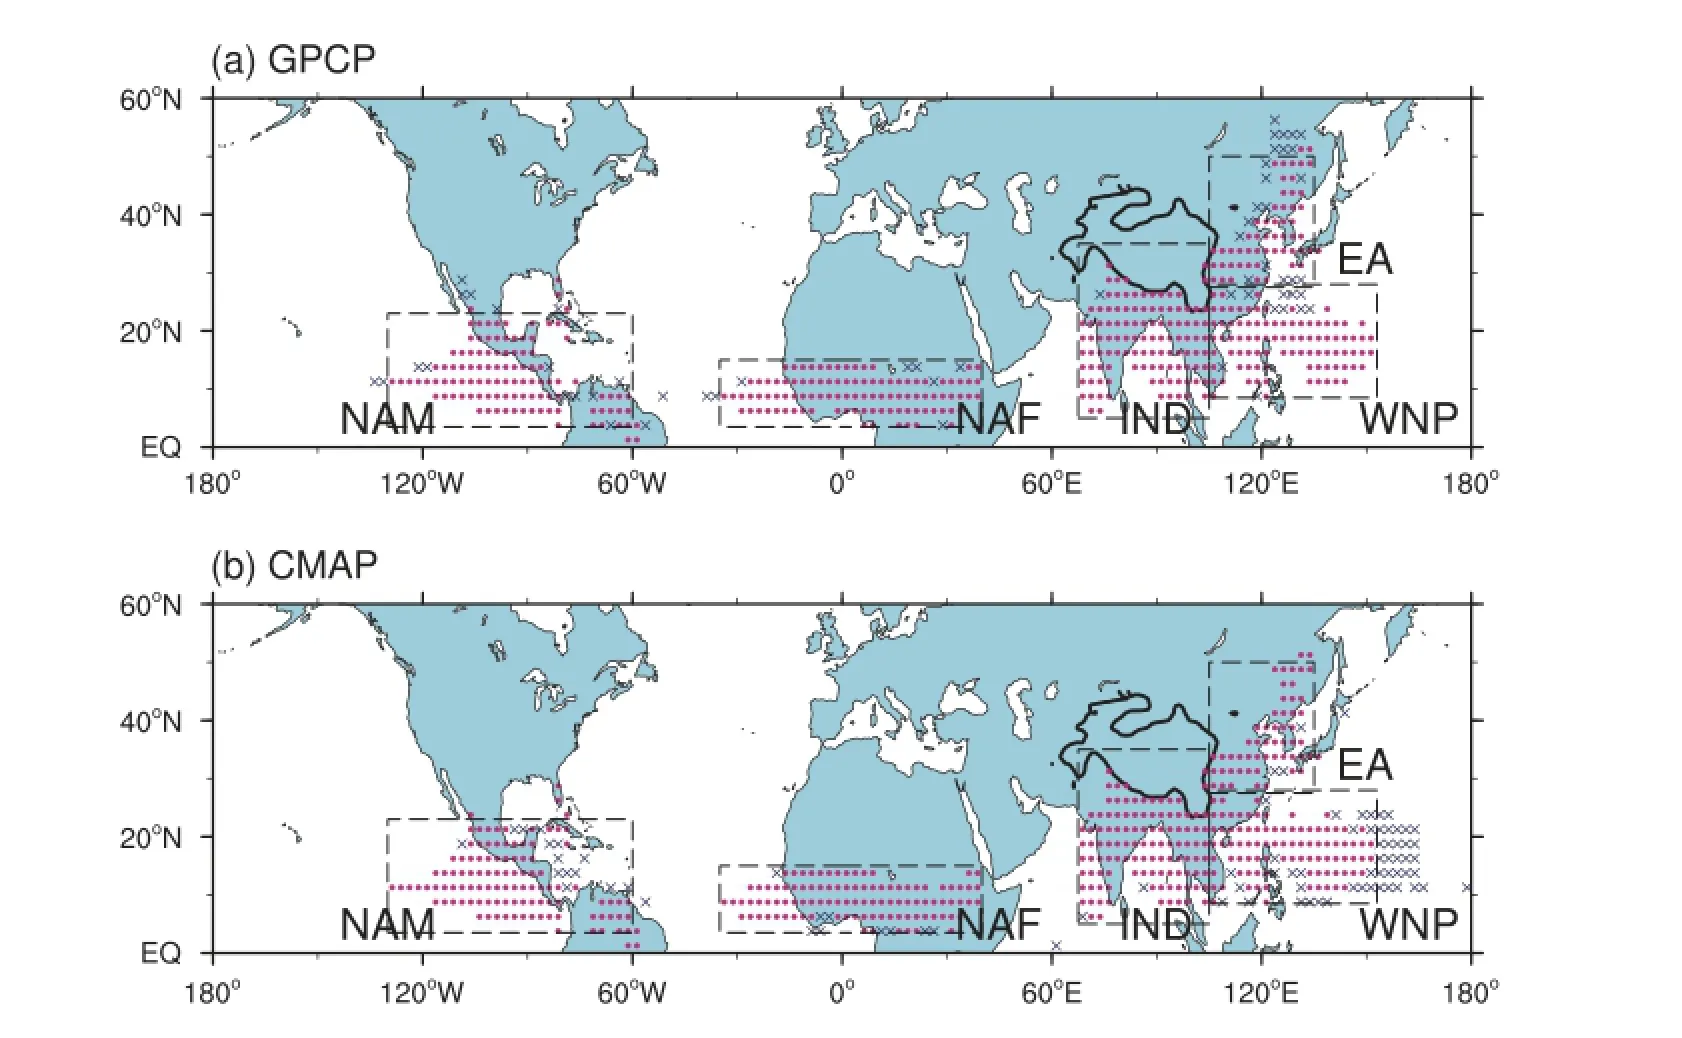
Figure 1.The boreal monsoon regions based on (a) GPCP and (b) CMAP. Red (blue) marks indicate common (distinct) regions between GPCP and CMAP.

Table 1.Domains of the fve boreal summer monsoon regions,and the temporal correlation coefcient (CC) for the interannual rainfall variability between the GPCP and CMAP products over the specifc monsoon regions.
Figure 2 shows the seasonal evolution of precipitation over the fve boreal monsoon regions in the climatology (Figures 2(a) and (b)), as well as the absolute diference (Figure 2(c)) and relative diference (Figure 2(d)) of June—July—August (JJA) precipitation. Generally, the two products depict a similar seasonal cycle and precipitation intensity from May to October over the BSM regions(Figures 2(a) and (b)), except for the maximum absolute inconsistencies in summer precipitation in terms of the climatological pattern appear over the oceanic WNP and a fragmentary part of the NAM and IND monsoon regions. diference (>1.5 mm d-1) over the WNP monsoon region from July to September (Figure 2(c)). Figure 2(d) indicates largely positive relative diferences (>30%) in JJA precipitation between GPCP and CMAP, located in the southern WNP and a fragmentary part of the NAM and IND monsoon regions. Therefore, the pattern and magnitude of regional monsoon rainfall in the GPCP and CMAP datasets is similar across the BSM regions, except for distinct inconsistencies found mostly over the WNP oceanic monsoon areas, which can be partly attributed to the controversial input of atoll gauges over the tropical Pacifc in CMAP, according to Yin,Gruber, and Arkin (2004). Indeed, changes to input data(e.g. atoll gauges in CMAP in January 1996) have implications in the behavior of the two datasets. The atoll data have been improperly used by CMAP for constructing the oceanic precipitation. This input data change and atoll gauges sampling problem can explain the fact that the two products have much less in common over the ocean than over land (Yin, Gruber, and Arkin 2004). Thus, distinct
3.2. Interannual variability
Table 1 lists the temporal correlation coefcients (CCs)of interannual rainfall variability over the fve monsoon regions, based on the two datasets. The results suggest that the interannual variability over the monsoon regions is very similar in GPCP and CMAP, except for the NAM and IND monsoon regions. Figure 3 shows the ACC evolution of BSM rainfall between GPCP and CMAP during 1979—2014. It can be seen that the ACC over the fve monsoon regions primarily increases with time, presenting a rising trend in ACCs over each monsoon region from 1979 to 2014. This is probably due to the development of microwave estimates from SSM/I and the improvement in merging methods of each data type providing more accurate instantaneous rainfall estimates, especially over the oceans where there is a lack of gauge observations (Gruber et al. 2000). Specifcally, the ACC between the two products is largest over the WNP and EA monsoon regions (Figures 3(d) and (e)), but lowest over the NAF and IND monsoon regions (Figures 3(b) and (c)). For instance, the ACC over the NAF and IND monsoon regions decreases abruptly in the 1980s, but increases in the early 2010s (Figures 3(b)and (c)). Therefore, even in recent decades, the ACC over the NAF and IND monsoon regions shows evident oscillation, which implies considerable discrepancies in monsoonrainfall variability over the two regions between the GPCP and CMAP datasets (Figure 1).
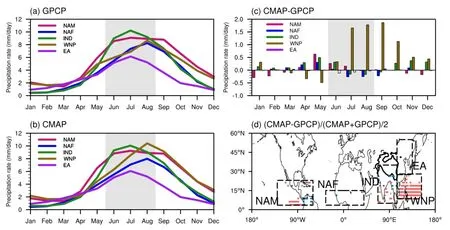
Figure 2.Climatological (1979—2014) evolution of precipitation in (a) GPCP and (b) CMAP (units: mm d-1) over the fve monsoon regions.(c) Absolute diference in the averaged seasonal cycle between the two products (CMAP minus GPCP; units: mm d-1). (d) Relative diference of the averaged summer precipitation between the two products (0.5 × (CMAP-GPCP) × (CMAP + GPCP)-1; red: >30%; blue:<-30%).
To further quantify the interannual inconsistency between the two datasets, we investigated the spatial distribution of negative frequency and the RMSE between the two datasets (fgure not shown). It was found that the discrepancy percentage of interannual variability between the two products was greater than 25% over the NAM,NAF, and IND regions, as well as their surrounding marine areas. Note that the largest frequency and RMSE were observed over low-latitude North Africa and India, and the largest disagreement appeared over the NAF and IND monsoon regions, where the magnitude of RMSE reached 5.0 mm d-1. Therefore, discrepancy in the interannual variability between the two datasets is mainly observed over the NAF and IND monsoon regions, characterized by smaller and unstable ACCs, while they agree with each other very well over the WNP and EA monsoon regions.
3.3. Validation by satellite and in situ observations The TRMM product and global land in situ observations are treated as benchmarks to evaluate the accuracy of the GPCP and CMAP products. Due to the availability of the TRMM product and the increasing linear trend of GPCP/ CMAP spatial correlation (the cross point are approximately at 1997/98), the evaluation is divided into two periods: 1979—97 and 1998—2014. Figures 4(a) and (b) are Taylor diagrams of the GPCP and CMAP products for the two periods. It can be seen that the CMAP patterns generally agree well with those of the GPCP over the fve monsoon regions during the period 1998—2014. However, the consistency between the two datasets is relatively lower over the BSM regions during the period 1979—1997, especially over the NAM and IND monsoon regions (Figure 4(a)), as compared to the period 1998—2014 (Figure 4(b)). The consistency is better over the WNP and EA monsoon regions in the more recent period, but the disagreement is still robust over the NAF monsoon region, even in the latter two decades.
Since the GHCN gauge observations and the TRMM products are highly consistent in terms of common regions and episodes (fgure not shown), they can act as reliable criteria for optimal selection with respect to the two datasets, especially over the high-discrepancy regions and episodes. Figure 4(c) compares the arithmetic mean of land GPCP and CMAP records and GHCN gauge observations during 1979—1997. The CC between the arithmetic mean and the GHCN product is somewhat improved over the BSM regions, except for the WNP area. Whereas, the changes in the standard deviation (STD) of the arithmetic mean are more complicated. Specifcally, the arithmetic mean becomes slightly worse than the GPCP over the NAM region and CMAP over the NAF region, respectively. However, it improves over the IND region where there is considerable GPCP/CMAP inconsistency. Over the WNP region, the arithmetic mean is better than CMAP but worsethan GPCP. Furthermore, the improvement in the STD over the EA region is insignifcant (Figure 4(c)). It is important to note that the quality of the GHCN product, used as reference, will be sensitive to the comparison in the period 1979—1997. Thus, the arithmetic mean has better skill over the IND region, and shows worse skill than GPCP but better skill than CMAP over the NAM, NAF, and WNP regions. Over the EA region, the arithmetic mean shows exactly the same skill as GPCP. Generally, using the arithmetic mean of the GPCP and CMAP records is able to reduce the uncertainty of their individual use over the BSM regions.
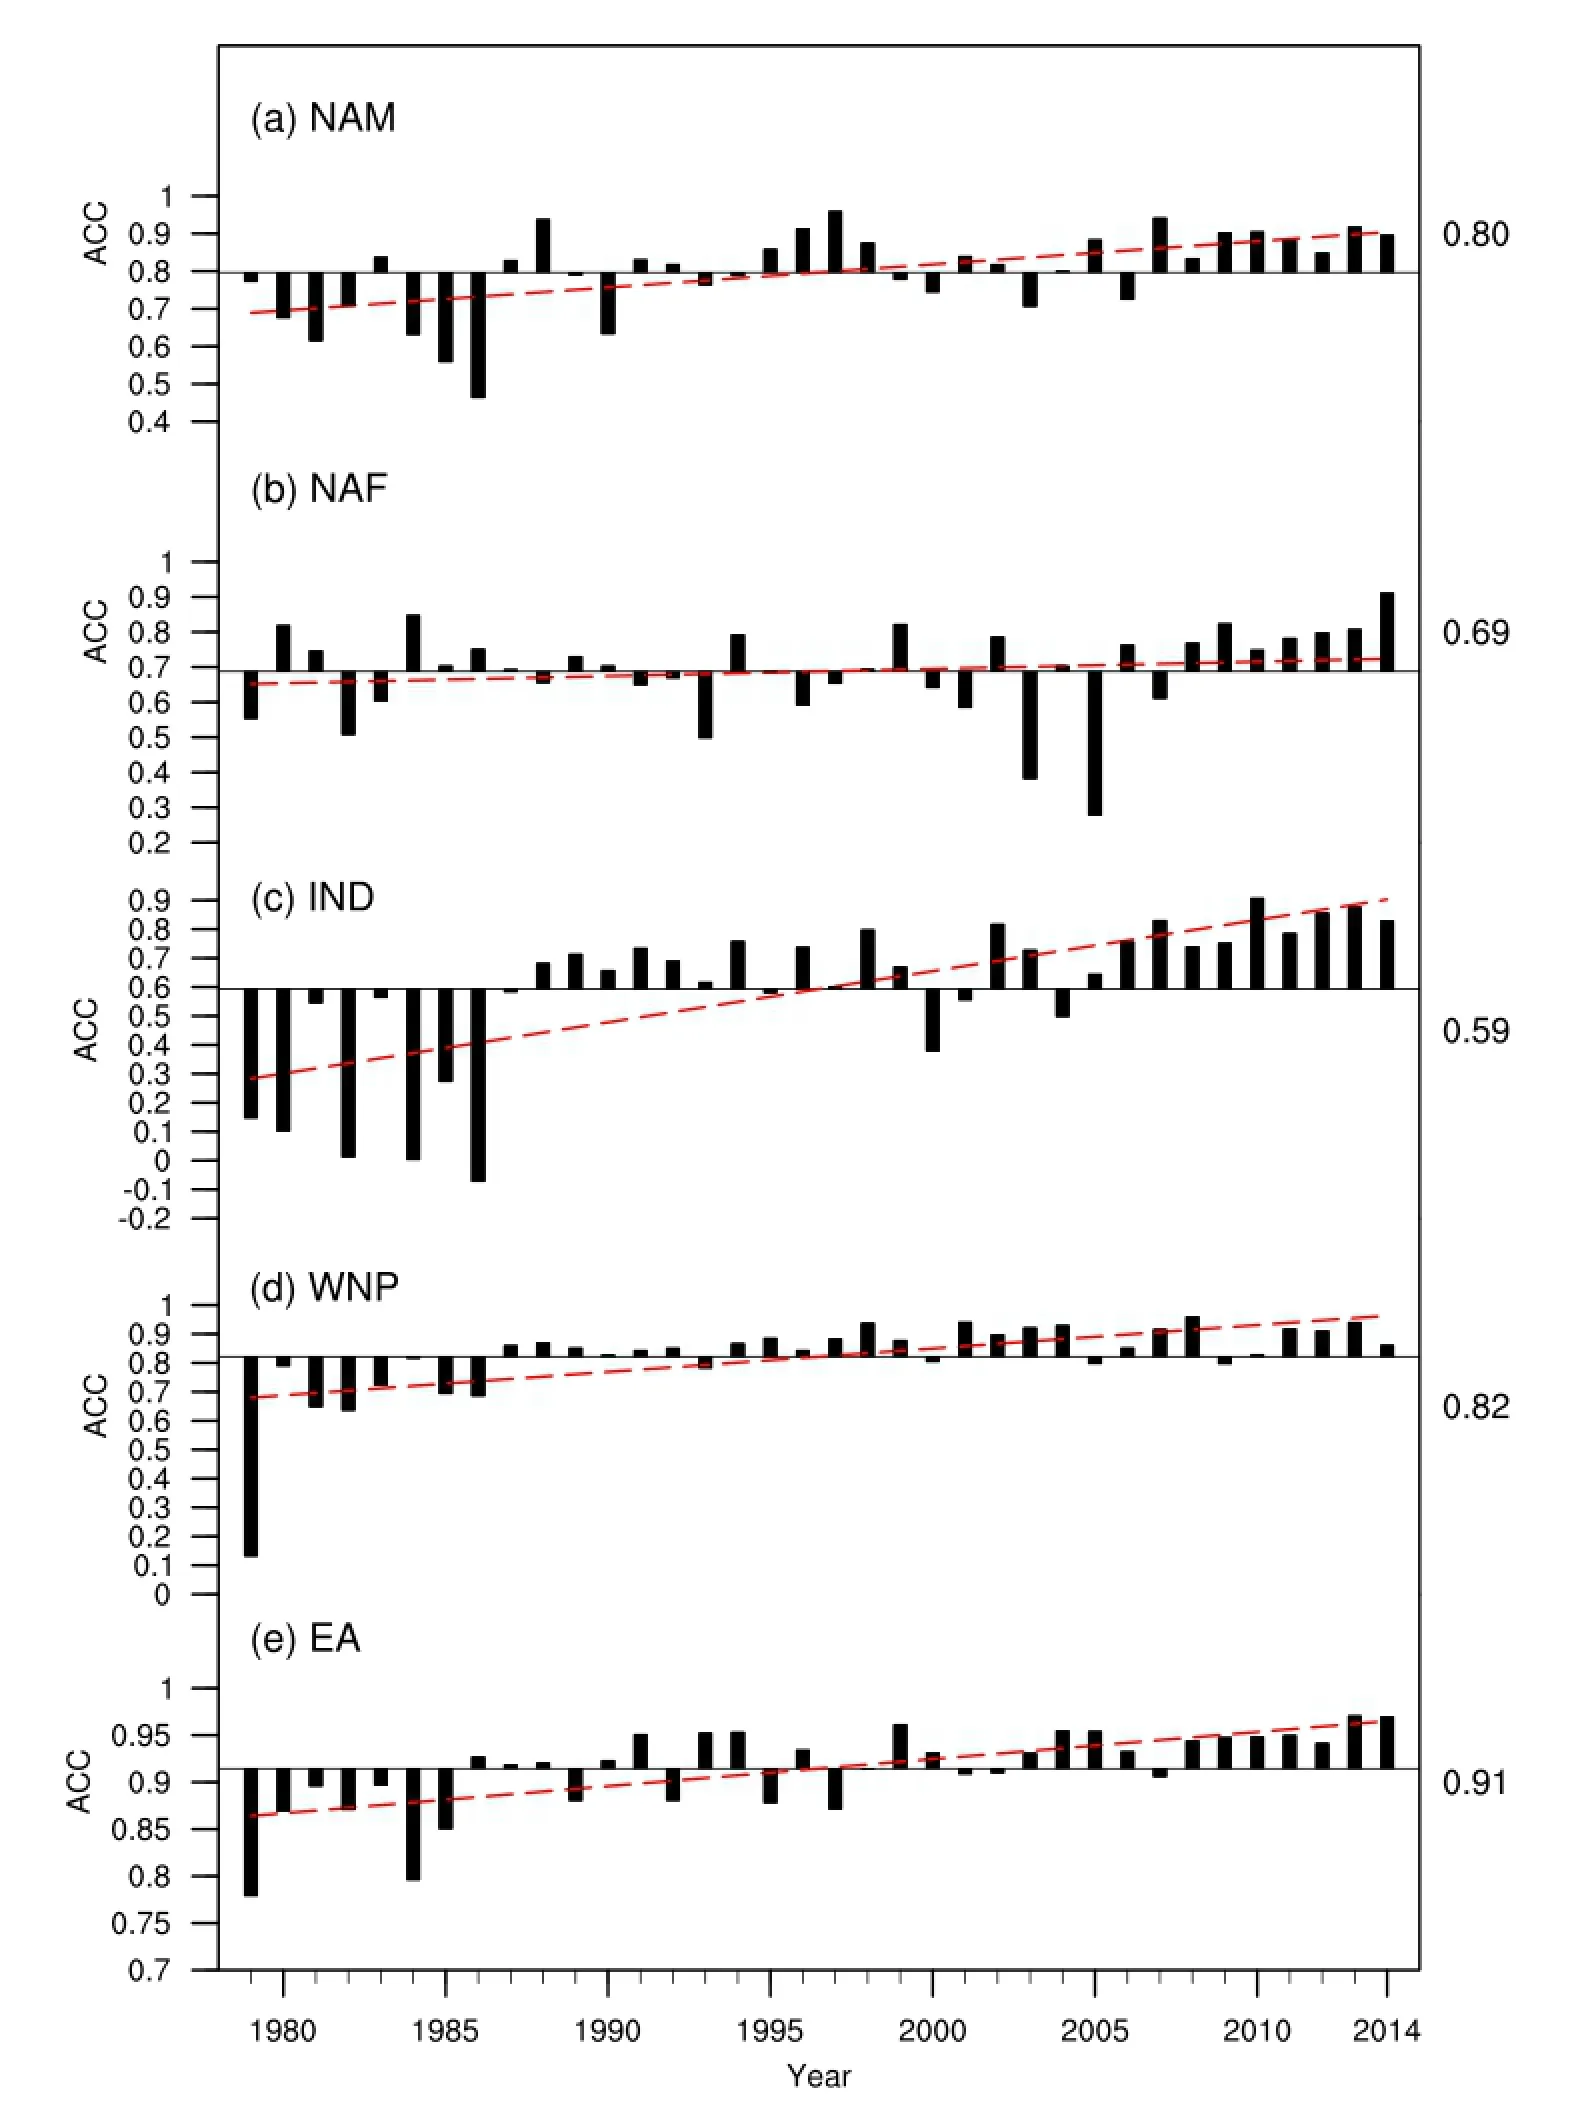
Figure 3.Evolution of the anomaly correlation coefcient (ACC) between the GPCP and CMAP summer precipitation over the fve boreal monsoon regions during 1979—2014.
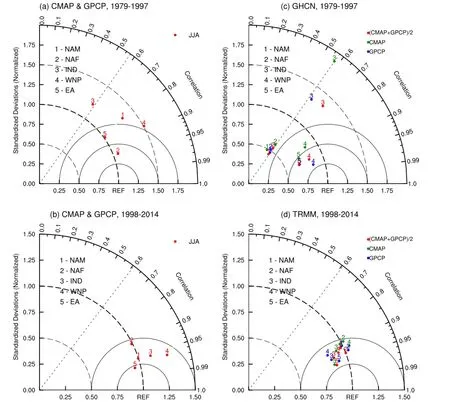
Figure 4.Taylor diagram of the GPCP, CMAP, TRMM, and GHCN summer precipitation on the interannual timescale. Panels (a) and (b) are Taylor diagrams of the GPCP and CMAP products during 1979—1997 and 1998—2014, respectively. The GPCP is set as ‘Reference’ (REF). The GHCN gauge observations and TRMM products are used to validate the two datasets. Panels (c) and (d) are Taylor diagrams of the GHCN gauge observations and TRMM products with the GPCP and CMAP and their arithmetic mean values of 1979—1997 and 1998—2014,respectively.
It can also be seen that the GPCP and CMAP products correspond well to the TRMM product over all BSM regions during 1998—2014 (Figure 4(d)). The interannual variability derived from the arithmetic mean of GPCP and CMAP exhibits remarkable positive correlation with the TRMM product over all the monsoon regions. Specifcally,over the NAF region where there is considerable GPCP/ CMAP inconsistency, the arithmetic mean shows better skill than either GPCP or CMAP, presenting an increased CC and decreased STD diference with the TRMM product. Improvement can also be found over the NAM, WNP,and EA monsoon regions. Compared with the TRMM product, the arithmetic mean over the IND region shows a higher CC than the CMAP data-set, but a larger STD diference than the GPCP record. Although it remains hard to identify an optimal precipitation data-set for the BSM, the use of the arithmetic mean of the GPCP and CMAP products nevertheless provides an efective way to reduce the level of uncertainty when studying BSM rainfall variation.
4. Concluding remarks
GPCP and CMAP have been popularly used in climate monitoring and research due to their global coverage and long-term records. The present paper evaluates the climatology and interannual variability of boreal monsoon precipitation in these two datasets during 1979—2014. The results suggest that the climatology of the seasonalcycle of BSM rainfall can be refected by both datasets,but their absolute diference is still robust, with a maximum over the WNP monsoon region during July—October. Discrepancies in the summer rainfall pattern and magnitude are found over the oceanic WNP and a fragmentary part of the oceanic NAM and IND monsoon regions. On the interannual timescale, the rainfall anomaly is mostly correlated between the two products. A number of signifcant diferences are, however, still observed over the NAF and IND monsoon regions, as revealed by smaller and more unstable ACCs, higher frequency of discrepancy, and greater RMSE. It is noted that consistency between the two datasets has greatly increased in recent decades. The use of the arithmetic mean of the GPCP and CMAP products is evaluated by comparing with TRMM and global in situ observations, demonstrating it to be an efcient method for reducing the uncertainties in rainfall anomalies over the BSM regions. It is hoped that the present evaluation will provide useful information for future BSM climate research.
Acknowledgements
We thank the anonymous reviewers for their innovative suggestions. The GPCP and CMAP datasets were downloaded from http://www.ncdc.noaa.gov/oa/wmo/wdcamet-ncdc.html and ftp://ftpprd.ncep.noaa.gov/pub/precip/cmap, respectively.
Disclosure statement
No potential confict of interest was reported by the authors.
Funding
This study was jointly supported by the National Natural Science Foundation of China [grant number 41475057], [grant number 41221064], [grant number 91437218], [grant number 41505049]; the Key Program of Chinese Academy of Meteorological Sciences [grant number 2015Z001].
Notes on contributors
HAO Yu-Qian is graduate student at Institute of Climate System,Chinese Academy of Meteorological Sciences. Her main research interests focus on the climate change of East Asian monsoon.
ZHU Cong-Wen is Senior Researcher at Institute of Climate System, Chinese Academy of Meteorological Sciences. His main research interests focus on the East Asian monsoon and seasonal climate prediction. Recent publication includes papers in Int. J. Climatol., Chinese journal of Atmosphere Sciences, Adv. Atmos. Sci., Geophys. Res. Lett., and other journals.
LIU Bo-Qi is associated researcher at Institute of Climate System,Chinese Academy of Meteorological Sciences, and Atmospheric Sciences and Geophysical Fluid Dynamics (LASG), Institute of Atmospheric Physics. His main research interests focus on monsoon dynamics and air-sea interaction. Recent publications include papers in Journal of Climate, Climate Dynamics, Adv. Atmos. Sci, and Chin Sci Bull, and other journals.
References
Adler, R. F., G. J. Huffman, A. Chang, R. Ferraro, P. P. Xie, J. Janowiak,and B. Rudolf. 2003. “The Version-2 Global Precipitation Climatology Project (GPCP) Monthly Precipitation Analysis (1979—Present).” Journal of Hydrometeorology 4 (6): 1147—1167.
Chu, D., T. Pubu, G. Norbu, B. Sagar, S. Mandira, and J. P. Guo. 2011. “Validation of the Satellite-Derived Rainfall Estimates over the Tibet.” Acta Meteorologica Sinica 25 (6): 734—741.
Gruber, A., X. Su, M. Kanamitsu, and J. Schemm. 2000.“The Comparison of Two Merged Rain Gauge—Satellite Precipitation Datasets.” Bulletin of the American Meteorological Society 81: 2631—2644.
Hsu, P. C., T. Li, and B. Wang. 2011. “Trends in Global Monsoon Area and Precipitation over the past 30 Years.”Geophysical Research Letters 38: L08701. doi:http://dx.doi. org/10.1029/2011GL046893.
Hufman, G. J., R. F. Adler, P. Arkin, A. Chang, R. Ferraro, A. Gruber,J. Janowiak, A. McNab, B. Rudolf, and U. Schnelder. 1997. “The Global Precipitation Climatology Project (GPCP) Combined Precipitation Dataset.” Bulletin of the American Meteorological Society 78: 5—20.
Hufman, G. J., R. F. Adler, D. T. Bolvin, and G. J. Gu. 2009.“Improving the Global Precipitation Record: GPCP Version 2.1.” Geophysical Research Letters 36: L17808. doi:http:// dx.doi.org/10.1029/2009GL040000.
Hufman, G. J., R. F. Adler, D. T. Bolvin, and E. J. Nelkin. 2010.“Chapter 1 in Satellite Rainfall Applications for Surface Hydrology.” In The TRMM Multi-Satellite Precipitation Analysis(TMPA), edited by G. Mekonnen and H. Faisal, 3—22. Berlin: Springer Verlag.
Janicot, S. 2009. “A Comparison of Indian and African Monsoon Variability at Diferent Time Scales.” Comptes Rendus Geoscience 341: 575—590.
Levinson, N. 1947. “The Wiener RMS (Root Mean Square)Error Criterion in Filter Design and Prediction.” Journal of Mathematical Physics 25: 261—278.
Lin, R. P., T. J. Zhou, and Y. Qian. 2014. “Evaluation of Global Monsoon Precipitation Changes Based on Five Reanalysis Datasets.” Journal of Climate 27: 1271—1289.
Murphy, A. H., and E. S. Epstein. 1989. “Skill Scores and Correlation Coefcients in Model Verifcation.” Monthly Weather Review 117: 572—582.
Prakash, S., A. K. Mitra, I. M. Momin, E. N. Rajagopal, S. Basu, M. Collins, A. G. Turner, K. A. Rao, and K. Ashok. 2015. “Seasonal Intercomparison of Observational Rainfall Datasets over India during the Southwest Monsoon Season.” International Journal of Climatology 35: 2326—2338.
Qi, L., and Y. Q. Wang. 2015. “Discrepancies in Diferent Precipitation Data Products in the Bay of Bengal during Summer Monsoon Season.” Advances in Meteorology 2015: 1—13. doi: http://dx.doi.org/10.1155/2015/806845.
Taylor, K. E. 2001. “Summarizing Multiple Aspects of Model Performance in a Single Diagram.” Journal of Geophysical Research: Atmospheres 106: 7183—7192.
Vose, R. S., R. L. Schmoyer, T. C. Peterson, P. M. Steurer, R. R. Jr. Heim, T. R. Karl, and J. K. Eischeid. 1992. The Global HistoricalClimatology Network: Long-Term Monthly Temperature,Precipitation, Sea Level Pressure, and Station Pressure Data,189. Oak Ridge, Tennessee: Oak Ridge National Laboratory.
Wang, B., J. Liu, H. J. Kim, P. J. Webster, and S. Y. Yim. 2012. “Recent Change of the Global Monsoon Precipitation (1979—2008).”Climate Dynamics 39: 1123—1135.
Xie, P. P., and P. A. Arkin. 1997. “Global Precipitation: A 17-Year Monthly Analysis Based on Gauge Observations, Satellite Estimates, and Numerical Model Outputs.” Bulletin of the American Meteorological Society 78: 2539—2558.
Yin, X., A. Gruber, and P. Arkin. 2004. “Comparison of the GPCP and CMAP Merged Gauge—Satellite Monthly Precipitation Products for the Period 1979—2001.” Journal of Hydrometeorology 5: 1207—1222.
Zhang, G., and K. H. Cook. 2014. “West African Monsoon Demise: Climatology, Interannual Variations, and Relationship to Seasonal Rainfall.” Journal of Geophysical Research 119: 175—193. doi:http://dx.doi.org/10.1002/ 2014JD022043.
Zhu, C. W., W. S. Lee, H. W. Kang, and C. K. Park. 2005. “A Proper Monsoon Index for Seasonal and Interannual Variations of the East Asian Monsoon.” Geophysical Research Letters 32: L02811. doi:http://dx.doi.org/10.102 9/2004GL021295.
29 January 2016
CONTACT ZHU Cong-Wen tomzhu@camscma.cn
© 2016 The Author(s). Published by Taylor & Francis.
This is an Open Access article distributed under the terms of the Creative Commons Attribution License (http://creativecommons.org/licenses/by/4.0/), which permits unrestricted use, distribution, and reproduction in any medium, provided the original work is properly cited.
猜你喜欢
杂志排行

Atmospheric and Oceanic Science Letters的其它文章
- Quasi-biennial oscillation signal detected in the stratospheric zonal wind at 55-65°N
- Long-term surface air temperature trend and the possible impact on historical warming in CMIP5 models
- Precipitation as a control of vegetation phenology for temperate steppes in China
- An observational study on vertical raindrop size distributions during stratiform rain in a semiarid plateau climate zone
- Asymmetric association of rainfall and atmospheric circulation over East Asia with anomalous rainfall in the tropical western North Pacific in summer
- Estimation of the surface heat budget over the South China Sea