Comparison of alternative route selection strategies based on simulation optimization
2016-11-23YeBojiaLaneSherryChenChunHungTianYong
Ye Bojia,Lane Sherry,Chen Chun-Hung,Tian Yong,*
aNational Key Lab of Air Traffic Flow Management,Nanjing University of Aeronautics and Astronautics,Nanjing 210016,China
bCollege of Civil Aviation,Nanjing University of Aeronautics and Astronautics,Nanjing 210016,China
cCenter for Air Transportation Systems Research,Department of Systems Engineeringamp;Operations Research,George Mason University,Fairfax,VA 22030,USA
Comparison of alternative route selection strategies based on simulation optimization
Ye Bojiaa,b,Lance Sherryc,Chen Chun-Hungc,Tian Yonga,b,*
aNational Key Lab of Air Traffic Flow Management,Nanjing University of Aeronautics and Astronautics,Nanjing 210016,China
bCollege of Civil Aviation,Nanjing University of Aeronautics and Astronautics,Nanjing 210016,China
cCenter for Air Transportation Systems Research,Department of Systems Engineeringamp;Operations Research,George Mason University,Fairfax,VA 22030,USA
Air traffic flow management(ATFM)is a collaborative process between the airspace provider and the airspace users.The result of the collaboration should be an outcome that maximizes the utility of the system without excessively penalizing any of the agents.This paper develops a discrete-event simulation model which consists of aggregate departure/arrival airports,flight routes,and sectors for evaluating the alternative collaborative route selection strategy.Given the different perspectives from air traffic control center(ACC)and airlines,eight performancemetrics and five alternative route selection strategies represent the past,current and proposed air traffic flow management operations that were evaluated.The Monte Carlo method combined with the Optimal Computing Budget Allocation(OCBA)simulation optimization technique is employed to assess the performance of different strategies.A case study of the upper air routes in central and southern China shows that the proposed model can be readily implemented to simulate different kinds of air traffic flow management strategies and predict the effect of changes on the airspace system.It also shows that the proposed alternative collaborative route selection strategy is an effective way in alleviating the en-route traffic congestion.
1.Introduction
With the rapid development of civil aviation in China,the air traffic congestion problem has created an urgent need for upgrading the air traffic flow management mode.According to the Chinese civil aviation developed statistical bulletin,1the on-time performance rate for flights declined to 69.09%in 2014.The Chinese air transportation system is heading toward a severe crisis and will face many challenges.In order to alleviate the stress of air traffic operation,civil aviation administration of China(CAAC)started the project known as the collaborative decision making-air traffic flow management(CDM-ATFM)system,and completed the construction of the first phase in 2014.Currently,the primary collaborative departure management system has been set up to balance the demand and capacity in airports by regional traffic management centers(RTMC).However,RTMC and airlines do not have any shared impact assessment tools,but the responsibility for solving major air traffic congestion still falls upon the RTMC.Thus,improving the decision making process and alleviating the flight delay problem have become research focus in China.
Many scholars have conducted extensive research on the subject of ATFM for decades,and these works can be divided into two major types:(1)optimization;and(2)simulation.
Optimization is generally designed to model the air traffic system by means of mathematical formulations or expressions.Most of the research takes a centralized perspective,attempting to develop integral programming models.2–5Bertsimas and Patterson6,7proposed an integer programming model that covers all the phases of each flight with a broad range of ATFM intervention options including ground and airborne delay,speed control,and rerouting.Kotnyek and Richetta8proposed two static-stochastic models for the ground holding problem(GHP)that exercise control on groups of flights instead of individual flights under the CDM paradigm.Lulli and Odoni9presented a deterministic model which designs flow management strategies involving combinations of ground and airborne holding.Agustin et al.10,11presented a framework for modeling multistage mixed 0–1 problems for ATFM with rerouting.They also considered several types of objective functions and allowed for flight cancelation and rerouting.Sherali et al.12proposed a model that selects among alternative flight plans for the affected flights while integrating a slot exchange mechanism.One limitation of these works is that only one objective function can be employed by each model,such as the total system delay time or delay cost.If more goals are considered,the issue will become the multi-objective optimization which is an intractable problem.Moreover,the shortcomings of an optimization model which lacks feedback and dynamics make it difficult to accurately re flect the interactive procedure between Air Traffic Control Centers(ACCs)and airlines.
Simulation is designed to imitate the operation of air transportation system over time,and to clarify what would happen in a given situation.Most of the research is presented by considering an approach or algorithm based on some sophisticated simulation system.Campelletal.13modeled the information sharing and collaboration in weather-induced schedule disruptions by the intelligent agent-based model for policy analysis of collaborative traffic flow management(IMPACT).Wanke et al.14studied the probabilistic airspace congestion management method based on the demand prediction function of Enhanced Traffic Management System(ETMS).Wolfe et al.15developed a collaborative traffic flow management simulation model with Bramhs to study the route assignment procedure.Ramamoorthy et al.16proposed a trajectory-based probabilistic traffic flow management approach by the Probabilistic NAS Platform(PNP)which is a real-time probabilistic traffic flow management evaluation system.Tumer and Agogino17,18tested a multi-agent algorithm for traffic flow management by future air traffic control concepts evaluation tool(FACET)which is a simulation and analysis tool for exploration,development and evaluation of advanced air traffic management concepts.Calderon-Meza and Sherry19studied the effects on the NAS of adaptable route selection behavior of airlines based on current and historical performance information by FACET.These works are mainly based on a maturity simulation system lacking extensible interfaces.It is too difficult to combine new strategies with required metrics.Also the computational cost that accompanies the nation-wide simulation is expensive and often unacceptable.Hence,a simpler and efficient model with an intermediate level of stochastic features would be preferred for studying the ATFM problem.
Thus,the objective of this paper was to develop a discreteevent simulation model for evaluating the alternative collaborative route selection strategy.The simulation model with the outcomes of collaborative strategy could provide the ACCs and airlines with suggestions in advance to aid in ATFM decision-making.The rest of the paper is organized as follows:Section 2 introduces the construction of airspace system model with stochastic capacity and uncertain demand.A collaborative route selection strategy with other four practical route strategies is also defined in this section for comparison.In addition,8 performance metrics and a flight delay model are presented to help airlines make route selection decisions for themselves.In Section 3,OCBA is combined with our simulation optimization to dramatically improve the efficiency of Monte Carlo simulation.In Section 4,a special case in Central and Southern China is considered as an example for strategy comparison and analysis.The discrete-event model is developed in Arena software,and the OCBA algorithm is written in the C++programming language.Finally,Section 5 summarizes our main findings and discusses several directions for future work.
2.Model and route selection strategies
2.1.Airspace modeling
Our airspace network model consists of two aggregate departure/arrival airports,flight routes and sectors.The aggregate airports are equivalent to the ‘virtual” airports and act as source and destination nodes in the airspace network model.The directional aircraft flow will transit from the aggregate departure airports to the aggregate arrival airports along flight routes passing through several sectors.In the real world,the aggregate airports are described as different airports that are not necessarily collocated but include some flights scheduled to travel though a common route segment.The combination of en-route sectors represents a route segment in which a flight may pass through according to the schedule.Also,each enroute sector is modeled as a multi-server queue,and the server’s number represents the capacity limitation of each sector which is defined as the number of aircraft that can fly in the sector simultaneously in accordance with the current air traffic control rules(CCAR-93TM-R4,air traffic control rules).20Thus,different sectors should have different transit times with some stochastic deviation.In order to include the predeparture uncertainty,en-route traversal time uncertainty,and en-route capacity uncertainty,a method that combines capacity uncertainty with demand uncertainty is presented and applied to construct the airspace model.
2.1.1.Stochastic capacity
Capacity uncertainty is a significant factor that affects the performance of the air traffic system.Sources of capacity uncertainty include14:(1)the difference in abilities of varied air traffic controllers;(2)the uncertainties in wind forecasting and aircraft performance modeling;and(3)multiple traffic flow patterns.In our airspace model,capacity uncertainty can be captured by two parameters:(1)introduce the sector traversal time as a random variable that has an independent and identical distribution(IID);and(2)add a capacity changing event which may be caused by severe weather or ATC problem.Each sector is initialized with a speci fic number of capacity resources.An aircraft that arrives and finds the capacity resources available enters the sector immediately and holds one capacity resource.An aircraft that arrives when the available capacity resource is zero joins the end of a single queue.Upon leaving this sector,an aircraft releases one capacity resource and another aircraft can enter the sector in a firstcome first-served(FCFS)order.When severe weather happens,some flight levels,entrances,and exits in the sector may be blocked.In this situation,the capacity resource will be reduced until the event ends.In this scenario,the bottleneck of the network can be simulated,and the dynamics and uncertainty of system can be captured.
2.1.2.Uncertain demand
Demand uncertainty is another critical factor in the current system performance.The pop-up traffic,changes in departure times and flight plans,cancellations,displacement of traffic,en-route wind and ATC-caused deviations are factors that may cause inaccurate predictions of demand.16The demand uncertainty may lead to over-or underestimating the imbalance between demand and capacity.The definition of the uncertainty characteristic of demand in the simulation system is very important.In the queueing network,inter-arrival times are created as IID random variables to model the randomness for pop-up traffic or flight cancellations.Thus a random flights’demand with known mean and variance is constructed.Since this paper proposes to measure the performance of the system and different strategic decisions,the probability distribution of demand will be an important input to the system.In addition to the uncertainty of the number offlights and departure times,other detailed information such as aircraft type and connecting/non-connecting flights is also created as random variables.The potential delay cost of each flight can therefore be determined and included in the strategic decisions.
2.2.Route selection strategies
To make decisions on behalf of different agents,the goals of agents should be defined.21Besides the shared safety goal for both agents,the main objectives of the ACC Agent were as follows:(1)congestion mitigation,(2)workload reduction,and(3)airline satisfaction.The main goals of the Airline agents are as follows:(1)cost reduction,(2)reliability guarantee,and(3)on-time service.In this paper,it is assumed that the goals are translated into metrics for each agent.The measure of congestion mitigation is described in terms of system delay time and sector en-route delay time.Workload reduction is proposed as the maximum number of simultaneous en-route waiting flights and the maximum waiting time for a sector.Airline satisfaction is assumed to be the system delay cost and sector delay cost.Reliability guarantee and on-time service link to on-time departure rate and delay rate.All eight metrics for the system performance are defined in Table 1.
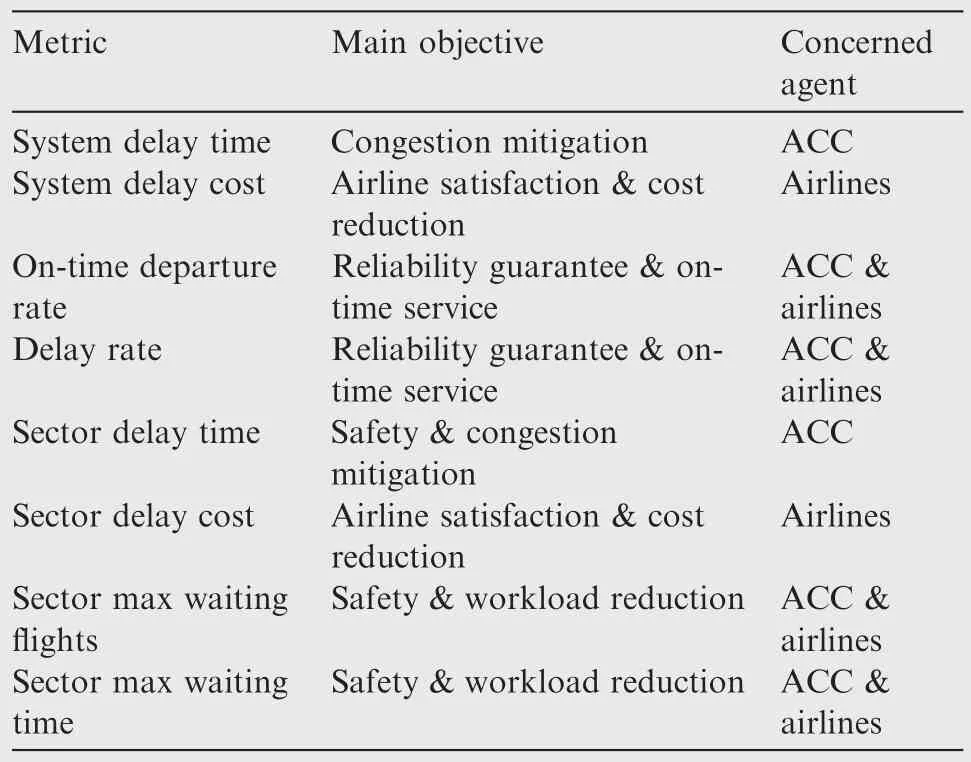
Table 1 System performance metric.
Based on the metrics de fined above, five types of alternative route selection strategies representing the past,current and proposed air traffic flow management operations are discussed in Section 2.2.1,which are as follows:(1)no intervention,(2)ACC introduces Miles-In-Trail(MIT),(3)airlines introduce rerouting decisions based on ACC MIT,(4)ACC introduces MIT and rerouting,and(5)ACC introduces MIT and rerouting based on ACC and airlines decisions.Also,in order to support the decision-making by selection strategies,two estimated flight delay models that can calculate the potential delay time and delay cost are introduced in Section 2.2.2.
2.2.1.Alternative strategies
(1)No intervention(Strategy 1)
No intervention occurs when no advanced action is taken to respond to the capacity changing event.In this situation,the imbalance between demand and capacity in the capacityreduced sector occurs and airborne delay strategies and FCFS rules are followed to deal with the congestion problem.
(2)ACC introduces MIT(Strategy 2)
ACC introduces a time-based MIT strategic decision based on advanced planning.The initiative is designed to reduce the demand to match the capacity during the capacity reducing time period.Subsequently,the airlines are required to take ground delay program(GDP)to adjust the arrival time for the target sector.This strategy simulates the current TFM operation.
(3)Airlines introduce rerouting decisions based on ACC MIT(Strategy 3)
Airlines introduce rerouting decisions based on ACC MIT which is similar to the collaborative trajectory options program(CTOP)22released by FAA.After the initial MIT decision is released by ACC,each Airline makes alternative route selections based on its own flight delay cost.The decision is the result of the estimated flight delay costs from the model which will be introduced later.Also,when an Airline decides to reroute affected flights instead of taking the GDP,the compression algorithm(CA)will be used to re-allocate the GDP time for the following flights.
(4)ACC introduces MIT and rerouting(Strategy 4)
ACC introducing MIT and rerouting as a proposed strategy is similar to the current TFM operations.However,most of time decisions are made separately regarding GDP(caused by MIT)and airspace flow program(AFP).12In this strategy,GDP and AFP are used together to test the best performance of the system in a capacity changing event.Once ACCs make advance unilateral decisions regarding MIT and rerouting offlights,the flights are rerouted randomly to adjust the imbalance in the target sector.Also,different percentages of rerouted flights are tested in this alternative to obtain the best system performance.
(5)ACC introduces MIT and rerouting based on ACC and airlines(Strategy 5)
ACC introducing MIT and rerouting based on ACC and airlines is the final proposed strategy in this traffic flow management research.Unlike the rerouting initiative given by TFM or airlines unilaterally,we establish a procedure for ACC and airlines to make collaborative decisions about the rerouting initiative.In this strategy,the MIT and percentage of rerouted flights will be decided by ACC first and then each Airline makes an alternative route selection based on its own objectives,such as flight delay cost.
2.2.2.Flight delay model
(1)Estimated flight delay model(EDM)
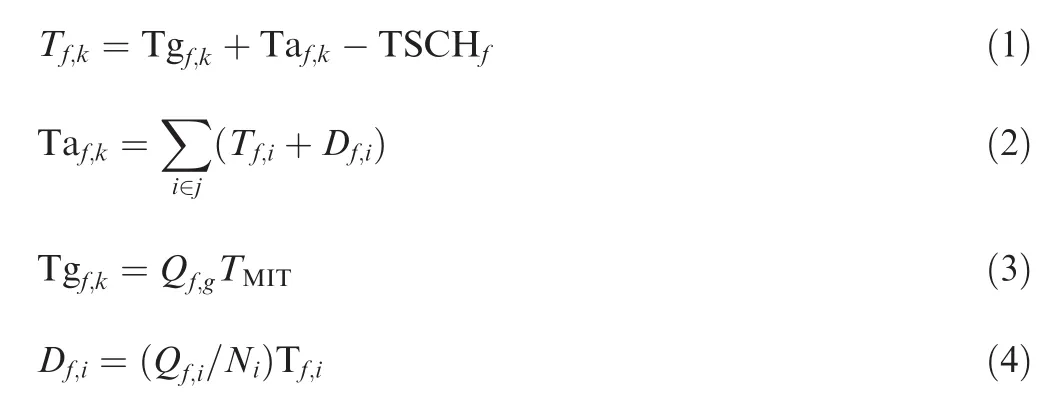
The key parameters of the model are the mean value of each sector transit time,the real-time queue length of each sector and the potential GDP time for the target flight,and in practice airlines can use their own models.
Since the sector transit time is set as IID,the mean value can be obtained easily.Also in practice,this value can be calculated from historical flight data by inductive-dynamic method.The real-time queue length of each sector is a basic process variable which can be obtained from Arena model.This is research about demand prediction and the accuracy of the value relative to the look-ahead times(LAT),not about prediction improvement.The assumption is that this value can be improved,acquired and shared by all airspace users or this value can be obtained by airlines’own prediction model(e.g.model with historical data analysis and machine learning).The potential GDP time is based on the number offlights affected by MIT and can be calculated based on the number offights being held on the ground.Also,this information is based on current ATFM operations.
The estimated total delay time and estimated airborne delay time are shown in Eqs.(1)and(2).The estimated GDP delay time resulting from choosing route k and extra delay time in sector i for flight f is included in Eqs.(3)and(4).The relative variables are defined in Table 2.
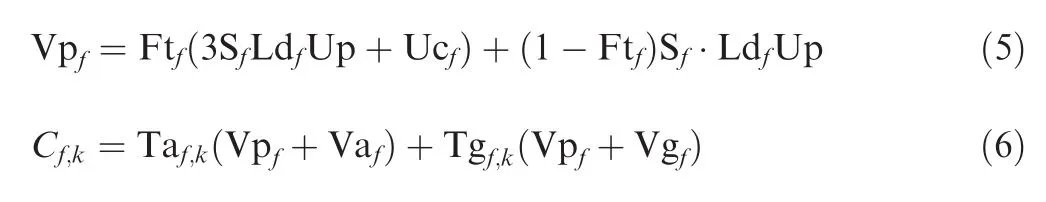
(2)Estimated flight delay cost model(ECM)
This model is used to compute the estimated delay cost of each flight before its departure.First,it is assumed that the potential GDP time and estimated airborne delay time can be calculated by the EDM model.Then basic flight performance information is included to calculate the estimated flight delay cost.The four types of aircraft introduced in this model are Heavy,Large,Medium,and Small,and are primarily differentiated by the number of seats available.In addition to the available seating,the aircraft has varied time operating costs such as airborne fuel and crew delay cost.The estimated flight delay cost is computed by adding delay time fuel cost,passenger delay cost and crew delay cost together.It is assumed that the cost per time of GDP fuel is 1/20 of airborne delay fuel cost,and the cost per time of a passenger on connecting flights is three times the cost of a passenger on non-connecting flight.15For connecting flight crew members,the crew delay cost also considers the potential passenger delay on the follow-up flight to distinguish from non-connecting flight.The calculation of estimated flight delay cost is shown in Eq.(5).Eq.(6)reconciles the unit time passenger delay cost of a flight.The unit of time for passenger delay from a connecting flight is larger than that from a non-connecting flight.The relative variables are de fined in Table 3.

Table 2 Variables for EDM.
3.Simulation optimization with OCBA
The alternative collaborative route selection can be approached as a stochastic simulation optimization problem,which refers to stochastic optimization using simulation.The goal is to find out the best strategy with suitable parameters to optimize the system metric defined above.We employ a Monte Carlo approach for simulation and evaluating different route selection strategies,and introduce OCBA to improve the efficiency of simulation.OCBA is a popular control-theoretic simulation technique that can intelligently determine the most efficient simulation replication numbers for all simulated alternatives.23,24The details of the simulation optimization procedure are as follows25:
3.1.Simulation optimization
The goal of our simulation is to select a route selection strategy associated with the best system performance metric,such as system delay time,sector delay time or system delay cost.Thus,we can consider this simulation optimization problem with the following objective function:
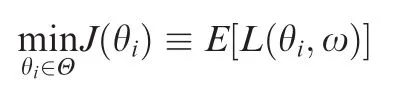
where Θ ≡ {θi,i=1,2,...,k}is the search space,θiis a vector of all the decision variables and also called a design,L(θi,ω)represents a sample performance estimate obtained from the output of one simulation replication for design i,and E[L(θi,ω)]is estimated using its sample mean:
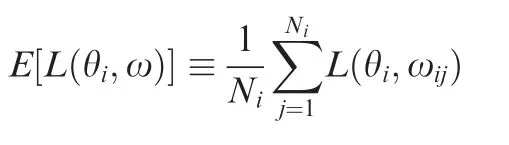
where ωijcomprises the jth sample of the randomness ω for design i and Nirepresents the number of simulation samples for design i.The simulation output is obtained as an average performance,so according to the central limit theorem,we can assume that the simulation output samples L(θi, ωij)are normally distributed and independent from replication to replication.Under a Bayesian framework,a posterior distribution of the system performance metric J(θi)can be constructedbased on prior knowledge of the system’s performance and current simulation output.Let~J(θi)denote the random variable whose probability distribution is the posterior distribution of design i.Thus the posterior distribution of J(θi)is
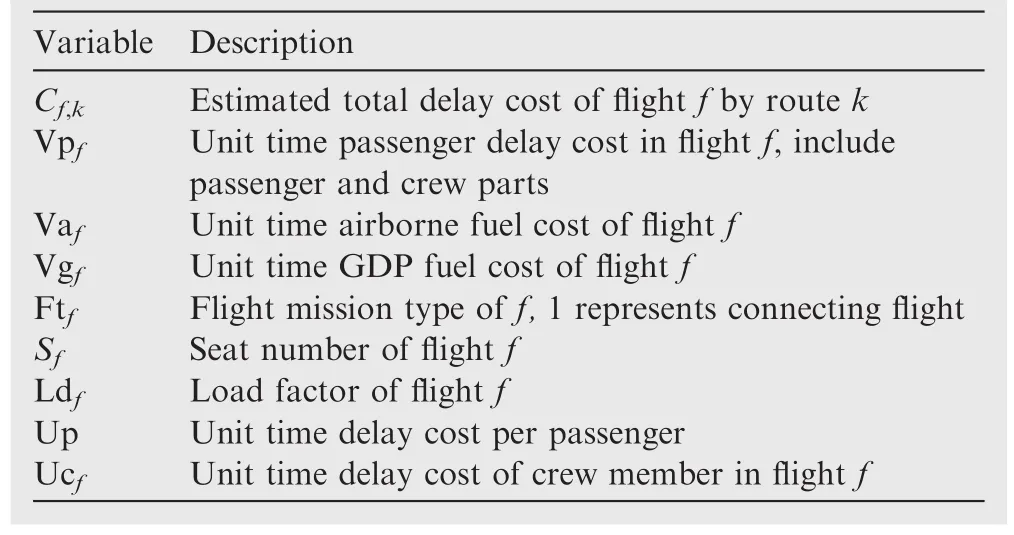
Table 3 Variables for ECM.
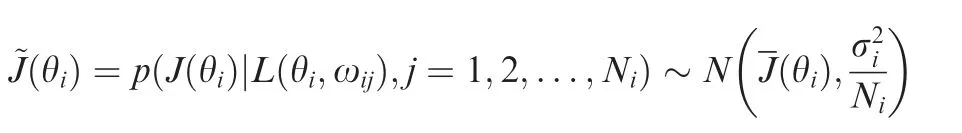
which implies that we are more confident with the sample mean estimator when Niincreases as the variance decreases.
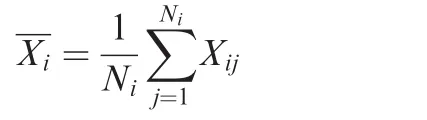
For the alternative collaborative route selection problem,time is a valuable resource.Often,it is too expensive to conduct enough simulation replications for all candidate designs when the design space is large.However,to improve the simulation precision,we must increase the number of simulation replications for each design.The simulation output is assumed to be independent from replication to replication and the sampling across designs are also independent.For notational simplicity,we define
Xij≡ L(θi,ωij)
Denote by
Xi:the sample mean of L(θi,ω),the simulation output for design i;
S2i:the sample variance of L(θi,ω),the simulation output for design i;
σ2i:the variance for design i,i.e.,σ2i=Var(Xij).In practice,
σ2iis unknown beforehand and so is estimated by the sample variance.
b:the design with the smallest sample mean metric;b=argmini{Xi}.
3.2.OCBA-based simulation optimization procedure
The probability of correct selection(P{CS})is defined as the probability that design b is actually the best design(i.e.,with the smallest mean of system delay time).The P{CS}can be expressed as
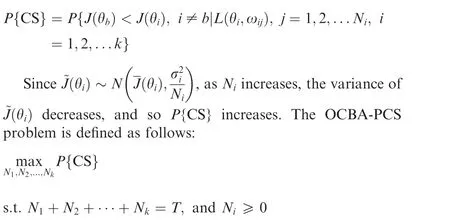
Here,T denotes the total number of simulation samples to be allocated to k competing designs whose performance is depicted by random variables with means J(θ1),J(θ2),...,J(θk), and finite variances σ21,σ22,...,σ2krespectively.As T→∞,the approximate probability of correct selection(APCS)can be asymptotically maximized when
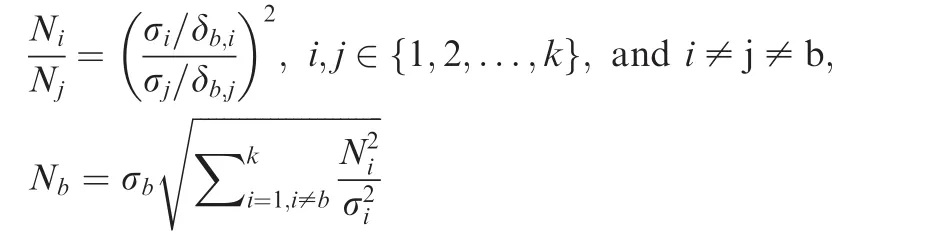
where δb,i=J(θb)-J(θi),and J(θb)≤ mini≠bJ(θi).Through optimal allocation of simulation samples,it has been shown that OCBA can dramatically enhance the simulation optimization efficiency.26–28The OCBA-based simulation optimization procedure is shown in Table 4.
4.Case study
In this section,we illustrate our airspace model with severe weather changing dynamically,and try to balance the demand and reduced route capacity with alternative collaborative route selection strategies in Central and Southern China.The discrete-event model is developed using Arena Simulation Software29and the OCBA algorithm is written in the C++programming language.The experimental procedure is as follows:
4.1.Airspace description and model development
En-route airspacestructure and radar flight data were obtained from Air Traffic Management Bureau of Central and Southern China(ATMB CSC).MapInfo software was used to draw the CSC airspace structure and relative jet routes(Fig.1).The upper air routes in Central and Southern China were taken as an example of alternative collaborative route selection analysis.Among this area,A461 is a primary upper air route which links two of the most important hub airports in China:ZGGG and ZBAA.Also,there are more than 30 airways servicing central and southern China along this route.Thus,if some severe weather happens in Sector AC16,an enormous number offlights may be affected.
Next,the CSC airspace was incorporated into our model.Let D represent the aggregate departure airports(e.g.ZGGG,ZGSZ and VHHH)where many flights schedule to fly over Central and Southern China along YIN-BUBDA-DAPROWHA-OBLIK.Let X represent the aggregate departure airports where some flights are scheduled to fly over Central and Southern China along three other routes:ONEMI-LLCGOSMA-WHA-OBLIK,HUY-LIN-WHA-OBLIK,and ENH-YIH-WHA-OBLIK.It is assumed that each air route is divided by the sector boundaries into route segments and named for the sector to which it belongs.Different route segments belonging to the same sector are singled out by adding a number as a suffix.The CSC airspace model is illustrated in Fig.2,and A represents the destination airports for all the flights departing from D and X.
It is supposed that some severe weather occurs in AC16,so portions of the capacity resources of AC16 become unavailable.Then the flights scheduled to fly over Central and Southern China through waypoint OBLIK may choose to join the alternative route YIN-BUBDA-LLC-LIN-YIH-ML through different waypoints or wait on the ground/en-route.The reroute CSC airspace model with GDP and MIT control points is illustrated in Fig.3 and the bold lines represent alternative routes for flights.Arena simulation software was used to build up discrete-event model.
4.2.Key parameters and experimental design
Radar flight data from January 3,2013 up to January 7,2013 encompassing 22,445 flight records were used to determine the most appropriate traversal time distribution for each route segment.The capacity resources for each sector are assumed to be a real integer number(Table 5).Consistent with reality,different route segments in the same sector share the capacity resources together.Based on maximum likelihood estimation principle,the parameters for each distribution are estimated using Arena Input Analyzer.According to the radar flight data statistic results,the CSC entry proportions from YIN,ONEMI,HUY,and ENY are set as 61.65%,35.65%,2.45%and 0.25%respectively.Also,in light of the available number of seats,four types of aircraft A,B,C and D are defined in this paper,and the values of other variables relative to flight delay model are assumed in Table 6.
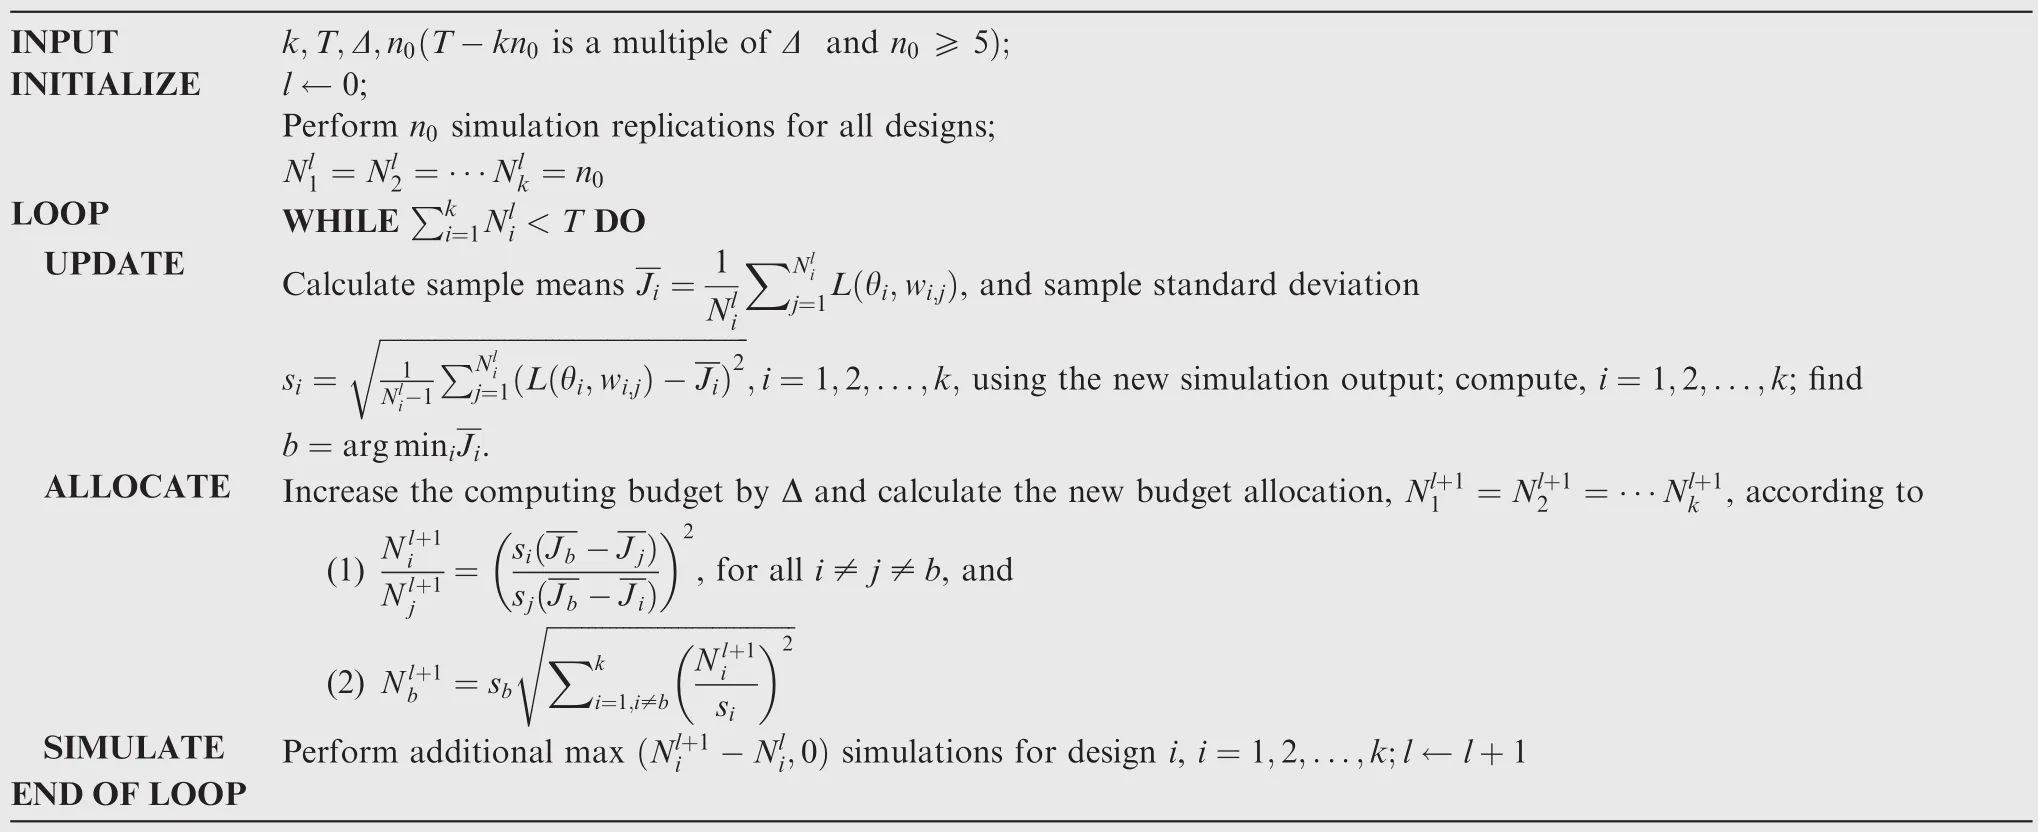
Table 4 Pseudo code for main algorithm.
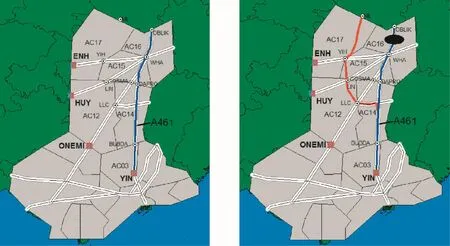
Fig.1 CSC airspace structure.
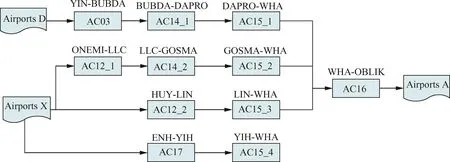
Fig.2 CSC airspace model.
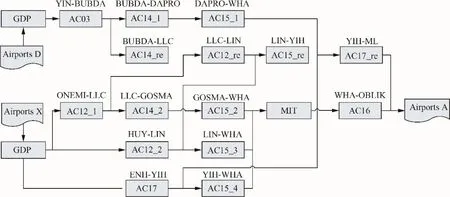
Fig.3 CSC reroute model.
With the parameters above,a simulation sample of sector AC16 is illustrated in Fig.4.The horizontal axis shows the simulation time while the vertical axis shows the capacity resource.The yellow line represents the capacity resource of AC16,and the green and red broken lines represent the number of arrival flights and waiting queue for sector AC16 respectively.As we can see from Fig.4,the sector performance is in good condition with only a small number offights waiting outside the sector AC16 for a few second during the simulation.On that basis,it is assumed that the capacity resource ofAC16 will be reduced by severe weather from 15 to 7 for 2 h after the simulation begins.400 aircrafts are scheduled to fly over CSC and five alternative strategies with OCBA will be introduced in the next section to show the performance of total system and sector AC16.
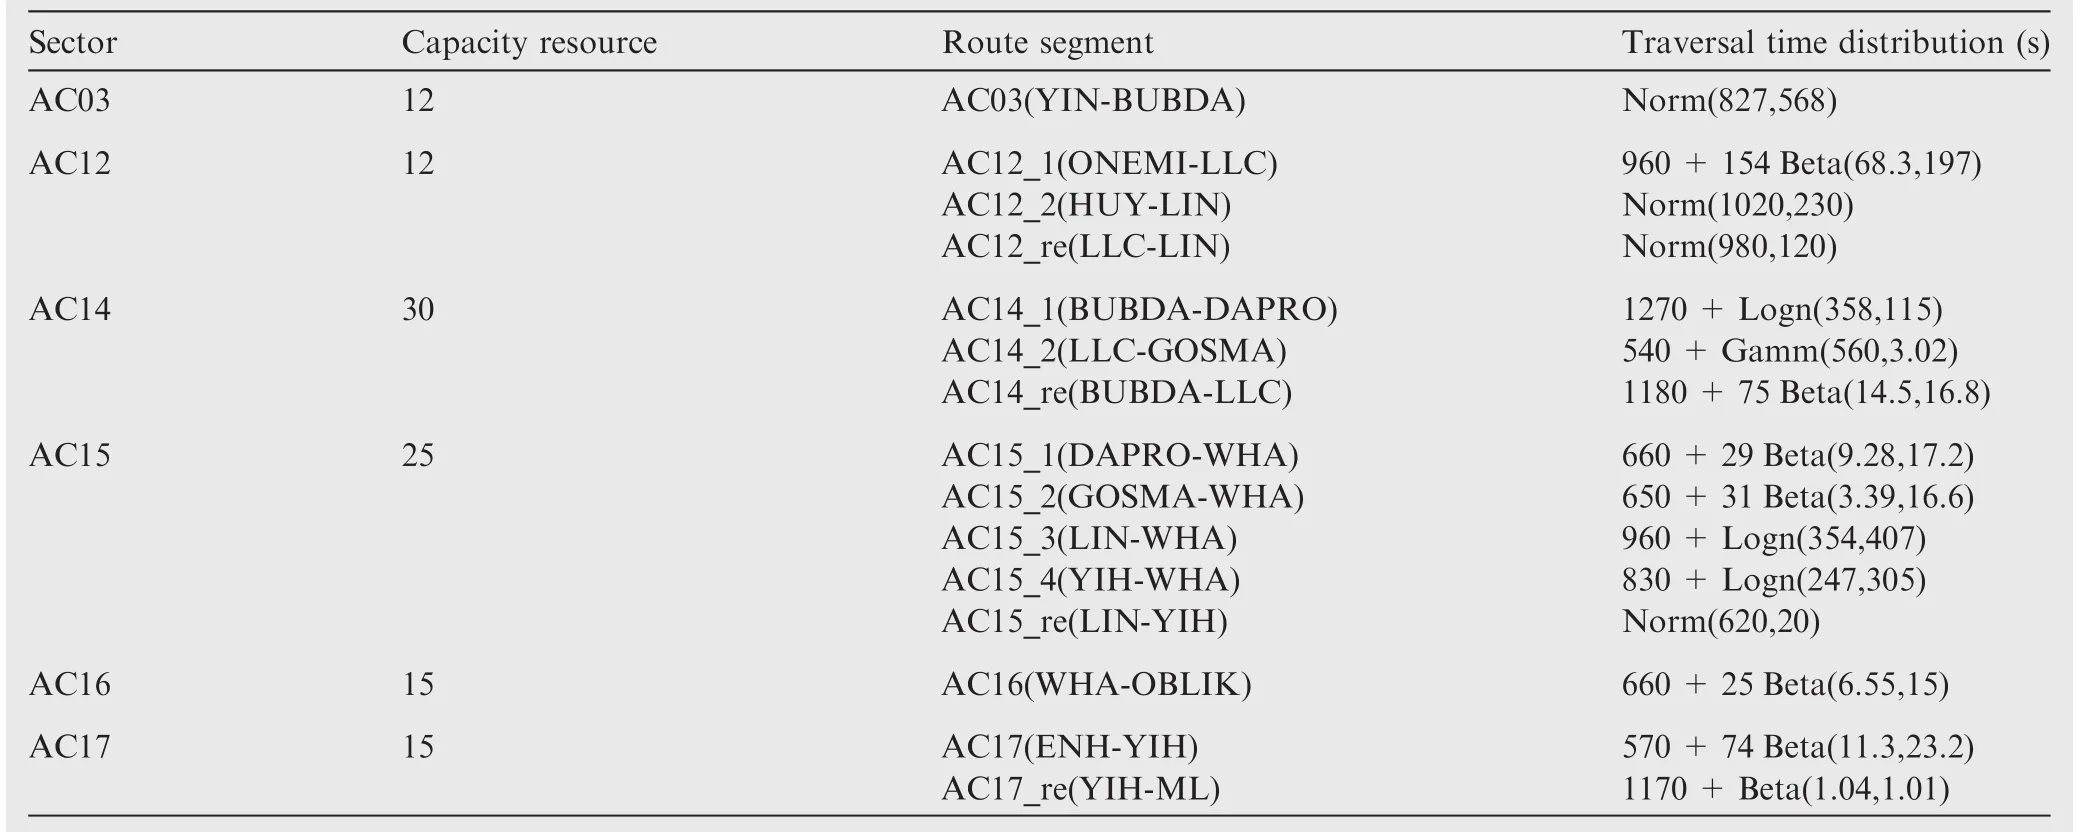
Table 5 Route segment traversal time distribution.
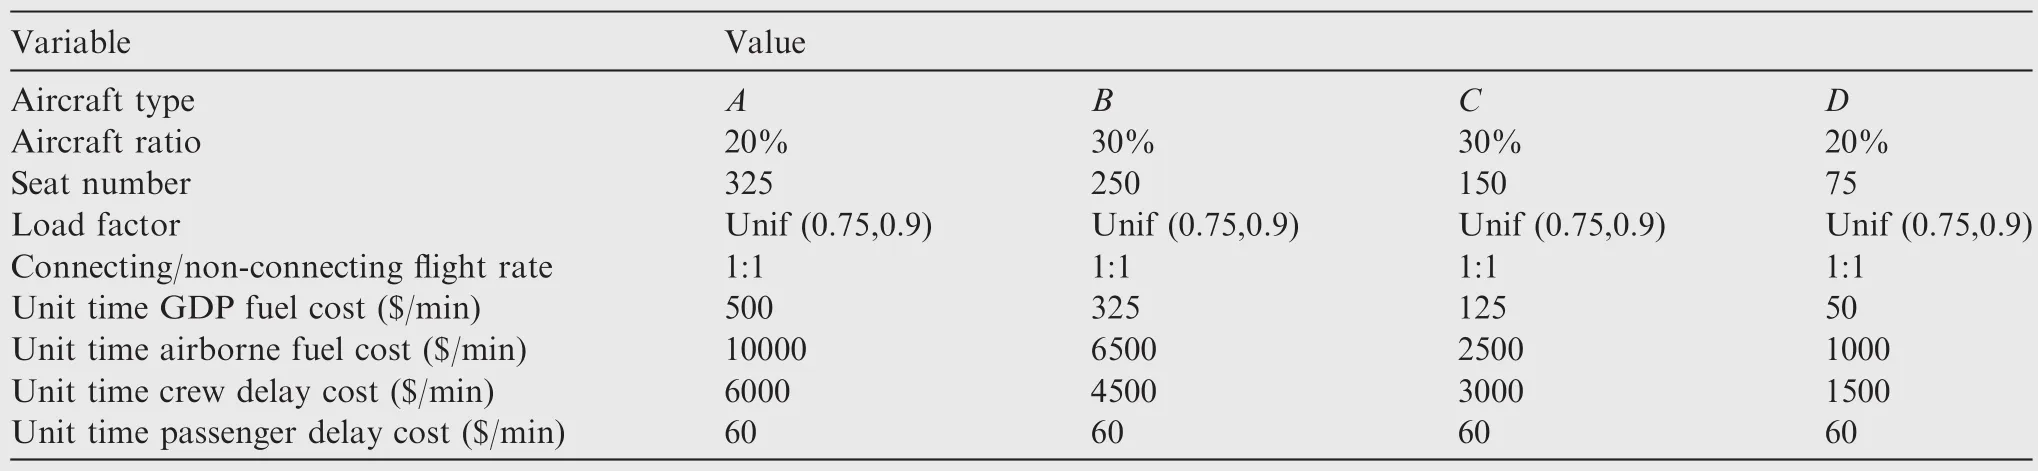
Table 6 Variables for flight delay model.
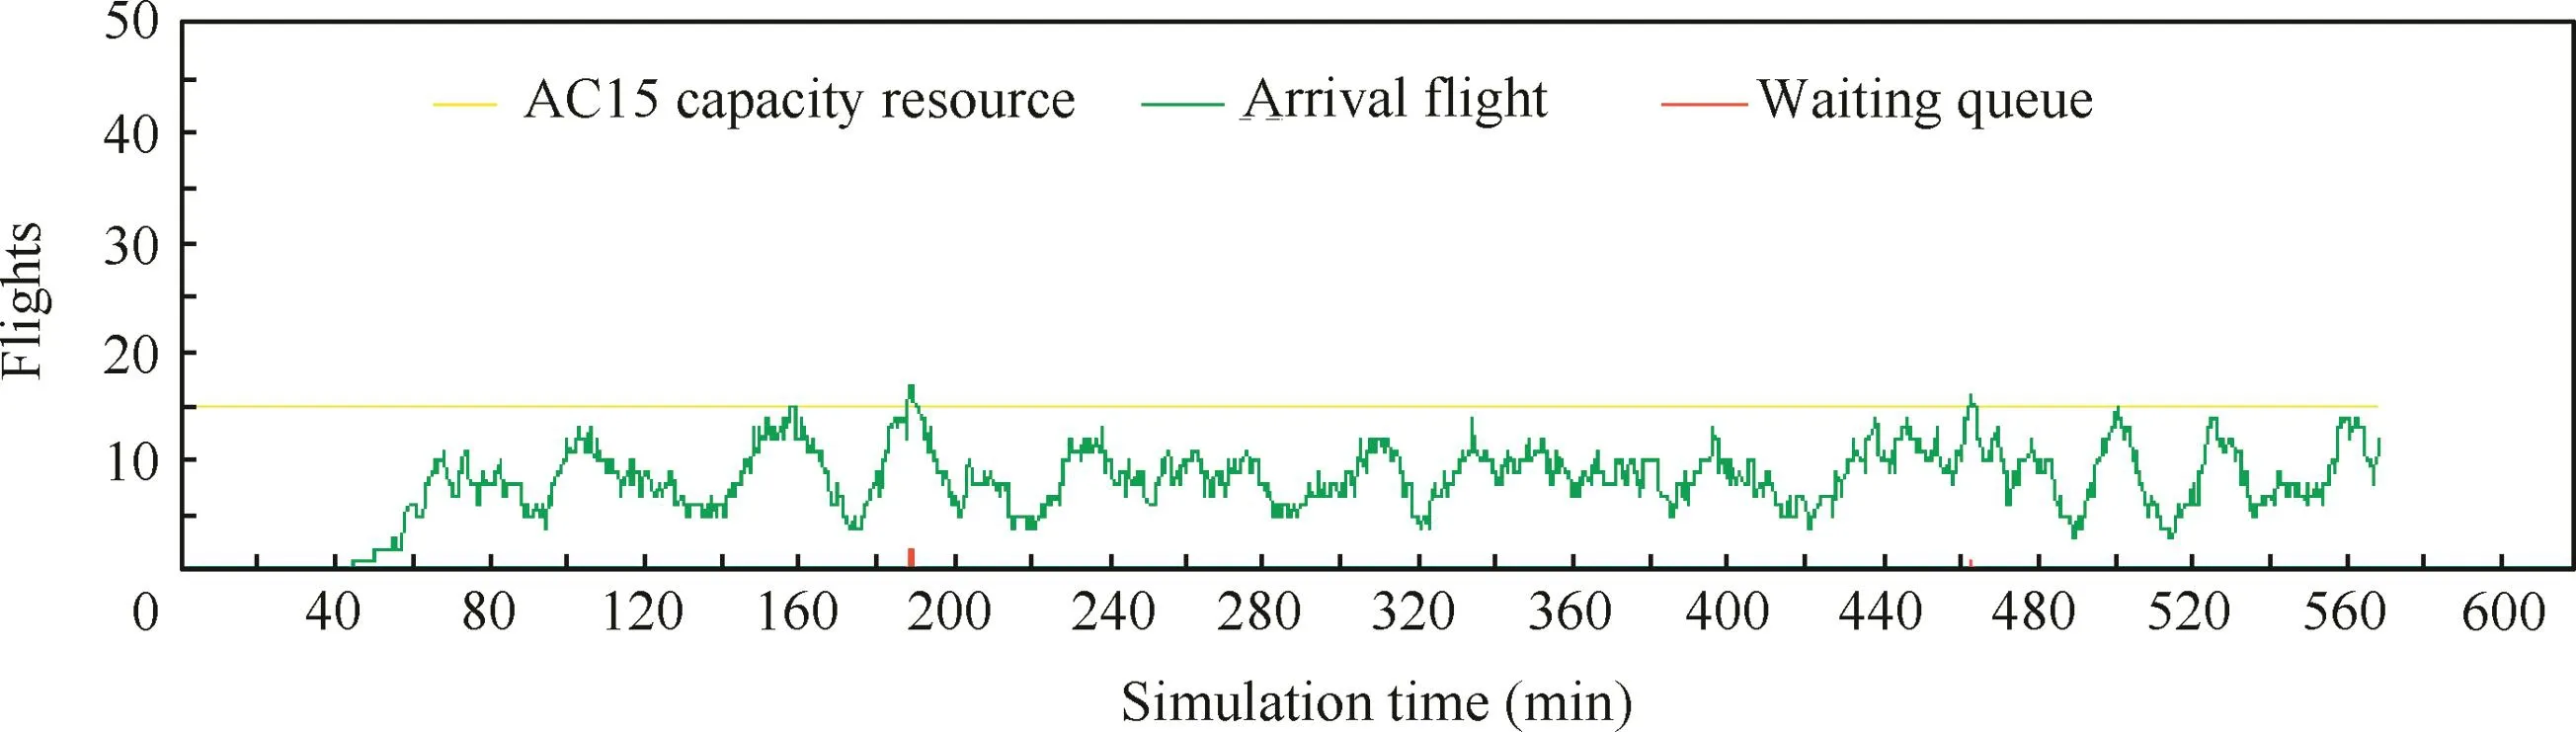
Fig.4 A performance sample of sector AC 16.
4.3.Observations
4.3.1.Strategy 1
For Strategy 1,no intervention is taken during the capacity resources reduced time.It is set as the baseline case in our study.The Monte Carlo method is used to analyze the system performance,and 20 replications with more than 8000 aircrafts are conducted in the simulation.The mean values and standard deviations for performance metrics are shown in Table 7.
It can be seen from Table 7 that the system delay time and cost are equal to the en-route delay time and cost for AC16,which are 1631 min and 8708169 dollars, respectively.Although all simulated flights depart on time,the average delay rate is as high as 12.18%.The maximum number of simultaneous en-route waiting flights for AC16 is 29 with the maximum airborne delay time of 35.87 min.A performance sample of Strategy 1 is illustrated in Fig.5,and it can be seen that 7 capacity resources of AC16 are left between simulationtime 180 min and 300 min,and a large amount of aircrafts are held en-route outside AC16.A ‘bow shape”waiting queue appears during the AC16 capacity resource reduced time.
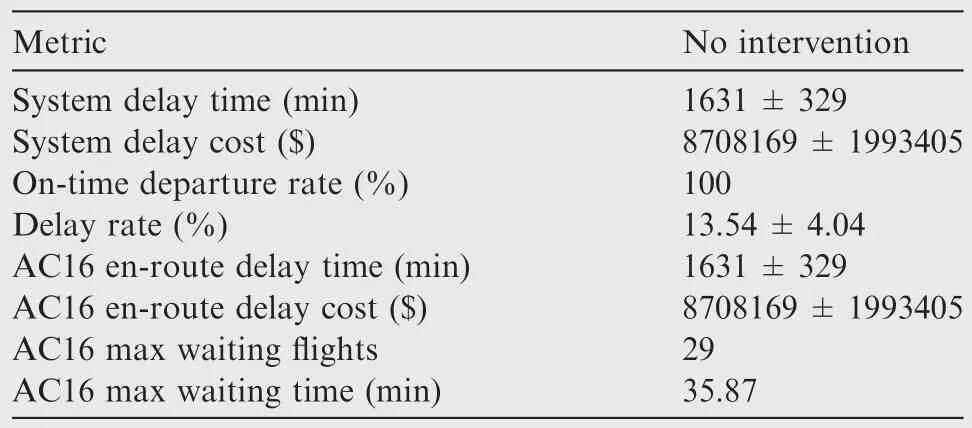
Table 7 Simulation results of Strategy 1.
4.3.2.Strategy 2
For Strategy 2,ACC introduces a distance/time-based MIT strategy.Resembling the current TFM in China,the MIT strategy is assumed to begin at the start of capacity resources reduced time and end with capacity recovery in this paper.Subsequently,some en-route waiting flights affected by the MIT strategy that depart from AC03 can translate en-route waiting into ground delay,and the imbalance between demand and capacity in the AC16 may be alleviated during the severe weather period.
The MIT value is the key parameter for the strategy,but it is too expensive to conduct enough simulation replications for all candidate designs.So only 60 s,90 s,120 s,and 150 s are chosen as 4 MIT parameters,and the system delay time is chosen as the major metric for measuring all designs.After 20 initial simulation replications are conducted for each design,50 additional replications are reallocated to alternative designs according to OCBA-PCS algorithm introduced in Section 3.2.The final allocation scheme is 51,39,20 and 20 replications for 60 s,90 s,120 s and 150 s respectively,and the simulation results for all 4 designs are illustrated in Table 8.
It can be seen from the table that the average system delay time increases monotonically from 1727 to 5032 min with the rise of MIT values,while the system delay cost decreases to the lowest point first at 7345221 dollars and then jumps to 21998186 dollars.Since the 90 s MIT has the best performance in AC16 en-route delay time and cost,it is chosen as the suggested parameter for Strategy 2.A performance sample of Strategy 2 with 90 s MIT is illustrated in Fig.6.It can be seen that the imbalance problem for AC16 is alleviated during the capacity resources reduced time,but a ‘large spike”,which represents the simultaneous arrival of 30 flights at the AC16 sector,appears when the MIT strategy stops.
4.3.3.Strategy 3
For Strategy 3,airlines make rerouting decisions based on potential flight delay cost by themselves.Airlines can choose to delay flights on ground,outside the AC16 sector,or reroute along the alternative routes introduced in Fig.3.The MIT strategy introduced above is set as the initial suggestions from ACC,and the estimated delay time and cost for each flight are calculated according to the Flight Delay Model introduced in Section 2.2.2 to help airlines make decisions.Since the waiting queue length and available capacity resources for AC16 change with time,airlines will dynamically make decisions based on the latest updated information.For this strategy,20 simulation replications are conducted and the performance metrics are shown in Table 9.
It can be seen from the table that all metrics have some improvement over Strategy 2 with 90 s MIT,such as the system delay time and cost reduced to 82%and 83%respectively,and AC16 en-route delay time and cost reduced to 62%and 63%respectively.These are because some alternative route resource is available during the capacity reduced time.A performance sample of Strategy 3 is illustrated in Fig.7.It can be seen that although all the metrics achieve some improvement,the imbalance problem for AC16 still exists during the capacity resources reduced time.There are still some flights waiting outside AC16,especially at the time when the strategy is finished.It seems that the congestion and safety problem for AC16 cannot be solved efficiently using only the aspects of delay cost by airlines.
4.3.4.Strategy 4
For Strategy 4,ACC introduces GDP/MIT and rerouting together as a combination strategy.ACC will decide the key parameters for both MIT and rerouting initiatives.The MIT parameter is set as 90 s according to the simulation results introduced in Strategy 2,so the rerouting percentage becomes the key parameter for this strategy.
It is assumed that the percentage of rerouting flights ranges from 20%to 60%with 10%step-size.OCBA-PSC algorithm is used to improve the efficiency of the simulation with the system delay time chosen as the major metric.20 initial simulation replications are conducted for each design first,and 50 additional replications are reallocated to alternative designs.The final allocation scheme is 48,34,28,20 and 20 replications for 20%,30%,40%,50%and 60%respectively,and the simulation results for all 5 designs are illustrated in Table 10.
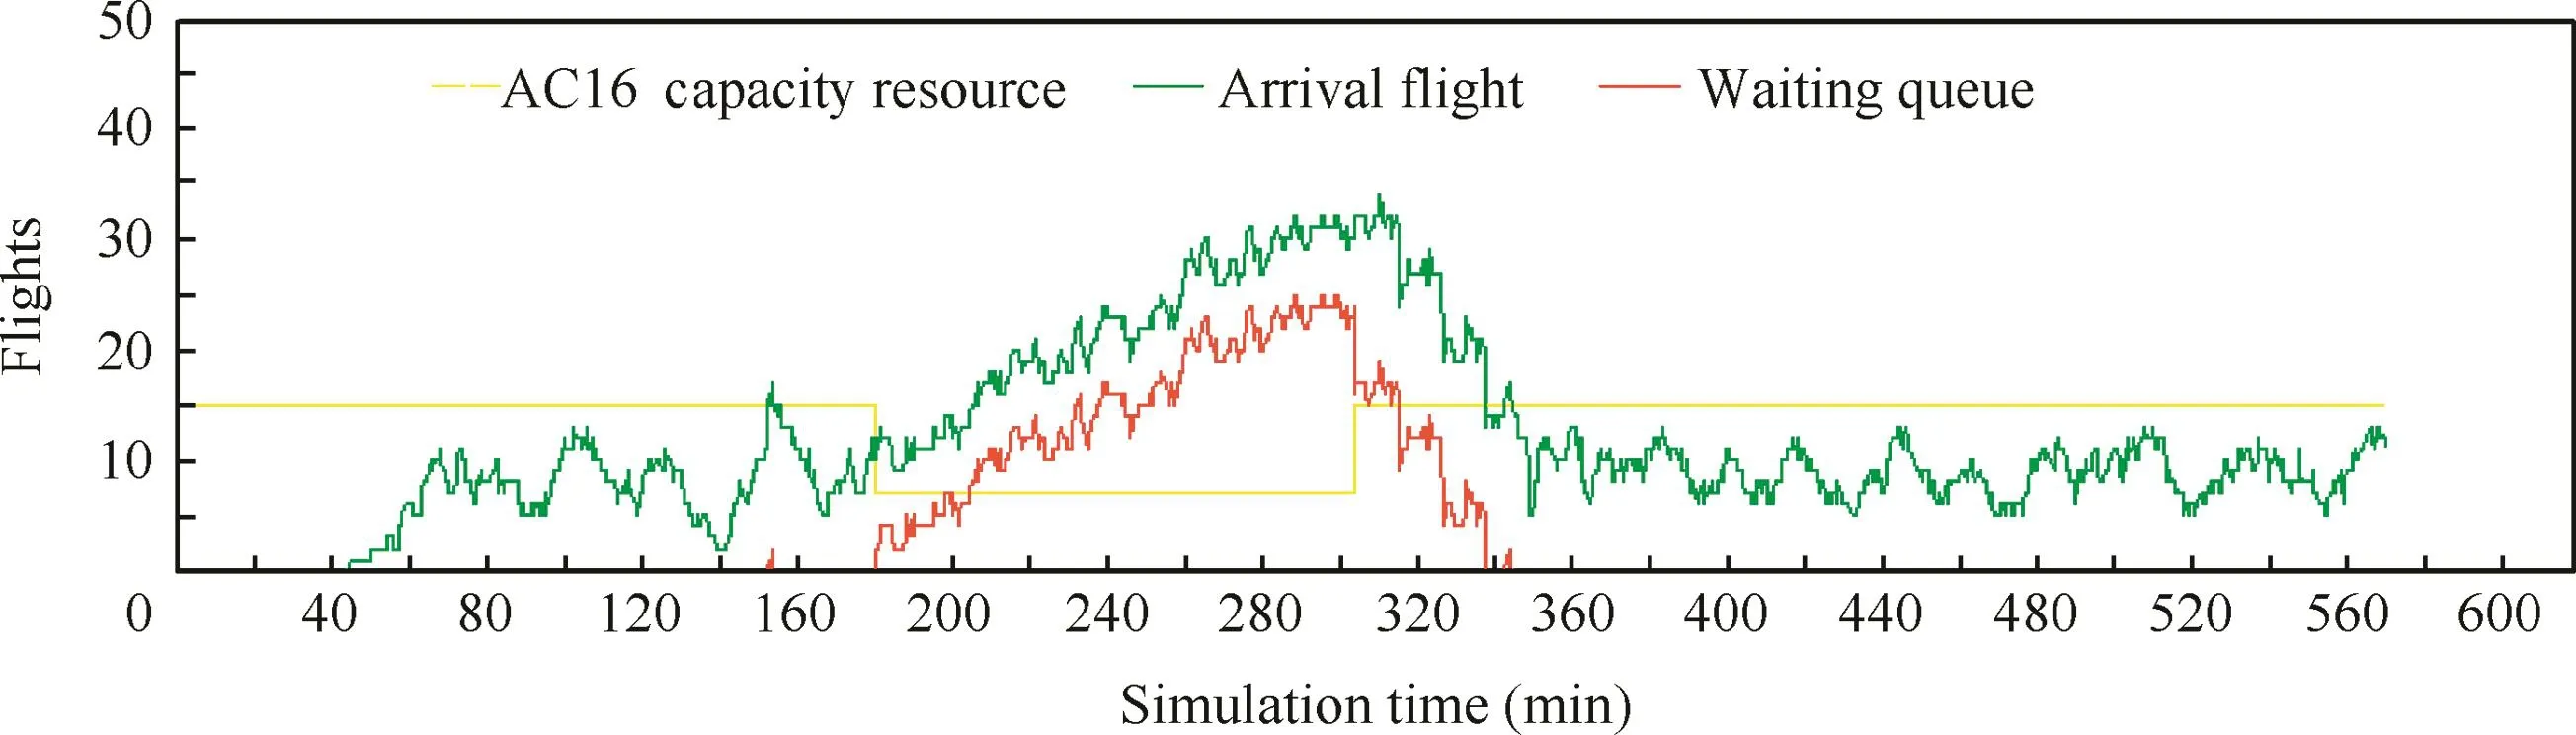
Fig.5 A performance sample of Strategy 1.
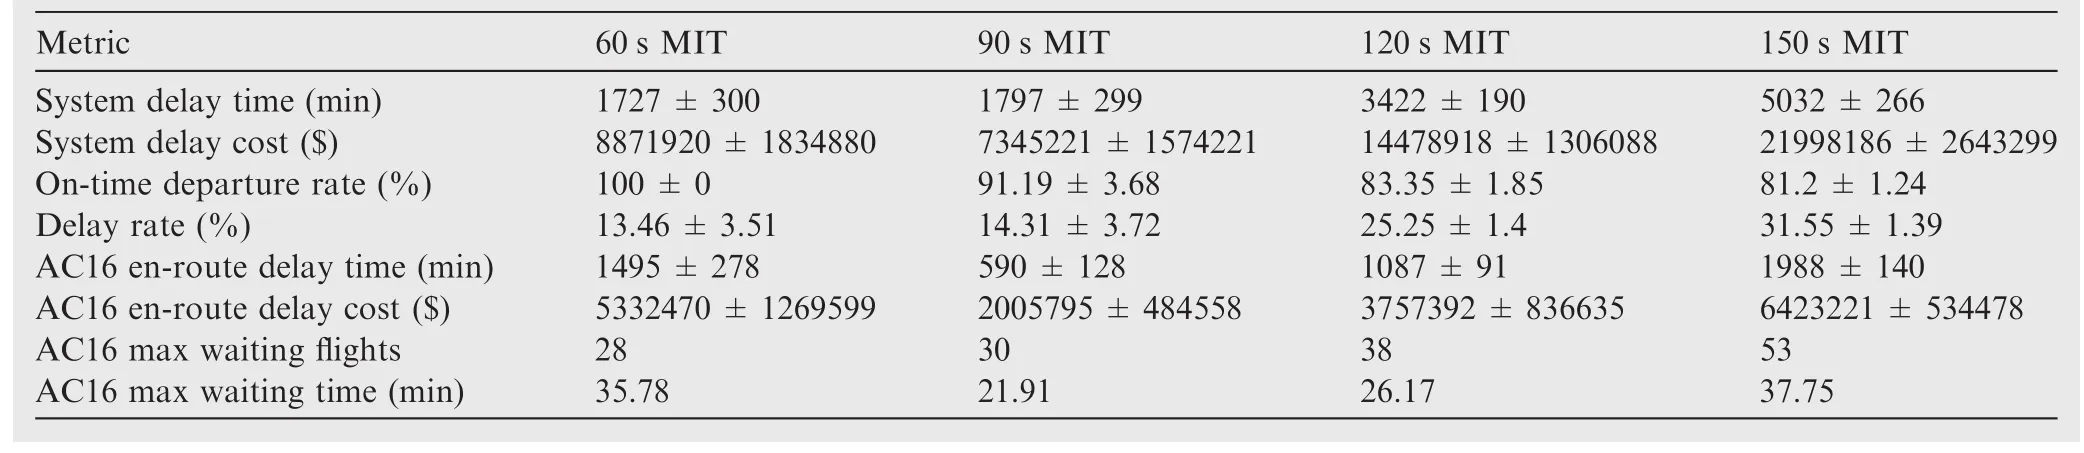
Table 8 Simulation results of Strategy 2.
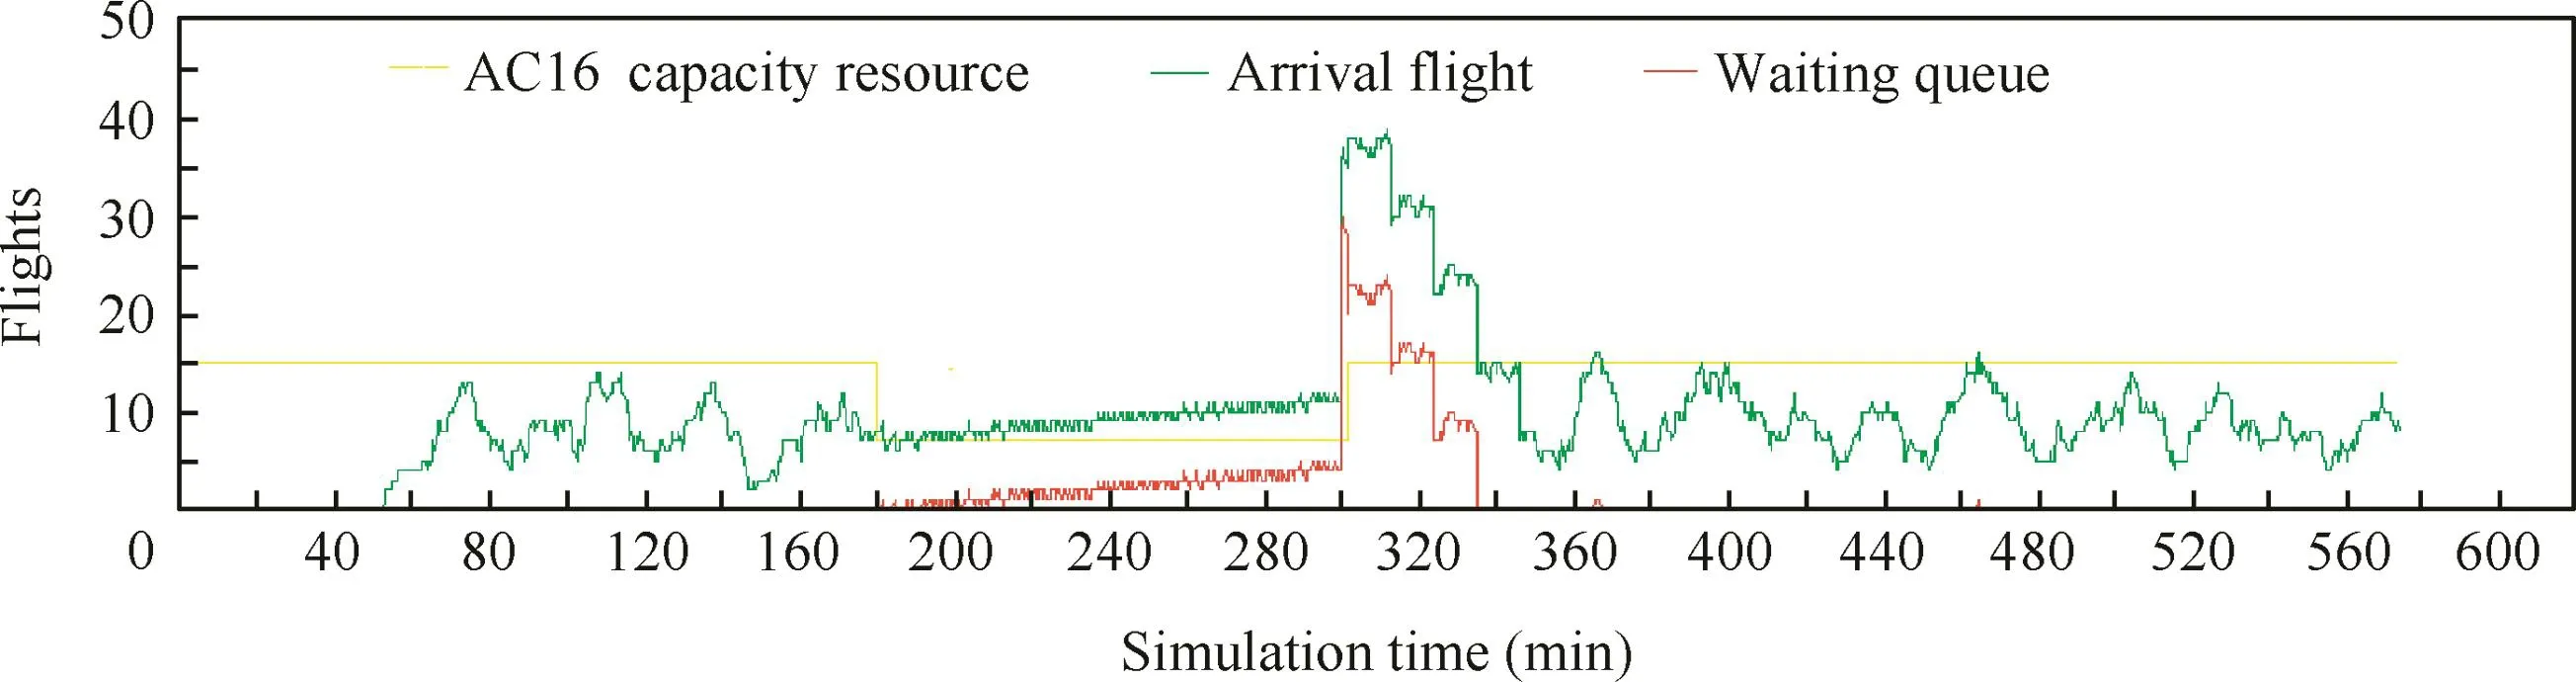
Fig.6 A performance sample of Strategy 2(90 s MIT).
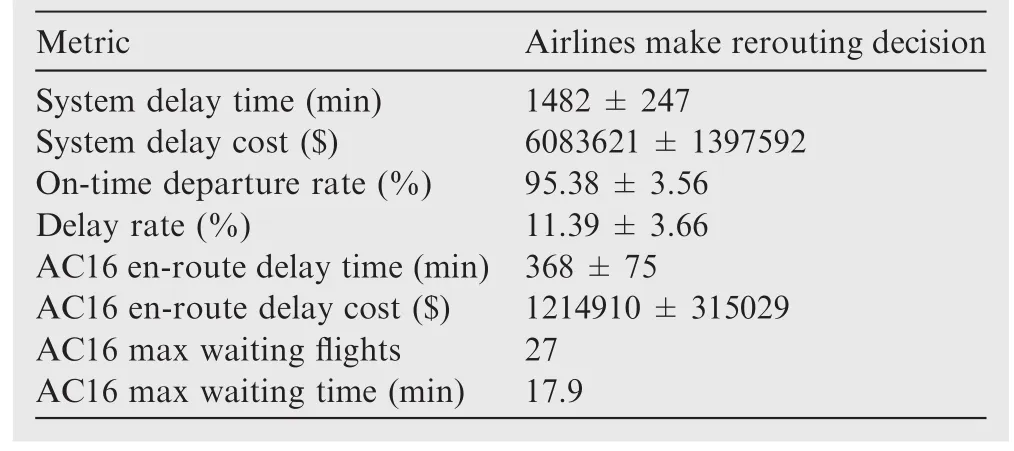
Table 9 Simulation results of Strategy 3.
From the table,we can see that AC16 en-route delay time and cost decrease with the growth of the system delay time and cost.Although the strategy with 20%flights rerouting obtains the minimum system delay time and cost,the congestion problem for AC16 still cannot be alleviated efficiently.The maximum number of waiting flights for AC16 is as high as 18 with 13.8 min of waiting time.From the aspect of safety for AC16,the strategy with 50%flights rerouted is chosen as the suggested design,because the output of the AC16 max waiting flights is minimized and the AC16 max waiting time does not reduce significantly with increased reroute percentage.A performance sample of Strategy 4 with 50%flight rerouting is illustrated in Fig.8.It can be seen that the congestion problem of AC16 can be effectively alleviated during the capacity reduced time.
4.3.5.Strategy 5
For Strategy 5,airlines make the final decision based on ACC introduced MIT and reroute strategy.Airlines can choose to reroute more valuable or less valuable fights by themselves.According to the experimental outputs above,we set the MIT parameter as 90 s with 50%flights rerouting first.Then,the more-valuable-flights rerouted-first(MVRF)and lessvaluable-flights rerouted-first(LVRF)rules are taken by airlines separately to conduct the simulation experiments for Strategy 5.OCBA-PSC algorithm is used to improve the eff iciency of the simulation.20 initial simulation replications are conducted for two designs first,and then 50 additional replications are reallocated according to the outputs.The final allocation scheme is 43 and 47 replications for MVRF and LVRF respectively,and the simulation results for both designs are illustrated in Table 11.
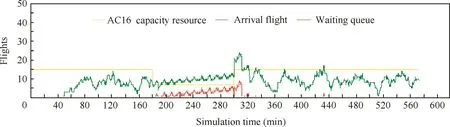
Fig.7 A performance sample of Strategy 3.
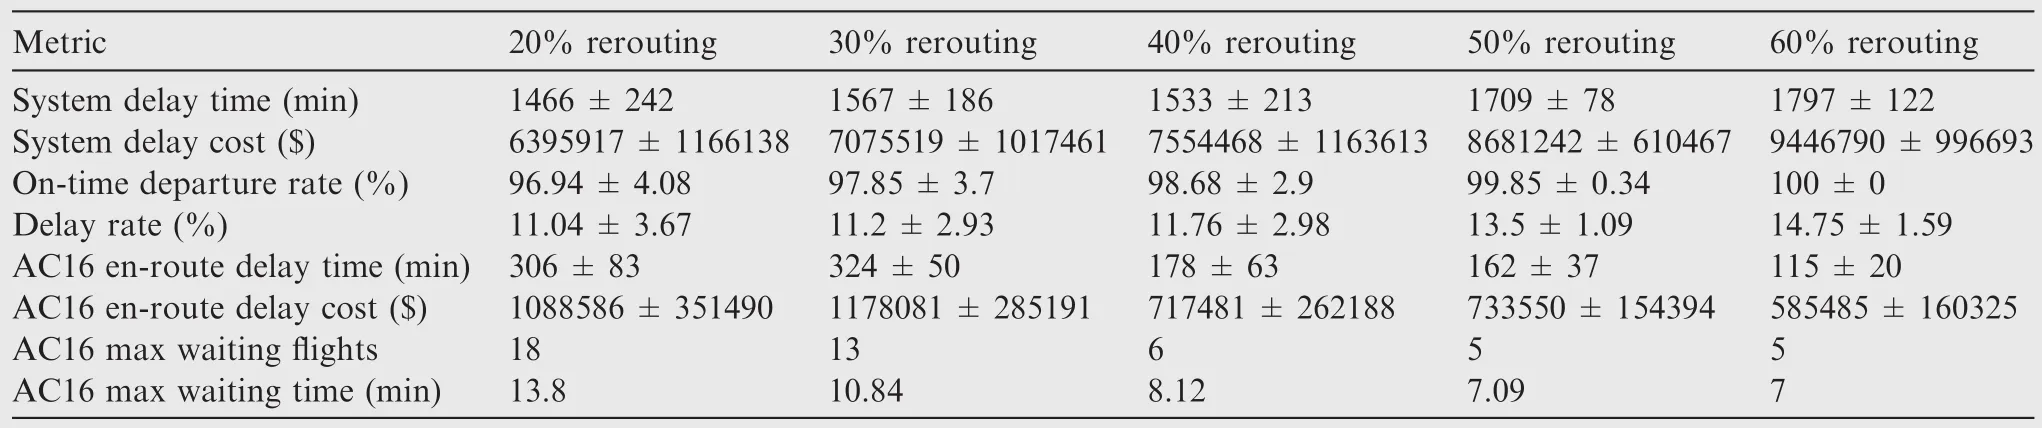
Table 10 Simulation results of Strategy 4.
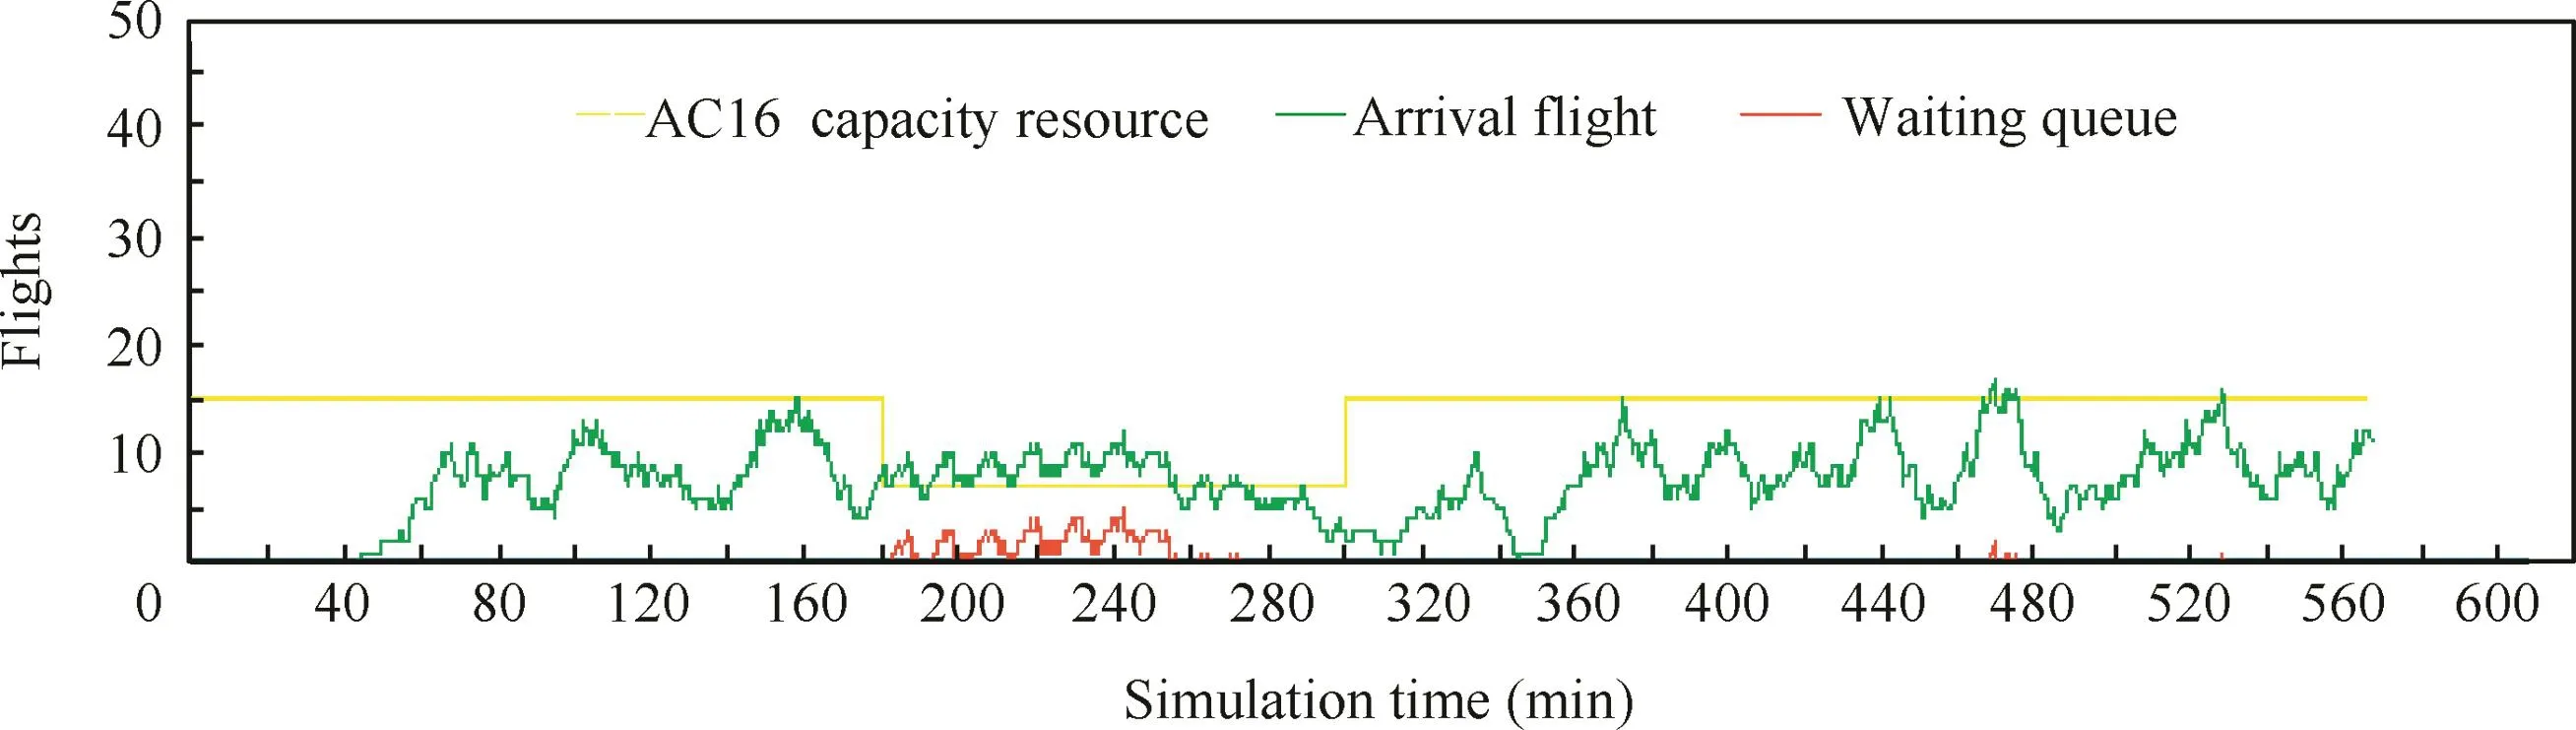
Fig.8 A performance sample of Strategy 4.
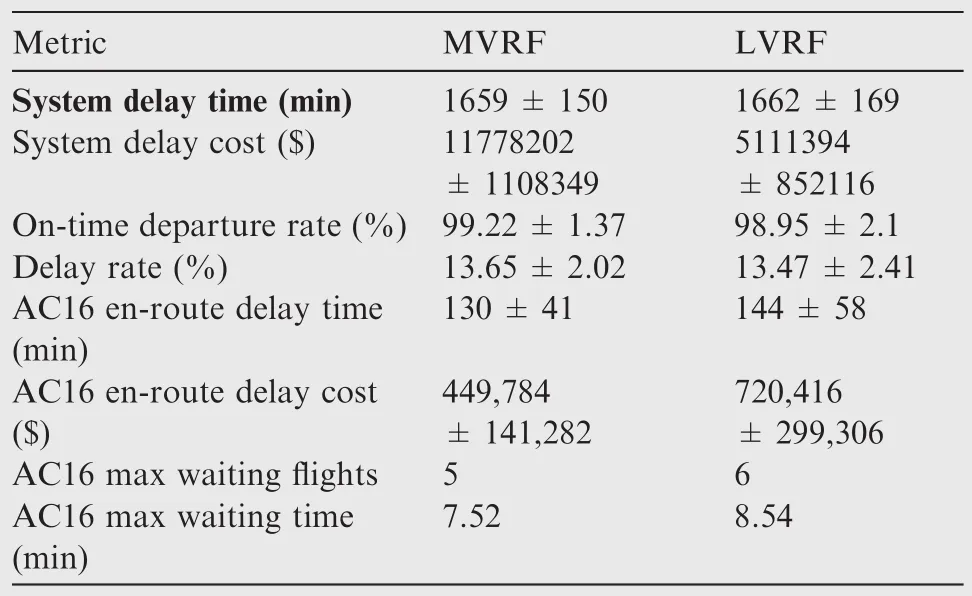
Table 11 Simulation results of Strategy 5.
From the table,we can see that there are significant differences in the system delay cost and AC16 en-route delay cost based on different rerouting rules.Based on the MVRF rules,the AC16 en-route delay cost is only 62%while the system delay cost is more than 2.3 times of those based on LVRF.This could be a trade-off between extra flight time cost and sector congestion delay cost,which implies that the scarce sector capacity resources should be assigned to more valuable flights first.But from the delay time perspective,both the system delay time and AC16 en-route delay time have no obvious difference for two types of rerouting rules.A performance sample of Strategy 5 based on LVRF rule is illustrated in Fig.9.It can be seen that the pattern is similar to the performance sample of Strategy 4,and the congestion problem of AC16 is also effectively alleviated during the capacity reduced time.
Fig.10 shows the relative proportions of metrics for all 5 alternative strategies with suggested parameters.Strategy 1 is set as the baseline and all metrics are displayed with colored poly lines.The horizontal axis represents the type of strategy while the vertical axis represents the relative proportion.From the system perspective,we can see that the system delay time,on-time departure rate,and delay rate metrics fluctuate within a narrow range of 15%and finally level out to the original values.But the system delay cost decreases first to almost 30%of the baseline,and after a rebound it decreases by more than 40%.From the AC16 perspective,all four metric values have some significant reductions.AC16 en-route delay time and cost decrease by about 90%while AC16 max waiting flights and time decrease by about 80%of the baseline.In general,Strategy 5 shows the best performance among all 5 route selection strategies.
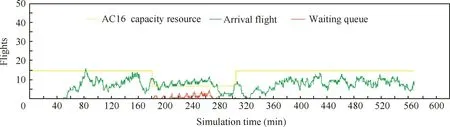
Fig.9 A performance sample of Strategy 5.
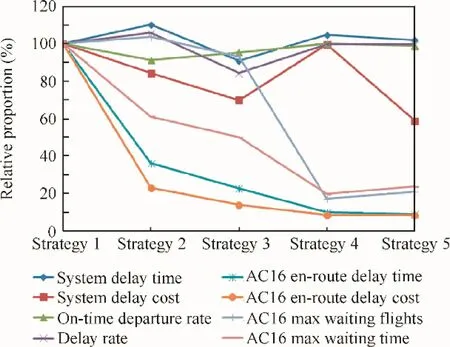
Fig.10 Relative proportions of metrics for 5 alternative strategies.
5.Conclusions
In this paper,a multi-server queueing network with five alternative route selection strategies is examined.We developed a discrete-event simulation model that could represent a congestion airspace consisting of aggregate departure/arrival airports,flight routes,and sectors.Then,given the different perspectives of ACC and airlines,eight system performance metrics and five alternative route selection strategies representing the past,current and proposed air traffic flow management operations were presented.The Monte Carlo method combined with the OCBA simulation optimization technique is employed for assessing the alternative route selection strategies.A case study of upper air routes in Central and Southern China shows that the proposed model can be readily implemented to simulate different kinds of air traffic flow management strategies and to predict the effect of changes on the airspace system.On the basis of a series of experiments and analysis,key insights from the model are as follows:
(1)With no intervention undertaken to respond in advance to the weather,a large number offlights have to wait passively en-route outside the capacity reduced sector.In addition to the safety problem,the controllers’workload and en-route delay cost are two major focuses for ACC and airlines,respectively.
(2)When the time-based MIT strategy is introduced by ACC,the sector performs quite well during the capacity reduced time.Also,some en-route flight delay that is translated into ground delay can reduce both the sector delay time and system delay cost.However,the strategy execution time is a key factor that is easily overlooked.If the strategy is stopped at the sector capacity recovery time,a ‘large spike” representing the simultaneous arrival offlights may still result in severe safety and congestion problems for the sector.
(3)Compared with two previous strategies,the major reason for comprehensive improvement in all metrics under the airlines-led rerouting strategy is the introduction of more alternative route resources.However,the congestion,safety and workload problems for the target sector cannot be solved efficiently by airlines unilaterally.The‘large spike” problem still exists for the controllers’workload and sector congestion is mainly the responsibility of ACC,which is not under the consideration of the airlines.
(4)When the ACC takes the responsibility of rerouting from a global perspective,the ‘large spike” disappears with a signi ficant reduction in both the sector delay time and cost.The safety and controllers’workload problems are alleviated efficiently by this strategy.However,with more flights taking an alternative route,additional flying time may lead to some increases in system delay time and cost.This is because the delay cost is not under the consideration of the ACC,and the flight delay cost is also the trade secret of the airlines.
(5)The collaborative route selection strategy proposed in this paper(Strategy 5)shows the best performance in alleviating the airspace congestion from almost all aspects.The key point is to provide the airlines with rerouting options on the basis of total rerouting control.Based on the Flight Delay Model proposed in this paper,if airlines choose to reroute the less valuable lf ights first,the model shows a signi ficant reduction in system delay cost with no obvious change for system delay time.
Also,the model presented in this paper only considers the basic air traffic congestion scenario.Future work includes extending the single congestion node to multiple congestion nodes with random severe weather durations.The collaboration and competition among different airlines may be another future effort.
Acknowledgments
This study was co-supported by the Natural Science Foundation of Jiangsu Province–China(No.BK20160798)and the Fundamental Research Funds for the Central Universities–China(Nos.3082015NJ20150031,3082014NJ20140017 and 3082014NJ20140015).
1.www.atmb.net.cn [Internet].Chinesecivilaviation developed statistical bulletin.Beijing:Civil Aviation Administration of China;2014.[cited 2015 June 10].Available from:http://www.caac.gov.cn/I1/K3/201507/P020150710519617340682.pdf.
2.Odoni AR.The flow management problem in air traffic controlFlow control of congested networks.Berlin,Heidelberg,New York:Springer;1987.p.269–88.
3.Matos P,Chen B,Ormerod RJ.Optimization models for rerouting air traffic flows in Europe.J Oper Res Soc 2001;52(12):1338–49.
4.Matos P,Powell P.Decision support for flight re-routing in Europe.Decis Support Syst 2003;34(4):397–412.
5.Dell’Olmo P,Lulli G.A new hierarchical architecture for air traffic management:optimization of airway capacity in a free flight scenario.Eur J Oper Res 2003;144(1):179–93.
6.Bertsimas D,Patterson S.The air traffic flow management problem with en-route capacities.Oper Res 1998;46(3):406–22.
7.Bertsimas D,Patterson S.The traffic flow management problem in air traffic control:a dynamic network flow approach.Transp Sci 2000;34(3):239–55.
8.Kotnyek B,Richetta O.Equitable models for the stochastic ground-holding problem under collaborative decision making.Transp Sci 2006;40(2):133–46.
9.Lulli G,Odoni A.The European air traffic flow management problem.Transp Sci 2007;41(4):431–43.
10.Agustin A,Alonso-Ayuso A,Escudero LF,Pizarro C.On air traffic flow management with re-routing,part I:deterministic case.Eur J Oper Res 2012;2012(219):156–66.
11.Agustin A,Alonso-Ayuso A,Escudero L,et al.On air traffic flow management with re-routing,part II:stochastic case.Eur J Oper Res 2012;2012(219):156–66.
12.Sherali H,Hill J,Trani A.Integrating slot exchange,safety,capacity,and equity mechanisms within an airspace flow program.Transp Sci 2011;45(2):271–84.
13.Campbell K,Cooper W,Greenbaum D,Wojcik L.Modeling distributed human decision-making in traffic flow management operations.Proceedings of the 3rd USA/Europe air traffic management Ramp;D seminar;2000 June 13–16;Napoli,Italy.Reston:AIAA;2000.p.227–37.
14.Wanke C,Zobell S,Song L.Probabilistic airspace congestion management.Proceedings of the 5th AIAA aviation,technology,integration,and operations conference;2005 September 26–28;Virginia,USA.Reston:AIAA;2005.p.1–13.
15.Wolfe S,Enomoto F,Jarvis PA,Sierhuis M.Comparing route selection strategies in collaborative traffic flow management.Proceedings of the 2007 IEEE/WIC/ACM international conference on intelligent agent technology;2007 November 2–5;California,USA.Piscataway(NJ):IEEE Press;2007.p.59–62.
16.Ramamoorthy K,Boisvert B,Hunter G.A real-time probabilistic traffic flow management evaluation tool.Proceedings of the 25th digital avionics systems conference;2006 October 15–18;Oregon,USA.Piscataway(NJ):IEEE Press;2006.p.1–13.
17.Tumer K,Agogino A.Distributed agent-based air traffic flow management.Proceedings of the 2007 international conference on autonomous agents and multiagent systems;2007 May 14–18;Hawaii,USA.New York:ACM;2007.p.342–9.
18.Agogino A,Tumer K.A multi-agent approach to managing air traffic flow.Auton Agent Multi-Agent Syst 2012;24(1):1–25.
19.Calderon-Meza G,Sherry L.Adaptive agents in NAS-wide simulations:a case-study of CTOP and SWIM.Proceedings of the 2011 integrated communications,navigation and surveillance con-ference(ICNS);2011 May 10–12;Virginia,USA.Piscataway(NJ):IEEE Press;2011.p.1–10.
20.www.atmb.net.cn[Internet].Rules of air traffic management of CAAC.Beijing:Civil Aviation Administration of China;2014.[cited 2015 August 1].Available from:http://www.caac.gov.cn/B1/B6/200711/P020071107570551345469.pdf.
21.Wolfe S,Jarvis P,Enomoto F,Sierhuis M,et al.A multi-agent simulation of collaborative air traffic flow management.In:Klingerk K,Snavely J,Coulson C,editors.Multi-agent systems fortrafficandtransportationengineering.Pennsylvania:Information Science Reference;2009.p.357–81.
22.www.faa.gov[Internet].Traffic flow management system(TFMS)collaborative trajectory options program(CTOP)interface control document(ICD)for the traffic flow management modernization program.Washington:D.C.:Federal Aviation Administration.[cited 2014 May 1].Available from:http://cdm.fly.faa.gov/wp/content/list_yo_files_user_folders/cdm_editor/cdm_data_format_info/R9%20CTOP%20ICD%20v3.3%20%28without%20track%20changes%29.pdf.
23.Xu J,Huang E,Chen CH,Lee LH.Simulation optimization:a review and exploration in the new era of cloud computing and big data.Asia-Pacif J Oper Res 2015;32(3),1550019-1-34.
24.Brantley MW,Lee LH,Chen CH,Xu J.An efficient simulation budget allocation method incorporating regression for partitioned domains.Automatica 2014;50(5):1391–400.
25.Chen CH,Lee LH.Stochastic simulation optimization:an optimal computing budget allocation.New Jersey:World Scientific;2010,p.29–64.
26.Peng Y,Chen CH,Fu MC,Hu JQ.Efficient simulation resource sharing and allocation for selecting the best.IEEE Trans Autom Sci Eng 2013;58(4):1017–23.
27.Horng SC,Lin SY,Lee LH,Chen CH.Memetic algorithm for real-time combinatorial stochastic simulation optimization problems with performance analysis.IEEE Trans Autom Control 2013;43(5):1495–509.
28.Chen W,Gao S,Chen CH,Shi L.An optimal sample allocation strategy for partition-based random search.IEEE Trans Cybernet 2014;11(1):177–86.
29.Kelton W,Sadowski R,Sturrock D.Simulation with arena.Boston:McGraw-Hill Higher Education;2004.p.117–265.
YE Bojia received the M.S.and Ph.D.degrees in transportation planning and management from Nanjing University of Aeronautics and Astronautics in 2008 and 2013 respectively,and then became an assistant professor there.He visited the Center for Air Transportation Systems Research at George Mason University from 2010 to 2012.His area of research includes air traffic flow management,multi-agent system modeling and simulation.
Lance Sherry is an associate professor in the System Engineering and Operations Research Department at George Mason University,and is director of the Center for Air Transportation Systems Research at George Mason University.He has over 30 years’experience in the aviation industry including design/development/certification of avionics,flight test,program management,strategic planning and investment analysis.His research interests are in analysis of stochastic network systems with applications to air transportation systems.
Chen Chun-Hung is a professor of George Mason University.Dr.Chen has led research projects in stochastic simulation and optimization,systems design under uncertainty,and air traffic management,which are sponsored by NSF,FAA,and NASA.He is serving on the editorial boards of IEEE Transactions on Automatic Control,IIE Transactions,Journal of Simulation Modeling Practice and Theory,and International Journal of Simulation and Process Modeling.He received his Ph.D.degree from Harvard University in 1994.
Tian Yong received the M.S.and Ph.D.degrees in transportation planning and management from Nanjing University of Aeronautics and Astronautics in 2000 and 2009 respectively,and then became an associate professor there.He visited the Center for Air Transportation Systems Research at George Mason University from 2013 to 2014.His area of research includes air traffic flow management and flight performance.
8 January 2016;revised 25 March 2016;accepted 13 June 2016
Available online 21 October 2016
Air traffic control;
Decision support systems;
Discrete-event simulation;
Monte Carlo methods;
OCBA
Ⓒ2016 Chinese Society of Aeronautics and Astronautics.Production and hosting by Elsevier Ltd.This is anopenaccessarticleundertheCCBY-NC-NDlicense(http://creativecommons.org/licenses/by-nc-nd/4.0/).
*Corresponding author.Tel.:+86 25 84891289.
E-mail addresses:bye@nuaa.edu.cn(B.Ye),tianyong@nuaa.edu.cn(Y.Tian).
Peer review under responsibility of Editorial Committee of CJA.
Production and hosting by Elsevier
http://dx.doi.org/10.1016/j.cja.2016.09.012
1000-9361Ⓒ2016 Chinese Society of Aeronautics and Astronautics.Production and hosting by Elsevier Ltd.
This is an open access article under the CC BY-NC-ND license(http://creativecommons.org/licenses/by-nc-nd/4.0/).
杂志排行
CHINESE JOURNAL OF AERONAUTICS的其它文章
- Analysis of swirling flow eff ects on the characteristics of unsteady hot-streak migration
- Implicit discontinuous Galerkin method on agglomerated high-order grids for 3D simulations
- Design and implementation of rigid-flexible coupling for a half-flexible single jack nozzle
- Dynamic simulation of aerial towed decoy system based on tension recurrence algorithm
- A quasi-one-dimensional model for hypersonic reactive flow along the stagnation streamline
- An experimental investigation on static directional stability