Analysis of Mechanical Response for Twisted Mooring Chains
2014-03-16LIUGangLIUQichengSUNJiajunHUANGYi
LIU Gang,LIU Qi-cheng,SUN Jia-jun,HUANG Yi
(School of Naval Architecture,Faculty of Vehicle Engineering and Mechanics,Dalian University of Technology,Dalian 116024,China)
1 Introduction
Chain has been commonly used in mooring applications for offshore oil platforms.It is usually combined with wire or fiber cable as part of a mooring system.The high strength and high density of anchor chain are employed at the interface with the hull and in the touchdown zone along the sea bed.It is known that chains have the character of self-balance of torque,that is,the straight mooring chain can not twist when the axial tensile load is only applied.However,the wire and fiber cable do not have the same character,so that torque is always generated when the chain is combined with wire or fiber cable.In recent years,industry has paid more attention to the problem that may be caused by allowing components to twist during installation.But even so,the twist may be unavoidable,and the response of the system to such effects needs to be understood.Fig.1 shows a stud-link chain with an approximately 30°twist per link[1].
The behavior of chain has been investigated by many researchers considering various aspects of strength and fatigue performance[2-5],but very little work considered the twist of chain.Hiroshima and Sawa[6]have studied the effect on the strength of twist in a chain that is subject to an impact load,but the torque in the chain itself was not discussed.Hobbs and Ridge[1,7]have addressed the issues and considerations relevant to torque in mooring chain.A frictionless theory was introduced that predicts the resultant torques and gap in chain links as functions of angle of twist.Experimental results were also presented on both stud-less and stud-link chains.Torsional data are given in both constant twist and constant load forms,as well as considering the gap between the links.It is concluded that even if with no torque,the maximum principal stress of twisted chains can appear near damaged area caused by original test loads.For this reason,tensile strength and fatigue resistance both can be affected by the torsional condition.
In this paper,nonlinear finite element(FE)analyses of stud-less and stud-link chains using AYSYS software are performed to investigate stress distribution and the torsional behavior of the mooring chain.Relationship between torsional angle and non-dimensionalized torque is proposed based on FE results.The FE results are also compared with theoretical predictions of idea frictionless geometric analysis to verify correctness of the nonlinear numerical simulation.

Fig.1 A stud-link chain with an approximately 30°twist per link[1]
2 Geometrical frictionless theory
According to the function,the chain can be divided into two types:stud-link chain and stud-less chain.Fig.2 shows the size standard of the stud-less and stud-link chains.D is chain’s parent bar diameter.The stud-link chain has stronger bearing capacity,but its weight and cost will be higher when the material and the diameter are the same.

Fig.2 Size standard of stud-less and stud-link chains
Hobbs and Ridge[1]have proposed an idealized geometric model for discussing the changes in behavior of contact region of the chain links under the tensional and torsional loads.Initially,two adjacent links are positively in orthogonal state,and the contact patch is nominally circular.As the links turn relative to each other,the contact patch initially becomes from circular to oval,and then separates into two distinct patches.These two patches move up shoulders of the links as turn continues to grow,and a gap appears between the links at the initial contact point as shown in Fig.1.As the turn further increasing,the patches will continue to move up,eventually producing a lockup situation.

Fig.3 Model of the interaction between the two stud-less chain links
Contact between two identical half circles is used to simulate the interaction between adjacent links.As shown in Fig.3,the chain’s parent bar radius and the torus center-line radius are expressed in r and R,respectively.W represents the width of chain.
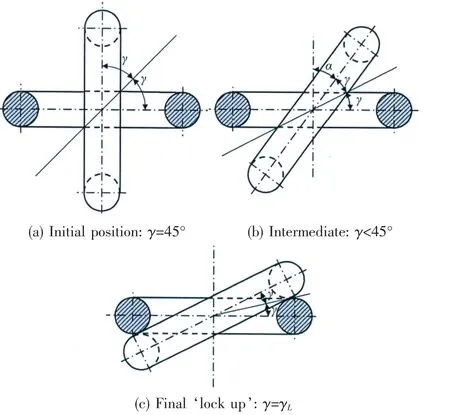
Fig.4 The twist process between two adjacent links
Fig.4 shows a sequence of views along the axis of the chain as the two half links are twisted relative to each other.In each case,the acute angle γ to a mid-plane between the links is identified.Fig.5 and Fig.6 indicate two coordinate systems used in this theory.The angles θ and φ shown in Fig.5 define a point P on the surface:


Fig.5 Definition of the X,Y,Z coordinate system(Y into page)
These coordinates can be transformed into a second set,x,y,z,defined with respect to the mid-plane of Fig.4,as shown in Fig.6.

The cross-hatched area in Fig.6 represents the plane y=0.By symmetry,this plane must contain the contact point or points between the two links.For the angle γ close to 45°,the area is roughly elliptical.However,as the links turn and γ decreases,the shape of the section y=0 becomes kidney shaped as sketched in Fig.6.
For any value of γ,the torque T is then given in terms of the axial load P by

The torque T and gap per link δ can be calculated by Eq.3 and Eq.4 under different torsional angles.Fig.7 and Fig.8 show non-dimensionalized torque T/PD and non-dimensionalized gap per link δ/D,respectively,as functions of γ.The dashed lines stand for the stud-less chain link(W/D=3.35)and the solid lines stand for the stud-link chain(W/D=3.6).

Fig.7 Non-dimensionalized torque(T/PD)

Fig.8 Non-dimensionalized gap per link(δ/D)
Both T/PD and δ/D have a strong nonlinear relationship with the angle γ.When the chain links are close to an extreme twisted state,T/PD and δ/D can increase rapidly while γ has a small decrease.Due to the dimensionless processing,the curve trend depends on the chain types distinguished by W/D,rather than the chain diameter D and axial load P.
3 Nonlinear FE analysis of chains
The stud-less and stud-link chains shown in Fig.2 are numerically analyzed using ANSYS software.The diameters of the stud-less and stud-link chains are 92 mm and 96 mm,respectively.The R4 grade steel of the chains is selected in the analysis.According to the mechanical property requirements for chain cables in DNV rules[8],yield limit of chain’s material is given as 600 MPa.Young’s modulus E=2.07×10⁵MPa,and Poisson’s ratio v=0.29.FE models,so that loading can be applied on the central point of the rigid beams of MPC184.All degrees at the other end section of the models are constraint.Besides,considering central symmetry of the chains under all rotations about the central axis,the displacements perpendicular to the stretching direction on the central axis are also constraint.

Fig.9 shows FE models of the chains using 20-node solid element SOLID95.8-node contact element CONTA173 and target segment element TARGE170 are used to simulate the surface-to-surface contact between adjacent links.The augmented Lagrange method is selected in contact algorithm and the mechanical contact between the links has been defined with a friction coefficient of 0.3.Multipoint constraint element MPC184 is used at one end section of the
Fig.10(a)shows stress distribution of the stud-less chain which is under low axial load of 200 kN but at an extreme level of twist(α=33°).As shown in Fig.4,α is the twist per link.By geometrical relationship,we have

With the rotation of the chain,the contact area between the adjacent links changes from one part to two separate parts,and a large gap also appears between the links.Although the axial load of 200 kN is small for the stud-less chain with 92 mm diameter,the Von Mises stress at the contact region reaches more than 500 MPa when the chain is at the extreme level of twist.The maximum stress of the chain is 608 MPa and moves to the shoulders of the link with the contact areas.The stress of the straight bar varies from 300 MPa to 400 MPa,and outside of the straight bar has higher stress distribution compared with inside of the bar.The outside of the crown has lower stress distribution less than 200 MPa.
Fig.10(b)shows the stress distribution of the stud-less chain at a lower level of twist(α=15°)but under high axial load of 1 400 kN.Compared with the extreme twist state shown in Fig.10(a),the contact regions are closer to each other and the gap between the links is smaller.Although the torsional degree is not high,the Von Mises stress at the contact region reaches more than 500 MPa because the axial load is high.The maximum stress of the chain is 619 MPa and also appears on the shoulders of the link.The stress of the straight bar varies from 200 MPa to 300 MPa,and the outside of the straight bar has higher stress distribution compared with the inside of the bar.The high axial load makes high stress level which is more than 300 MPa in crown region.
Fig.11 shows the stress distributions of the stud-link chain under the same loading conditions as the stud-less link.The calculated results indicate that the stud-link chain has similar mechanical properties to the stud-less chain.

Fig.10 Von Mises stress distribution of the stud-less chain

Fig.11 Von Mises stress distribution of the stud-link chain
The contact status in ANSYS software is divided into four kinds which are explained in Tab.1.

Tab.1 Four kinds of contact status in ANSYS software

Fig.12 Contact stress distributions of the stud-less chain under two loading conditions
Fig.12 shows the contact stress distributions of the stud-less chain under the two loading conditions discussed above.When the chain is under low axial load of 200 kN but at an extreme level of twist,the contact region appears to be two comparative tenuous banding,and the contact region only has the ‘sliding’ status but not‘sticking’ status(see Fig.12(a)).The region of low stress between the two sliding areas represents the ‘far open’ status because of a large gap between the adjacent links.So an extreme level of twist can make the contact position move far away to each other.As shown in Fig12(b),when the chain is at an lower level of twist but under high axial load of 1 400 kN,the shape of the contact region is typical half ring and two contact points show the ‘sticking’ status.The region between the two contact points represents the ‘near contact’ status,that is,a small gap appears between the adjacent links.
4 Torsional response analysis of chains
Numerical results show that high level of twist state under low axial load,or low level of twist state under high axial load both can generate a quite high potential failure stress in the chain links.It indicates that the stress in the chain is not only related to the axial load,but also has a relationship with torsion degree.In this paper,the torsional responses of the chains(the non-dimensionalized torque T/PD and the non-dimensionalized gap per link δ/D)under different tension and torsion are investigated by using FE results.
In FE analysis,the chain is tensioned to a given load which is then maintained as the chain is twisted.The loading procedure is described as follows:(1)Apply a given axial load on the rigid section of the chain to simulate the tension;(2)Apply a series of angular displacements on the rigid section of the chain to simulate the twist,and the maximum twist angle per link α=19°;(3)Make the rotation angle of the chain to zero to simulate the unload process of the torque.Three axial loading cases,200 kN,800 kN and 1 400 kN,are calculated in FE analysis.
Fig.13 shows the calculated non-dimensionalized torque T/PD as a function of twist angle α for the stud-less and stud-link chains.The dot-dash curve denotes the theoretical predictions(see Fig.7).The solid curves denote the twisting-up(twist angle increases)of the chain and the dash curves the un-twisting.We can see that the twisting-up curves are in good agreement with the theoretical prediction curve,while the un-twisting curves are generally lower than that.During the process of twisting-up,the calculated non-dimensionalized torque T/PD increases gradually with the improvement of the axial load,namely the increase of axial tension decreases the torsional rigidity of the chain.But in the process of un-twisting,the results of T/PD became smaller with the improvement of the axial load,namely the increase of axial tension enhances the torsional rigidity of the chain.It also shows that the numerical results of T/PD under the low axial tension are more consistent with the theoretical predictions.

Fig.13 Non-dimensionalized torque(T/PD)as a function of twist angle(α)for chains
Curves of the non-dimensionalized gap per link δ/D as a function of twist angle α for the stud-less and stud-link chains are shown in Fig.14.The dot-dash curve denotes the theoretical predictions of the gap(see Fig.8).The solid curves also denote the twisting-up of the chain and the dash curves the un-twisting.For a given axial load,the twisting-up curve and the untwisting curve are almost coincident.Compared with the theoretical predictions,the numerical results of the gap are smaller.The reason is that the friction effect of the chain is not considered in the theoretical model.As a result,when the gap appears the minimum twist angle of the theoretical model is a little smaller than that of numerical analysis.In addition,the calculated non-dimensionalized gap per link decreases gradually with the improvement of the axial load,which also indicates the friction effect on the torsional response of the chain.

Fig.14 Non-dimensionalized gap per link(δ/D)as a function of twist angle(α)for chains
For considering the friction effect,the following upper bound regression formulae are derived,based on the FE results,for the torque generated as twist increases under constant axial load in the stud-less and stud-link chains:

where 0°<α<20°,0 Due to the same W/D and the non-dimensionalized processing,Eq.6 and Eq.7 are applicable to chains with other diameters.The formulas have the guiding significance for predicting the torque of the chain under the middle and low level twist. Torsional behavior of mooring chains under combination of tensional and torsional loads is numerically analyzed,considering the material and contact nonlinearity in the FE models.From the FE results of the twisted chains,the following conclusions can be drawn: (1)High level of twist state under low axial load,or low level of twist state under high axial load both can generate a quite high potential failure stress in the chain links. (2)During twist of chain,the separation of contact region can make the stress level of the contact region decrease,but the stress level of the whole chain is increased and the maximum stress appears in the contact region. (3)Both the non-dimensionalized torque T/PD and non-dimensionalized gap per link δ/D have a nonlinear relationship with the twist angle α.When the chain links are close to an extreme twisted state,both T/PD and δ/D increase rapidly. (4)Based on a large number of numerical simulation data which can consider the friction effect,the upper bound regression formulae are derived for predicting the torque of chains when the torsional angle and the axial load are given. [1]Hobbs R E,Ridge I M L.Torque in mooring chain.Part Ι:Background and theory[J].Strain Analysis,2005,40(7):703-713. [2]Lassen T,Syvertsen K.Fatigue reliability and lifecycle cost analysis for mooring chains[J].International Journal of Offshore and Polar Engineering,1997,7(2):135-140. [3]Stiff J J,Smith D W,Casey N F.Fatigue of mooring chain in air and water-results and analysis[C]//In Offshore Technology Conference.Houston,Texas,1996:291-297. [4]Pacheco P M C L,Kenedi P P,Jorge J C F.Elastoplastic analysis of the residual stress in chain links[C]//In Proceedings of the 21st International Conference on Offshore Mechanics and Arctic Engineering(OMAE’02).23-28 June 2002.Oslo,Norway,2002:39-46. [5]Lassen T,Storvoll E.Fatigue life prediction of mooring chains subjected to tension and out of plane bending[C]//Proceedings of OMAE 2009,May 31-June 5,2009.Honolulu,Hawaii,2009.(OMAE2009-79253) [6]Hiroshima T,Sawa T.Three-dimensional elastoplastic finite-element analysis of link chains in chain hoist subjected to combined loads of torsion and impact tension[J].Transactions of the Japan Society of Mechanical Engineers,Part A,1995,61(591):2442-2449. [7]Ridge I M L,Hobbs R E.Torque in mooring chain.Part II:Experimental investigation[J].Strain Analysis,2005,40(7):715-728. [8]Offshore Standard DNV-OS-E301.Position Mooring[S].Det Norske Veritas,Hovik,Norway,2010.5 Conclusions
杂志排行
船舶力学的其它文章
- Weakly Compressible Moving Particle Semi-Implicit Method(WC-MPS)with Large-Eddy Simulation(LES)Turbulence Model for Numerical Simulation of Dam-break Flows
- Application of Optical System QTM in the Towing Tank Tests for Two Ship Models
- Three-dimensional Numerical Simulation of Cryogenic Cavitating Flows of Liquid Nitrogen Around Hydrofoil
- Numerical Solution for Ship with Forward Speed Based on Transient Green Function Method
- Application of the Improved Collaborative Optimization on Ships’Conceptual Design
- Responses of Longitudinal and Transversal Nonlinear Coupling Vibration of Ship Shafting