Design of Parallel Electrical Resistance Tomography System for Measuring Multiphase Flow*
2012-10-31DONGFeng董峰XUCong许聪ZHANGZhiqiang张志强andRENShangjie任尚杰
DONG Feng (董峰)**, XU Cong (许聪), ZHANG Zhiqiang (张志强) and REN Shangjie (任尚杰)
Tianjin Key Laboratory of Process Measurement and Control, School of Electrical Engineering and Automation,Tianjin University, Tianjin 300072, China
Design of Parallel Electrical Resistance Tomography System for Measuring Multiphase Flow*
DONG Feng (董峰)**, XU Cong (许聪), ZHANG Zhiqiang (张志强) and REN Shangjie (任尚杰)
Tianjin Key Laboratory of Process Measurement and Control, School of Electrical Engineering and Automation,Tianjin University, Tianjin 300072, China
ERT (electrical resistance tomography) is effective method for visualization of multiphase flows, offering some advantages of rapid response and low cost, so as to explore the transient hydrodynamics. Aiming at this target, a fully programmable and reconfigurable FPGA (field programmable gate array)-based Compact PCI (peripheral component interconnect) bus linked sixteen-channel ERT system has been presented. The data acquisition system is carefully designed with function modules of signal generator module; Compact PCI transmission module and data processing module (including data sampling, filtering and demodulating). The processing module incorporates a powerful FPGA with Compact PCI bus for communication, and the measurement process management is conducted in FPGA. Image reconstruction algorithms with different speed and accuracy are also coded for this system. The system has been demonstrated in real time (1400 frames per second for 50 kHz excitation) with signal-noise-ratio above 62 dB and repeatability error below 0.7%. Static experiments have been conducted and the images manifested good resolution relative to the actual object distribution. The parallel ERT system has provided alternative experimental platform for the multiphase flow measurements by the dynamic experiments in terms of concentration and velocity.
electrical resistance tomography, data acquisition, compact peripheral component interconnect, field programmable gate array, digital filter, digital demodulation
1 INTRODUCTION
Multiphase flow processes exist commonly in the petroleum, chemical, metallurgical, power, energy and other industrial fields [1, 2]. Recently online visualization and control of multiphase fluid flows are highly desirable due to the difficulties in probing the complex fluid dynamics [3, 4], access to hazardous materials and radioactive environments, as well as opaqueness of devices and materials in processing [5-8]. The parameter measurement in multiphase fluid flow is very difficult, as the phase fraction and speed distribution change severely on time and space domains under different flow regimes [9]. The measurement requires high robustness, high speed and large amount of internal real-time process information, which are rarely obtained by the traditional methods.
As a non-radiant and unperturbed 2-dimension(2D)/3-dimension (3D) boundary technique, Electrical Resistance Tomography (ERT) has wide application prospect in multiphase flows with conductive continuous phase flow. ERT is to achieve visual detection through boundary sensors array to obtain the real-time distribution of electric materials with a contrast in conductivity. ERT is based on the fact that different medium have different electrical properties. ERT usually works on the way of current exciting and voltage measurement. The sensing field was built by applying the current to a pair of electrodes. As the distribution of conductivity changes, the distribution of current field changes, then the potential field, at last the boundary voltage measurement changes. Hence, the medium distribution can be identified if the conductivity distribution of the sensing field is acquired.
A typical ERT system is consisted of a sensor array equally spaced around the object periphery being imaged, an effective data acquisition system and a computer. Much effort has been made in developing the ERT system for industrial process. In recent years,the high-performance Electrical Impedance Tomography (EIT) system developed at the University of Leeds [10, 11], the new, commercially manufactured EIT instrument from the University of Manchester[12, 13], an ERT system for 3D data acquisition developed at the University of Cape Town [14, 15], a PCI(peripheral component interconnect) Extensions for Instrumentation (PXI)-based EIT system developed at the University of Kuopio [16], a new ERT system based on the bi-directional current pulse technique from Zhejiang University [17, 18]; a dual-mode ERT and Electrical Capacitance Tomography (ECT) system[19, 20] have been reported, which apply currentrejection to the adjacent pairs of electrodes at the boundary and measure the resulting voltages. However, for obtaining accurate information reflecting the sensing field, the data acquisition system must eliminate the influence from the transient time of AC (analog circuit) coupling interface, signal demodulation and data transmission. For solving these problems and enhancing the frame speed, many high performance data acquisition systems have been developed for online measurement.
In this paper, a latest parallel ERT system for laboratory-used application in multiphase flow measurement is described. The system is designed for solving some key problems in ERT application, such as the acquisition speed, the resolution and present image in real time, the stability, flexibility, and expandability.The aim of the system is to determine and ultimately visualize the oil/gas/water flows in an online and realtime manner. By the use of this technique, the flow pattern can be observed and the relative data can be obtained, so as to understand the flow mechanism, interaction between phases, and control the flow processes.
2 SYSTEM DESCRIPTIONS
The ERT system described in this paper, as shown in Fig. 1, is consisted of
(1) A sensor array equally spaced around the object periphery being imaged, 16 rectangular electrodes were used, which were evenly spaced along the circumference of a circular object;
(2) An effective data acquisition system based on the Compact Peripheral Component Interconnect(Compact PCI) bus, consisted of signal generator,signal conditioning unit and a 16-channel data acquisition card, which are all controlled by Field Programmable Gate Array (FPGA);
(3) An industrial personal computer (IPC) with software integrated the information processing, which includes the visualization and information extraction,and the interaction with the data acquisition system.
The main feature of this ERT system is the flexibility derived through the application of FPGA chips in each card to provide a Compact PCI bus interface,all digital functions (including digital filtering and digital demodulation) and data acquisition management. Using the FPGA on-chip memory and Compact PCI bus interface, the whole data acquisition system can be programmed before each trial by downloading measurement parameters from the computer to the FPGA, which enables the excitation frequency, excitation patterns, the measurement channel sequence and the gain of each measurement channel to be fully determined in real time.
2.1 Sensor array
The design of a sensor array involves choosing the number of electrodes, the size of electrodes, and the materials used to construct the sensor. The material can be decided by the electrical and chemical characteristics. In this system, the rectangular titanium electrodes with a width of 10 mm and a height of 30 mm were adopted, the width could reduce the contact resistance between the electrode and the medium effectively, and the height could improve the distribution of sensitivity field on the verge of flat field. The selection of the number of electrodes is a trade-off between image resolution and system complexity.Normally, more electrodes can increase spatial resolution of the system due to the increased number of measurements. Due to the studies of the forerunners,more electrodes would reduce the distance between two adjacent electrodes, which could cause more current flow through the near field and lower sensitivity to the centre. What’s more, more electrodes would raise the requirements of hardware measurements and influence the real-time performance of the system.Sixteen rectangular electrodes were used in the system,which were evenly spaced along the circumference of a 125 mm circular object area being imaged.
The sensor follows a data acquiring procedure to collect boundary voltages. A constant current of low frequency is applied to an adjacent pair of electrodes and the voltages are measured from other 13 pairs of adjacent electrodes. The exciting current is then switched to the next pair and the voltage measurements are repeated. This procedure yields n(n−3)measurements for a n-electrode sensor, which means 208 data for the 16-electrode sensor.

Figure 1 Structure of the ERT system

Figure 2 Structure of the parallel data acquisition system
2.2 Hardware modules
This system is aimed to measure and visualize the process of two/multiphase flow with conductive continuous phase flow. The multiphase flow is difficult to detect the parameters because of the complexity and the time-varying nature. ERT, as a non-radiant and unperturbed technique, provides an effective way of monitoring and online measurements for multiphase fluid. However, for more accurate information reflecting the sensing field, the data acquisition system must eliminate the influence from the transient time of AC coupling interface, signal demodulation and data transmission. For solving these problems mentioned above and taking the strategy flexibility,frame rates, and the signal-noise-ratio (SNR) of the system as the evaluation index into consideration[21, 22], a system based on industrial standard bus is designed as a 16-channel parallel data acquisition system for online and realtime flow measurement, as shown in Fig. 2, where FPGA and Compact PCI are adopted as the core components.
The system consists of a signal generator card, a signal conditioning board and a data acquisition card.There are four important function modules in this data acquisition system: the signal generator, the digital Finite Impulse Response (FIR) filter, the digital IQ(in-phase and quadrature) demodulation and the Compact PCI transmission interface.
2.2.1 Signal generator
The signal generator module is to generate a highly stable frequency-phase-amplitude-programmable sine wave current output, which is a key module for all the electric field based tomography. This module can be used not only for ERT but also other electrical tomography. A Direct Digital Synthesizer (DDS) integrated circuit chip is used to generate initial sine inject signals. Considering the load of the DDS signal is very weak, the Voltage Control Current Source (VCCS) is added to raise the output impedance of current source in ERT system. Also the Over Zero Switching (OZS)scheme [23] is designed in this module as well and provides a trigger signal for the following digital IQ demodulation.
2.2.2 FIR filter
Before the digital IQ demodulation employed, a FIR filter is necessary to improve SNR. In this system,a 23rd-order band-pass FIR filter is designed, which can suppress noise efficiently.
For an Mth order FIR filter, the output of a FIR filter in terms of its input can be given in the form of

The difference equation of F(z) is

where x(n) stands for the input signals, y(n) for the output signals, f(k) is the filter coefficients, M is the filter order.
In the hardware design, x(n) is always represented by the complement binary. Considering the length of x(n) is B bit, then,

where the Most Significant Bit (MSB) is the sign bit.Substitute Eq. (3) into Eq. (1), we get

This can be implemented by Distributed Arithmetic (DA) FIR. DA is an effective approach for implementing digital filters [24]. The basic idea is to replace all multiplications and additions by a table and a shifter-accumulator.
2.2.3 Digital demodulation
IQ demodulation is a common and useful signal processing technique [25] used in EIT systems, which can get the amplitude- and phase- information directly.When implemented with conventional analogy components, a number of inherent errors can degrade IQ demodulation performance, including gain balance,impedance match, and carrier leakage. Recent advances in high-speed Analog to Digital (AD) converter allow IQ demodulator to be implemented digitally, greatly reducing these systematic errors. As for an ERT system, the interest signal can be expressed by

where A is the attenuation and is the phase shift subjected by the injected signal propagated through the resistive medium, fcis the signal frequency. Assume that fsis the sampling frequency, then N fs/fcrepresents the samples in one period, then the interest signal would be discrete as

Take cos(2πn/N) and sin(2πn/N) as the reference signal, then for an even number of samples,

The ERT system has 16 parallel channels, the samples in a period are 16, where the current signal is 50 kHz, and the sampling frequency is 900 kHz. The FIR filter and the digital demodulation are implemented and processed in parallel in an FPGA (Fig. 3),which enhances greatly the speed and efficiency of the data acquisition.
2.2.4 Compact PCI interface
Compact PCI, the standard for PCI-based industrial computers, with identical electrical function with PCI but enhanced mechanic structure and hot-plugging feature, is employed for high-speed data-transmission.By adopting this structure, the signal generator card and the data acquisition card are configured to communicate with a computer via the Compact PCI bus.
The Compact PCI bus is applied as an interface for transmission with a logic controlling FPGA. Two operations to the Compact PCI bus, the input(I)/output (O) operation and the Direct Memory Access (DMA) transfer mode, are adopted to guarantee the communication properly. The I/O operation is for the configuration of the signal generator card, as well as the DMA transfer mode for the high-speed transmission of the AD card. The DMA transfer interface is as shown in Fig. 6, where the communication is implemented by the Compact PCI local controller module. A simple transport protocol used here, to indicate the measurement data obtained under which cross section and which excitation.
2.3 Software modules
Three modules, controlling and data transmission process, information extraction process and information visualization process, as shown in Fig. 4, are contained in this software, implementing in independent processes with different characteristics. Controlling and data transmission process with a user-friendly interface is to set and configure the hardware system and to control the transmission between the hardware and the computer through the Compact PCI bus. The stability and efficiency must be ensured and be the highest prior consideration for matching the high acquisition speed. Information extraction process is used to reconstruct conductivity image and extract procedure parameters, it is a data and compute intensive process and a methodical frame framework is used in visualization process, the data and information during the measurement are presented to the operators clearly and friendly. Among these processes, data is exchanged using anonymous pipes, and controlling and synchronizing signals are transmitted by user defined messages, ensuring they can work as an entirety.

Figure 3 Digital processing block diagram
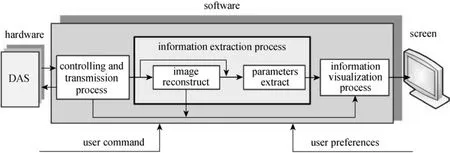
Figure 4 Structure of the software

Figure 5 Framework of online image reconstruction
2.3.1 Controlling and data transmission process
The data transmission process collects data through the DMA mode; and then the data need to be verified and normalized as pre-processing before throwing the data to anonymous pipes connecting other process; the controlling graphical user interface initializes the hardware configuration, controls measurement procedure and responds the operator. In this process the data transmission is an interaction between the software and the hardware system, and it is implemented through Compact PCI bus, with a DMA controller in local hardware subsystems and a controller program at the computer.
2.3.2 Information extraction process
Information extraction process in this system contains two parts: image reconstruction and procedure parameters extraction. Image reconstruction is the core function of this process. The conductivity distribution of observed field is reflected by it. Its resolution is directly affected by the precision of the reconstruction algorithms [26, 27]. However, high accuracy reconstruction algorithms usually accompany with a high time consumption, which is unendurable to realtime measurement but is worthy analyzing offline. So,several reconstruction algorithms with different speed and accuracy characteristic were coded in this software,such as linear back projection method, the sensitivitymap method, Tikhonov regularization algorithm, Landweber iterative algorithm, Newton iterative algorithm,and pre-iteration algorithm. The image reconstruction procedure is implemented under a methodically software framework shown in Fig. 5. The sensitivity matrix or Jacobian matrix is pre-calculated offline on the basis of the geometry of the vessel by the forward solution and is used to give an absolute reference for the real measurements for a homogeneous vessel condition.

Figure 6 User interface of information visualization process
The overall reconstruction procedure can be summarized as follows. Before reconstructing conductivity distribution online, two steps must be done offline.First, the Jacobian matrix must be calculated. Parameters of the calculation, such as current patterns, must be set before the calculation; the Finite Element Method (FEM) model during this calculation can be obtained by functions included in this software. Secondly, the boundary voltages of real object with a homogeneous spatial conductivity are collocated, and stored as calibration voltages for online image reconstruction. These two steps are performed only once.After that, conductivity distribution of the real field could be reconstructed realtime. This process can be divided to three steps. First, boundary voltages as the measurement results must be acquired and updated online. Secondly, conductivity matrix is calculated with the inputs, Jacobian matrix, calibration voltages,measurement voltages, and parameters of reconstruction algorithms. Finally, images are drawn in information visualization process.
For multiphase flow measurement, it is necessarily to obtain some flow parameters as the demands of industrial applications [28]. Hence, the flow parameters estimate algorithms are also contained. For example, concentration of each phase can be estimated by calculate the ratio between the aggregate area of the reconstructed field with a special conductivity, which represents one phase of the measured object, and the gross area of this field. And if two planes are measured at the same time, we can also estimate the speed of each phase by cross-correlation method using the boundary voltages collected by DAS in this system or the images reconstructed in this process. These parameters are very helpful for real time process monitoring.2.3.3 Information visualization process
In information visualization process, Open Graphics Library (OpenGL) is used to make the visualization more understandable. The user interface of this process is shown in Fig. 6, containing three main functions. First, the reconstructed images can be displayed on the screen with different gray style, different rotation angle or different smooth degree. Secondly, the track image of the observed object can be gotten by stacking the successive images. Finally, the boundary voltages and procedure parameters can be shown in many forms, such as table, graph, or histogram.In this software, the reconstruction image display speed is 60 frames per second, well monitoring the flow behavior, the data acquisition costs 0.96 ms only,and the image reconstruction costs less than 10 ms.
3 PERFORMANCE EVALUATIONS
A number of lab-based tests have been performed in water (electrical conductivity: 1065 μS·cm−1) filled plate vessel (diameter: 12.5 cm) as shown in Fig. 7. In these experiments, a constant current with amplitude of 2.5 mA and frequency of 50 kHz was applied to an adjacent pair of electrodes and the measured voltage samplings were taken from the rest 14 electrodes during each excitation/projection, which lasted for 3 periods of excitation signal, and then switched to excite the next pair of electrodes. 40 samples were taken each channel in one excitation at the sampling frequency of 16 samples per signal period. After the 23rd-order FIR filter, 16 samples were abstracted from the 40 samples into the digital IQ demodulator. After each procedure,208 data (only 104 data are independent), called one frame of data, can be got by measurements.

Figure 7 Plate vessel
3.1 Frame rate
Take the situation of 16 electrodes, adjacent strategy for exampling, inject 50 kHz sine wave current to a pair adjacent electrodes and measure the differential voltage of other adjacent electrodes. The adjacent strategy is the most attractive method in ERT since it requires minimal hardware to implement and image reconstruction can be performed quickly. The time cost of relative units is shown as Table 1.

Table 1 Time cost of data acquisition
First In First Out (FIFO) and Random- Access Memory (RAM) are built for data buffer, between the AD and the FIR filter, and also between the digital demodulation and the transmission module. Hence,the transmission module, as well as the digital demodulation, is independent to the AD converter module, what they need is completed before the next data acquisition period. Compared with the cost time of the data acquisition period, the transmission delay and the demodulation delay can be ignored. Thus, one frame data (50 kHz injecting current) of the data acquisition system cost about 704 μs. In other words, the data acquisition speed of the system is 1420 frames per second under the 50 kHz injecting current. This is under the ideal condition. Considering the usage of OZS scheme, the actual electrodes switching needs another 3 periods of the injected signal, which means each channel-switch would cost 60us, and one frame data 960 μs. So the actual speed of the system is 1041.6 frames per second under the 50 kHz injecting current.
3.2 Channel SNR and consistence
The system described in this paper is a 16-channel parallel data acquisition system. For a parallel data acquisition system, the channel SNR and the channel consistence are two important indexes to evaluate the system performance. The tests were performed on a circular object connected serially by resistors, while each resistor is 50 Ω with the precision of 0.5%. The SNR of each channel is calculated by

where v(l) and v are the measured voltage and the mean of the voltages, respectively, and the number of repeated measurements (L) was 500.
For the sixteen electrode ERT system, a better SNR of about 63 dB for each measurement channel was obtained (Fig. 8). What’s more, if the measured voltage could match the range of AD convector, the SNR would be better.

Figure 8 SNR on each channel
The mean voltages measured on each channel are used to evaluate the channel consistence with a standard deviation less than 2.0%. The errors are mainly caused by the inconsistency of the amplifier on the signal conditioning board.
3.3 Repeatability
The performance of the process instrumentation is highly dependent on the repeatability. It is extremely important for tomography measurement because relative changes are used in many cases. The following index SDV (standard deviation of voltage measurements) is used to evaluate the performance of repeatability:
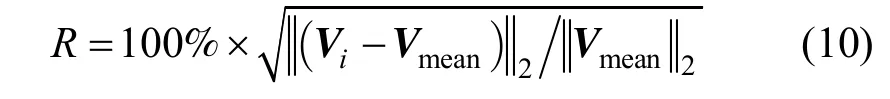
where Viis a vector of the ith voltage measurement,and Vmeanis a vector of the averaged voltage measurements (500 times in all).
Two groups of tests were performed using a 16-resistor object mentioned above and a column vessel respectively. The tests in regard to the channel repeatability were performed on a circular object connected serially by resistors, while each resistor is 50 Ωwith the precision of 0.5%, and the tests in regard to the frame repeatability were performed on the column vessel fulfilled with water, mentioned in Fig. 7. The tests were excited at a current signal with frequency of 50 kHz and amplitude of 2.5 mA. As Figs. 9 and 10 shown respectively, the channel repeatability is less than 0.4% (0.37% maximum), and the frame repeatability is less than 0.7%. Figs. 9 (a) and 10 (a) showed the repeatability index for continuous 500 measurements, while Figs. 9 (b) and 10 (b) showed the repeatability index for the first 30 measurements in a clear scope. The results manifested this system had a precise repeatability for measurements.

Figure 9 Channel repeatability with (a) SDV(channel) error of 500 measurements and (b) SDV(channel) error of first 30 measurements

Figure 10 Frame repeatability with (a) SDV(frame) error of 500 measurements and (b) SDV(frame) error of first 30 measurements

Figure 11 Reconstruction of high conductivity object
4 RESULTS AND DISCUSSION
4.1 Image reconstruction
The image reconstruction problem is to find the distribution of electrical conductivity within the region of interest using the knowledge of all 208 measurements of voltages. As a non-linear problem, ERT always adopts an iterative strategy to obtain a relatively acceptable result. In this section, pre-Newton iteration algorithm is adopted for realtime online reconstruction. First the generalized inverse matrix was obtained by Newton iteration offline, and then it would be applied to generate the image directly. A plastic rod representing low conductivity object, or a metallic rod, representing high conductivity object,with the same diameter of 25 mm, was used in a circular region of diameter 125 mm filled with water as an inclusion. Fig. 11 shows the reconstruction of the high conductivity object movement using the Newton Iteration, and Fig. 12 for the low conductivity object movement from one side to another. Figs. 11 (a) and 12 (a) show the pattern of the movement of the rod,whereas Figs. 11 (b) and 12 (b) show the reconstruction results when the rod moved to different positions.The gray in the reconstructed images is normalized and smoothed to provide a better contrast. Different objects can be distinguished in the observed field easily in these images due to their conductivity contrast to water. The gray could indicate the object conductivity.Contrast to water, the plastic rod is smaller and the metallic rod is greater. The grey levels, which lie underneath each image, represent the intensity of pixel values from 0 to 1. In this single object case, no matter the plastic or metallic rod, the images are well defined when a 25 mm diameter rod is placed at the observed field.

Figure 12 Reconstruction of low conductivity object

Figure 13 Images of static multiple rods by different image reconstruction algorithms
Figure 13 shows the image results by using different image reconstruction algorithms: the Newton Iterative and the Standard Tikhonov algorithm. The two tests devised for assessing spatial resolution of the system involved three plastic rods of the same size (25 mm) or with different size (20 mm, 25 mm, 25 mm)are reconstructed and showed good resolution. Individual rods can’t be distinguished when the size is down to 10 mm. As shown in Fig. 13, four plastic rods with same size (25 mm) and different size (2×20 mm,25 mm, 30 mm) are clearly visible. In practice, the visual resolution is a complicated function of the number of independent measurements (only 104 data for 16-channel ERT system), the construction algorithm used, and the way of presentation of image, such as the contrast, threshold and so on. Once applied appropriate thresholds, the dimensions and intensity are apparent. The tests show that the system could work properly as a whole, including the sensor array, the hardware data acquisition and the software image reconstruction.

Figure 14 Schematic view for the experimental facility
4.2 Oil-water flow in a horizontal pipeline
The dynamic experiments were carried out in October 2010 on the diameter 50 mm multiphase flow loop facility in Tianjin University, as Fig. 14 illustrated.In this flow loop, water and oil are fed from two separate tanks, each under various flow rates. These flows are then mixed to pass through the multiphase flow metering device under test. Before mixing, two streams are metered separately. The horizontal pipe that equipped the ERT sensors is made of organic glass, so the flow pattern could be observed clearly in the experiments.
The tests were conditioned with the combination from four water rates at 1.0, 1.5, 2.0 and 2.5 m3·h−1and five oil rates at 0.5, 1.0, 1.5, 2.0 and 2.5 m3·h−1.As for the oil-water flow in horizontal pipes, when the total flow rate is not high, under the gravity action the oil-water separation phenomenon exists with clear oil-water interface, and the stratified flow is observed.Under this flow regime, some electrodes may lose their electrical contact with the measured flow, which results in invalid voltage data [29]. Experiments showed that the invalid electrodes have common feature in the voltage data, which make it very useful to estimate the liquid level.
Figure 15 was the oil-water liquid estimation in horizontal pipeline; it showed a clear oil-water interface. When the flow rate was low, the flow was smooth and the interface was flat, as shown in Fig. 15(a), and as the flow rate was higher, the flow process became fluctuated but kept as stratified flow, as shown in Fig. 15 (b). The results showed, under the condition of low flow rate, use the liquid level directly to estimate the oil volume fraction would be very useful. But for conditions of high flow rate, it is very difficult since the flow process became greatly fluctuated and had different phase velocity.

Figure 15 Water level estimation by ERT data (a) under condition of low flow rate, (b) under condition of high flow rate

Table 2 Volume fraction by experiments
The measured water and oil flow rates in Table 2,which have been converted to standard conditions,were used to calculate real volume fraction, usually it
was calculated by

where β is oil volume fraction, q is the total liquid flow rate, qwis water flow rate, qois oil flow rate, Swand Sostand for water flow area and oil flow area,respectively, and uwand uofor water average velocity and oil average velocity, respectively. Under conditions of low flow rate, the velocity of water and oil were very similar. Hence, ignore the speed difference between water and oil, the volume fraction would be approximately equal to cross-sectional holdup. In other words,it would be feasible adopting cross-sectional holdup to estimate the volume fraction under low flow rate, and the estimated volume fraction was based on the crosssectional holdup, estimated from the liquid level by

where H stands for the liquid level and R is the radius of the pipe. The volume fraction is estimated from a mean fraction by 800 cross-sectional measurements.As Table 2 showed, it was effective to estimate volume fraction by cross-sectional measurement with errors less than 5% to real volume fraction under the condition of low flow rate. However, for high flow rates, flow process became greatly fluctuated and phase velocity had large differences between oil and water. The speed difference could not be ignored; otherwise it would lead to large errors. Other measurement methods for precise phase speed should be introduced to obtain better volume fraction under high flow rates.
5 CONCLUSIONS
The hardware and software ERT system framework for multiphase flow applications has been presented. A remarkable performance improvement of ERT system have been made by adopting advanced electronics design with the structure of FPGA and Compact PCI bus, online image reconstruction algorithms and pipeline data processing techniques for information extraction. The main feature of this ERT system is the flexibility derived through FPGA to provide a Compact PCI bus interface, all digital functions(including digital filtering and digital demodulation)and data acquisition management. The parallel hardware design is modular with fully digital FIR filter and digital demodulation, steady and fast Compact PCI transmission. The data acquisition speed can reach about 1420 frames per second, and 1041 frames per second with the OZS scheme adopting 50 kHz injecting current. The SNR each channel is above 54dB, and channel repeatability less than 0.4%, frame repeatability less than 0.7%. Dedicated user-friendly software also has been developed with pipeline processing for data acquisition, image reconstruction and flow information extraction. The results showed great precision contrast to real distribution for single object and good resolution relative to actual distribution for multiple objects. Preliminary dynamic experiments have been done in a horizontal pipeline, and the estimated volume fraction was very good with an error of less than 5% under conditions of low flow rate. Also it proved that this parallel ERT system has provided a firm foundation for the multiphase flow measurements in terms of concentration and velocity. Moreover, the system can easily be extended from single-plane to multi-plane by adding additional Compact PCI card and simple changes in FPGA and software in the computer. It is not only for ERT, but also for other applications by changing the signal pre-processing card. The future work would focus on the online monitoring of dynamic experiments and flow feature parameters extracting based on this ERT system,which would be helpful for the study on the flow characteristics in multiphase flows or some fast processes.
NOMENCLATURE
A signal amplitude voltage, V
F(z) f(n) by z-transformation
f frequency, Hz
f(n) filter coefficients
H height of liquid level, m
I voltage in-phase component, V
M order of the FIR filter
N samples during a period
Q quadrature component, V
q liquid flow rate, m3·s−1
R radius of the pipe, m
S flow area, m2
s(t) exciting voltage signal, V
u liquid average velocity, m·s−1
V measured voltage, V
x(n) input signals
y(n) output signals
β oil volume fraction
φ phase shift, rad·s−1
χ oil-phase fraction
Subscripts
b ordinal number
c measured signal
i ordinal number
mean mean value
o oil
s sampling signal
w water
1 Dyakowski, T., Jeanmeure, L.F., Jaworski, A.J., “Applications of electrical tomography for gas-solids and liquid-solids flows—A review”, Powder Technol., 112, 174-192 (2000).
2 Xie, C.G., Reinecke, N., Beck, M.S., “Electrical tomography techniques for process engineering applications”, Chem. Eng. J., 56,127-133 (1995).
3 Zhao, X., Lucas, G.P., “Use of a novel dual-sensor probe array and electrical resistance tomography for characterization of the mean and time-dependent properties of inclined, bubbly oil-in-water pipe flows”, Meas. Sci. Technol., 22 (10), 104012 (2011).
4 Ismail, I., Gamio, J.C., Bukhari, S.F.A., Yang W.Q., “Tomography for multi-phase flow measurement in the oil industry”, Flow Meas.Instrum., 16, 145-155 (2005).
5 Dong, F., Jiang, Z.X., Qiao, X.T., Xu, L.A., “Application of electrical resistance tomography to two-phase pipe flow parameters measurement”, Flow Meas. Instrum., 14, 183-192 (2003).
6 Thron, R., Johanson, G.A., Hammer, E.A., “Recent developments in three-phase flow measurement”, Meas. Sci. Technol., 8 (7), 691-701(1997).
7 Hammer, E.A., Johansen, G.A., “Process tomography in the oil industry: State of the art and future possibilities”, Meas. Control, 30,212-216 (1997).
8 Wang M., “Seeing a new dimension—The past decade’s developments on electrical impedance tomography”, Prog. Nat. Sci., 15,1-13 (2005).
9 Dong, F., Liu, X.P., Deng, X., Xu, L.J., Xu L.A., “Identification of two-phase flow regimes in horizontal, inclined and vertical pipes”,Meas. Sci. Technol., 12, 1069-1075 (2001).
10 Wang, M., Ma, Y.X., Holliday, N., Dai, Y.F., Williams, R.A., Lucas G., “A high-performance EIT system”, IEEE Sens. J., 5 (2), 289-299(2005).
11 Jia, J.B., Wang, M., Schlaberg, H., Li, H., “A novel tomographic sensing system for high electrically conductive multiphase flow measurement”, Flow Meas. Instrum., 21 (3), 184-190 (2010).
12 York, T.A., Burnett-Thompson, A., Grieve, B.D., “Low cost and accessible electrical impedance imaging”, In: 3rd International Symposium on Process Tomography, Technical University of Lodz, Lodz,Poland, 175-178 (2004).
13 Rodgers, T.L., Siperstein, F.R., Mann, R., York, T.A., Kowalski, A.,“Comparison of a networks-of-zones fluid mixing model for a baffled stirred vessel with three-dimensional electrical resistance tomography”, Meas. Sci. Technol., 22 (10), 104014 (2011).
14 Wilkinson, A.J., Randall, E.W., Cilliers, J.J., Durrett, D.R., Naidoo,T., Long, T., “A 1000-measurement frames/second ERT data capture system with real-time visualization”, IEEE Sens. J., 5 (2), 300-308(2005).
15 Wilkinson, A.J., Randall, E.W., Long, T.M., Collins, A., “The design of an ERT system for 3D data acquisition and a quantitative evaluation of its performance”, Meas. Sci. Technol., 17, 2088-2096 (2006).
16 Kourunen, J., Savolainen, T., Lehikoinen, A., Vauhkonen, M., Heikkinen, L.M., “Suitability of a PXI platform for an electrical impedance tomography system”, Meas. Sci. Technol., 20, 1-11 (2009).
17 Zhu, J.P., Wang, B.L., Huang, Z.Y., Li, H.Q., “Design of ERT system”, J. Zhejiang Univ. Sci., 6A (12), 1446-1448 (2005).
18 Wang, B.L., Huang, Z.Y., Li, H.Q., “Design of high-speed ECT and ERT system”, J. Phys. Conf. Ser., 147, (2009).
19 He, Y.B., “Research on techniques of dual-mode electrical resistance& capacitance tomography”, Ph.D Dissertation of Tianjin University,Tianjin, China, 21-32 (2006). (in Chinese)
20 Cui, Z.Q., Wang, H.X., Xu, Y.B., “An integrated ECT/ERT dual modality sensor”, In: Proceeding of International Instrumentation and Measurement Technology Conference, IEEE Instrumentation &Measurement Soc., Singapore, 1434-1438 (2009).
21 Ma, X., Peyton, A.J., Higson, S.R., Lyons, A., Dikinson S.J.,“Hardware and software design for an electromagnetic induction tomography (EMT) system for high contrast metal process applications”, Meas. Sci. Technol.,. 17 (1), 111-118 (2006).
22 Stephenson, D.R., York, T.A., Mann, R., “Performance and requirements of process ERT instruments”, In: 5th World Congress on Industrial Process Tomography, The Virtual Centre for Industrial Process Tomography, Bergen, Norway, 895-901 (2007).
23 Wang, M., Ma, Y., “Over-zero switching scheme for fast data collection operation in electrical impedance tomography”, Meas. Sci. Technol.,17, 2078-2082 (2006).
24 Sun, Y., Gao, H., Xiong, C., Rao, K., “Design and implementation of FIR digital filter based on Matlab and FPGA”, Mod. Electr. Tech., 11,89-92 (2008).
25 Ziomek, C., Corredoura, P., “Digital I/Q demodulator”, In: Proceedings of the 1995 16th Particle Accelerator Conference, IEEE Nucl. &Plasma Sci. Soc., Dallas, TX, USA, 2663-2665 (1995).
26 Borcea, L., “Electrical impedance tomography”, Inver. Pro., 18,99-136 (2002).
27 Hjertaker, B.T., Maad, R., Schuster, E., Almas, O.A., Johanson, G.A.,“A data acquisition and control system for high-speed gamma-ray tomography”, Meas. Sci. Technol., 19 (9), 1-9 (2008).
28 Dong, F., Tan, C., Liu, J., Xu, Y., Wang, H., “Development of single drive electrode electrical resistance tomography system”, IEEE Trans. Instrum. Meas., 55, 1208-1214 (2006).
29 Ma, Y.X., Zheng, Z.C., Xu, L.A., Liu, X.P., Wu, Y.X., “Application of electrical resistance tomography system to monitor gas/liquid two-phase flow in a horizontal pipe”, Flow Meas. Instrum., 12,259-265 (2001).
2011-12-12, accepted 2011-12-31.
* Supported by the National Natural Science Foundation of China (51176141) and the Natural Science Foundation of Tianjin(11JCZDJC22500).
** To whom correspondence should be addressed. E-mail: fdong@tju.edu.cn
猜你喜欢
杂志排行

Chinese Journal of Chemical Engineering的其它文章
- Optimization for Production of Intracellular Polysaccharide from Cordyceps ophioglossoides L2 in Submerged Culture and Its Antioxidant Activities in vitro*
- Application of Choline Chloride·xZnCl2 Ionic Liquids for Preparation of Biodiesel*
- Inhibiting Effect of Ciprofloxacin, Norfloxacin and Ofloxacin on Corrosion of Mild Steel in Hydrochloric Acid*
- Experimental and Numerical Study on Heat Transfer Enhancement of a Rectangular Channel with Discontinuous Crossed Ribs and Grooves*
- Effect of the Interference Instant of Zeolite HY Catalyst on the Pyrolysis of Pubescens*
- Translocation of Polymer Through a Nanopore Studied by Langevin Dynamics: Effect of the Friction Coefficient*