Reconstruction of Emission Coefficients for a Non-axisymmetric Coupling Arc Based on MALDONADO's Method
2012-01-20XIONGJunZHANGGuangjunHUYutangandWULin
XIONG Jun,ZHANG Guangjun*,HU Yutang,and WU Lin
State Key Laboratory of Advanced Welding and Joining,Harbin Institute of Technology,Harbin 150001,China
1 Introduction
Arc plasmas have been extensively used in industrial areas of welding,spraying,cutting and surface modification[1-3].For the purpose of improving the understanding and performance of these plasma applications,their physical properties must be researched.Particularly,the distributions of plasma parameters such as the electron density and temperature are of great importance to many domains of physics and engineering[4],because they can provide significant insight into the fundamental processes that occur in the plasma.This paper reports on measurements of plasma properties of a special coupling arc.The coupling arc is a new type of welding heat source developed in recent years[5],which is produced by a special welding torch that has two slanting tungsten electrodes insulated from each other.And two power supplies are separately connected to the two electrodes.The spacing between both tungsten electrodes can be adjusted from 1 mm to 3 mm.As can be shown in Fig.1,the visible shape of the coupling arc is no longer axisymmetric[6]compared with the free burning TIG single arc.

Fig.1.Comparison of the visible shape of the single arc and coupling arc
For the determination of arc plasmas,optical emission spectroscopy as a non-invasive diagnostic method has been widely adopted in most cases,for example,the works of OLSEN[7],HADDAD[8-10],THORNTON[11]and PETERS,et al[12].However,all these works for determining plasmas are based on the assumption that the plasmas are axisymmtric.To the present,little has been done to characterize the non-axisymmetric coupling arc.
In many applications of plasma diagnostics and flame studies,the parameters,such as temperatures and electron densities,in the inner part of them are almost impossible to be acquired directly.Only the line-of-sight projected intensities can be measured.
Some researchers[16-18]have studied converted algorithms for a non-axisymmetric plasma.In this research,the emission coefficient is reconstructed by means of MALDONADO's method[19]that obtained the reconstructive formula of an asymmetric source on the basis of expanding the emission coefficient into Fourier series,complex polynomials and Laguerre polynomials.
The rest of this paper is as follows.Section 2 presents a brief description of the equipment.In section 3,a displaced Gaussian model is used to test the accuracy of MALDONADO's method,and then the emission coefficient of a free burning arc are reconstructed by means of this approach and an Abel inversion,respectively,followed by section 4 reconstructs the emission coefficient profile of the coupling arc.Finally,some conclusions are made in section 5.
2 Experimental Systems
The experimental set-up is shown schematically in Fig.2.The coupling arc with a current of 120 A each,arc length 4 mm and electrode distance 1 mm,was burning free at atmospheric pressure between two slanting tungsten electrodes and a water-cooled copper plate anode.The anode was water cooled to ensure that the copper plate did not melt and to keep the arc steady during the measurement.Moreover,the presence of metal vapor that may change the arc properties can be avoided.Both cathode electrodes were performed with 3.2 mm diameter thoriated tungstens.The shielding gas was argon with a flow rate of 10 L/min.

Fig.2.Multi-angle experimental system for determining the emitted intensity
Arc images of the argon atomic line intensity were acquired by using the imaging system that consists of a neutral filter,a narrow-band filter and a lens.Light from the coupling arc was imaged before passing through the neutral filter and the narrow-band filter to the detector.The lens was placed far from the coupling arc,and can be adjusted according to the magnification of the image.A Dalsa CA-D6-0256W high-speed camera with a 955 frames per second resolution is capable of acquiring 8 bit grey scale images.To reduce strong radiation from the coupling arc,the neutral filter must be placed in front of the narrow band filter.Under these circumstances,with the aperture of the camera being carefully tuned,an unsaturated monochromatic image was obtained.In addition,the welding torch was devised to be capable of rotating around its axis from 0°to 180°for acquiring coupling arc images from different directions.
The Ar I 794.8 nm line was selected due to its separation from other lines and its strong intensity.The narrow-band filter with a full width at half maximum of 3.1 nm centered at wavelength 794.8 nm and 780.1 nm.In such a circumstance,no other spectra from the arc can pass through the narrow-band filter except for the interested one.Then,the acquired image consists of only the intensity of the Ar I 794.8 nm line and the continuum radiation near the same wavelength.
3 Verification of MALDONADO's Method
3.1 Displaced Gaussian model
For arc plasmas,the relation between emission coefficient and spectral intensity is expressed as

wheref(x',y') is the emission coefficient,g(ξ,x) is the emitted spectral intensity,ξdenotes the angle of rotation of the source coordinates (x',y') relative to the fixed laboratory coordinates (x,y) .
A displaced Gaussian model is used to validate the reliability of the program based on MALDONADO's method.The emission coefficient of an asymmetrical source is given by[19]

where amplitudeB,spread parameterβ,and displacementdare fixed quantities.This investigation selectsβ=4,B=2.2 andd=0.1 and the reconstructed area isQ= {(x,y)| -0.8≤x≤0.8,-0.8≤y≤0.8}.
收集河北省沿海试点区域的控制数据、影像数据、大比例尺水深数据及岸线数据,作为试点研究的参考资料及试验依据。
By introducing Eq.(2) into Eq.(1),the end result of spectral intensity can be formulated as

Fig.3 shows the comparison between the reconstructed and theoretical emission coefficient in liney=0 after normalization.It is clear to see that the two curves are displaced alongxaxis,and they are in excellent agreement with each other except for the area that emission coefficients are small.This is probably a consequence of the limited areaQthat we select.The minor values of intensities beyondQare neglected.

Fig.3.Comparison between reconstructed and theoretical emission coefficients in line y =0 after normalization
3.2 Application for a free burning arc
Provided that MALDONADO's method is applicable to a non-axisymmetric plasma,it also can be used for an axisymmetric plasma.Thus,it is also applied to reconstruct the emission coefficients of a free burning arc with a current of 200 A and arc length 5 mm.The Ar I 794.8 nm line intensities were collected by imagery method described in section 2.The emission coefficients were reconstructed from projected intensities which were 1 mm beneath the tungsten cathodes.Before using MALDONADO's method to data with noise,the denoising procedure is imperative.Fig.4 shows the normalized intensity after symmetrizing and noise-filtering.Assuming that the free burning arc is axisymmetric,as required by the algorithm[19],twelve projected views from 0°to 180°at intervals of 15°should have identical distribution of intensity shown in Fig.4.
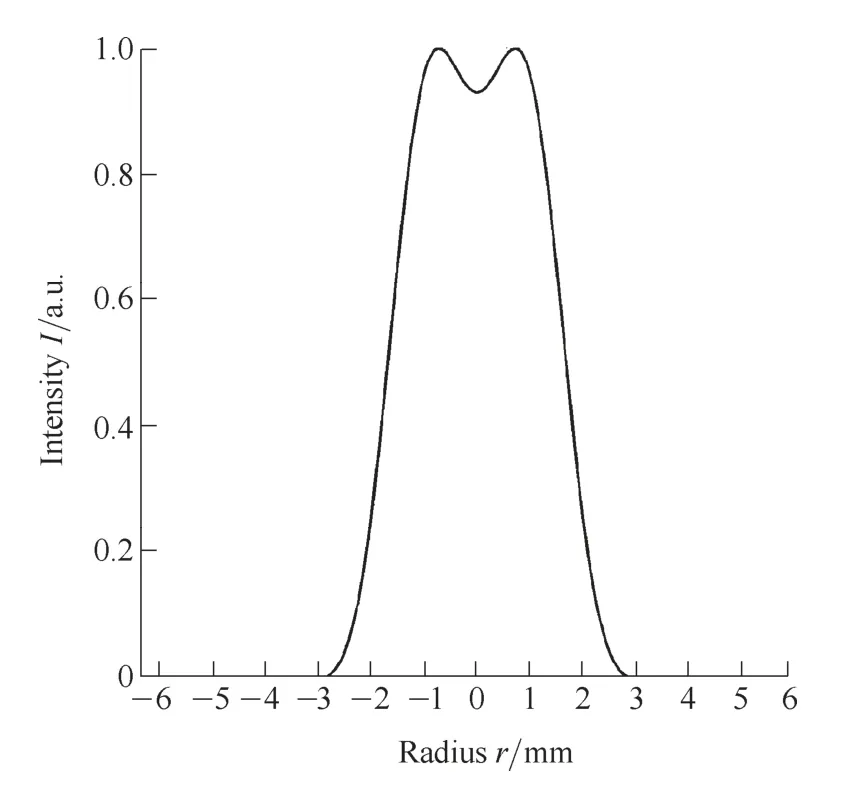
Fig.4.Normalized intensity for a free burning arc
Fig.5 displays the reconstructed emission coefficients by means of MALDONADO's method in comparison to an Abel inversion[14]after normalization.As can be seen,good agreement is obtained except for minor emission coefficients.This is not the problem that we should consider,because the emission coefficients approaching zeros are not the primary research area in spectroscopic diagnostics of the coupling arc.

Fig.5.Emission coefficients reconstructed by Abel inversion(solid curve) and Maldonado's method (broken curve)
4 Reconstruction of Emission Coefficient for the Coupling Arc
The coupling arc images were acquired from different directions at intervals of 15°as required by the algorithm.Twelve images were taken with the high speed camera by using the same exposure time.Furthermore,in order to reduce uncertainties in arc plasmas,such as fluctuations of intensity,the exposure time was adjusted to be sufficient to time-average the images.Several arc images are shown in Fig.6.Each arc image was divided into nine lays,from the cathode tip to the surface of water-cooled copper plate,meaning that the distance between every two lays was 0.5 mm.Before using MALDONADO's approach to intensity with noise,the denoising procedure is mandatory.Fourier transform method was used for filtering noise on account of its simpleness and efficiency.

Fig.6.Coupling arc images in different directions.
After denoising,the emission coefficient can be immediately calculated with MALDONADO's approach.Fig.7 displays the contour plot of emission coefficient on different cross-sections that are perpendicular to thezaxis.It should be illustrated that the direction that both electrodes are arranged along is parallel to theyaxis,as detailed in Fig.2.
As can be shown in Fig.7,the distribution of emission coefficient for the coupling arc is different from centrosymmetric shape which is the conventional shape of a TIG single arc.Moreover,the distribution of emission coefficient is similar to an ellipse,and the short axis of the ellipse is in the direction that both electrodes are arranged along.All these facts demonstrate that there is a strong interaction between both arcs within the coupling arc.
The whole spatial distribution of emission coefficients are shown in Fig.8.The emissivity distribution in the direction of 0°is different from that of 90°,which proves that the temperature distribution is also no longer axisymmetric.Furthermore,in the middle of both slanting tungsten cathodes,where the temperature is higher than the‘standard temperature' of Ar I 794.8 nm line,the emission coefficient profile in the direction of 0°has a dip in the center area.It means that the maximum temperature is in the middle of both electrodes,which is an important characteristic of the coupling arc.


Fig.7 Contour plot of emission coefficient on different cross-sections for the coupling arc.


Fig.8 Spatial distribution of emission coefficient for the coupling arc.
5 Conclusions
(1) A displaced Gaussian model is used to evaluate MALDONADO's method programmed by MATLAB language.Then the emission coefficient of a free burning arc is also reconstructed by MALDONADO's method compared to the Abel inversion,good agreement is obtained,proving the feasibility and practicability of the program to characterize a non-axisymmetric arc plasma.
(2) The distribution of emission coefficient for the coupling arc is similar to an ellipse,with the short axis of the ellipse in the direction in which both electrodes are aligned.
(3) The emission coefficient profile for the coupling arc is non-axisymmetric,and there is a strong interaction between both arcs within the coupling arc.
[1]KOGELSCHATZ U.Atmospheric-pressure plasma technology[J]Plasma Physics and Controlled Fusion,2004,46:63-75.
[2]DAI Dashan,SONG Yonglun,ZHANG Leping.Study on the pressure in plasma arc[J].Chinese Journal of Mechanical Engineering,2003,16(1):34-36.
[3]LIU Haiyun,LI Hui,LI Zhuoxin,et al.Experimental study on metal transfer and welding spatter characteristics of cellulose electrode[J].Chinese Journal of Mechanical Engineering,2010,23(6):793-796.
[4]DORIA D,KAVANAGH K D,COSTELLO J T,et al.Plasma parametrization by analysis of time-resolved laser plasma image spectra[J].Measurement Science and Technology,2006,17:670-674.
[5]KOBAYASHI K,YAMADA M,FUJISHIMA K,et al.Development of high efficiency twin-arc TIG welding method[J].IIW Doc.XII,2004,1 669-1 671.
[6]LENG Xuesong,ZHANG Guangjun,WU Lin.The characteristic of twin-electrode TIG coupling arc pressure[J].Journal of Physics D:Applied Physics,2006,39:1 120-1 126.
[7]OLSEN H N.Thermal and electrical properties of an argon plasma[J].The Physics of Fluids,1959,2(6):614-623.
[8]HADDAD G N,FARMER A J D.Temperature determinations in a free-burning arc:I.Experimental techniques and results in argon[J].Journal of Physics D:Applied Physics,1984,17:1 189-1 196.
[9]HADDAD G N,FARMER A J D.Temperature measurements in gas tungsten arcs[J].Welding Journal,1985,64(12):339-342.
[10]FARMER A J D,HADDAD G N,CRAM L E.Temperature determinations in a free-burning arc:III.Measurements with molten anodes[J].Journal of Physics D:Applied Physics,1985,19:1 723-1 730.
[11]THORNTON M F.Spectroscopic determination of temperature distributions for a TIG arc[J].Journal of Physics D:Applied Physics,1993,26:1 432-1 438.
[12]PETERS J,HEBERLEIN J,LINDSAY J.Spectroscopic diagnostics in a highly constricted oxygen arc[J].Journal of Physics D:Applied Physics,2007,40:3 960-3 971.
[13]IGNJATOVIC L M,MIHAJLOV A A.The realization of Abel's inversion in the case of discharge with undetermined radius[J].Journal of Quantitative Spectroscopy and Radiative Transfer,2002;72:677-689.
[14]MA Shuiliang,GAO Hongming,ZHANG Guangjun,et al.Abel inversion using legendre wavelets expansion[J].Journal of Quantitative Spectroscopy and Radiative Transfer,2007,107:61-71.
[15]FENG Zhimin,WANG Ying,HU Haigang,et al.Comparison and analysis of three different non-contacting flame temperature field measurements[J].Chinese Journal of Mechanical Engineering,2003,16(2):221-224.
[16]CORMACK A M.Representation of a function by its line integrals,with some radiological applications[J].Journal of Applied Physics,1964,35:2 908-2 913.
[17]NAGAYAMA Y.Tomography ofm=1 mode structure in tokamak plasma using least-square-fitting method and Fourier-Bessel expansions[J].Journal of Applied Physics,1987,62:2 072-2 076.
[18]JANICKI C,DECOSTE R,NOËL P.Soft x-ray imaging diagnostic on the tdev tokamak[J].Review of Scientific Instruments,1992,63:4 410-4 417.
[19]MALDONADO C D,OLSEN H N.New method for obtaining emission coefficients from emitted spectral intensities.Part II—Asymmetrical source[J].Journal of Optical Society of America,1966,56:1 305-1 313.
Biographical notes
XIONG Jun,born in 1986,is currently a PhD candidate atState Key Laboratory of Advanced Welding and Joining,Harbin Institute of Technology,China.
E-mail:changfeng0007@163.com
ZHANG Guangjun,born in 1969,is currently a professor atState Key Laboratory of Advanced Welding and Joining,Harbin Institute of Technology,China.His main research interests include robotics welding,remanufacture and properties of arc plasma.
E-mail:zhanggj@hit.edu.cn
HU Yutang,born in 1983,he received his master degree atHarbin Institute of Technology,China,in 2009.
E-mial:huyt05@163.com
WU Lin,born in 1935,is currently a professor atState Key Laboratory of Advanced Welding and Joining,Harbin Institute of Technology,China.His main research interests include robotics welding and intelligent control.
猜你喜欢
杂志排行

Chinese Journal of Mechanical Engineering的其它文章
- Tool Wear in Turning of Titanium Alloy after Thermohydrogen Treatment
- Psychoacoustic Study on Contribution of Fan Noise to Engine Noise
- Modeling of Fatigue Crack Growth Closure Considering the Integrative Effect of Cyclic Stress Ratio,Specimen Thickness and Poisson's Ratio
- Characterizing the Spheroidization Grade and Strength of 15CrMo Steel through Determining Fractal Dimension
- Influence of Deposition Temperature and Pressure on Microstructure and Tribological Properties of Arc Ion Plated Ag Films