Experimental and CFD Study on the Role of Fluid Flow Pattern onMembrane Permeate Flux
2011-05-15ParvarehRahimiMadaeniandAlsairafi
A. Parvareh, M. Rahimi,*, S. S. Madaeni and A. A. Alsairafi
Experimental and CFD Study on the Role of Fluid Flow Pattern onMembrane Permeate Flux
A. Parvareh1, M. Rahimi1,*, S. S. Madaeni1and A. A. Alsairafi2
1CFD Research Center, Chemical Engineering Department, Razi University, Kermanshah, Iran2Faculty of Mechanical Engineering, College of Engineering and Petroleum, Kuwait University, Kuwait
This paper reports a study on the role of fluid flow pattern and dynamic pressure on the permeate flux through a micro filtration membrane in laboratory scale. For this purpose, a dead-end membrane cell equipped with a marine type impeller was used. The impeller was set to rotate in the clockwise and counter clockwise directions with the same angular velocities in order to illustrate the effect of rotation direction on permeate flux. Consequently, permeate fluxes were measured at various impeller rotational speeds. The computational fluid dynamics (CFD) predicted dynamic pressure was related to the fluxes obtained in the experiments. Using the CFD modeling, it is proven that the change in dynamic pressure upon the membrane surface has direct effect on the permeate flux.
membrane, microfiltration, computational fluid dynamics, modeling, permeate flux
1 Introduction
The design and optimization of the operating conditions of membrane modules requires rigorous knowledge about the hydrodynamic characteristics inside the channels. In membrane separation processes, the hydrodynamics of fluid affects the membrane flux, especially the pressure distribution in the pressure- driven processes. Numerical simulation for processes involved with membrane separation has recently received a lot of attention due to the advantage over expensive experiments [1, 2]. In addition, the optimum operational condition may be obtained by simulation.
Nowadays, computational fluid dynamics (CFD) is one of the most useful theoretical tools to investigate and predict the performance of processes involved with momentum, heat and mass transfer. CFD is useful to improve our knowledge about increasing the separation efficiency without recourse to further rigorous and costly experimental work, especially in complex-geometries modules [3].
CFD has been applied successfully in the membrane technology for the separation process optimization. In a number of studies, CFD was used to predict the flow field. Belfort [4] reviewed the development of understanding of the fluid dynamics in membrane systems up to 1989. Most of such research was focused on the flow pattern in a simple separation cell to complicated cells such as fuel cells.
Fimbres-Weihs and Wiley [5] reviewed the study for 3D CFD modeling of flow and mass transfer in narrow spacer-filled channels in membrane modules in laminar steady and unsteady as well as turbulent flow regimes, in which the difficulties and restrictions of such simulation are accounted. Liu. [6] studied the turbulent flow in central and wall baffle-filled membrane tubes by using CFD technique and found that the filtration flux in the central baffle was higher due to the higher wall shear stress produced by central baffle. Agashichev [7] developed a model for quantitative correlation between the longitudinal mass flow and the degree of the concentration polarization, which may be used to analyze the influence of mass flow and bulk flow concentration on the degree of the concentration polarization. Wiley and Fletcher [8] described the application of a CFD model on pressure- driven membrane processes involving selective removal of components in the feed channel and their transfer to the permeate channel. The effects of changes in rejection, wall permeation rates and solution properties on velocity and concentration profiles were presented for empty channels and channels with eddy promoters. They also developed a generic purpose CFD model for concentration polarization and fluid flow in pressure driven membrane separation processes [9]. The results were validated by classical solutions available in the literature and revealed that over simplified expressions for the dependence of viscosity and diffusivity on concentration, which produce velocity and concentration profiles, may lead to misrepresenting the reality.
Damak. [10] performed a CFD modeling of a laminar, incompressible and isothermal flow in a cylindrical tube. They assumed the flow to be axisymmetric and used Darcy’s law to explain the mass transfer in the tube and in the porous wall. Their results offered a theoretical structure for the understanding of the phenomenon responsible for flux decline. Ahmad. carried out a CFD study on the mass transfer and hydrodynamics in a membrane [11]. They studied the concentration polarization profile, mass transfer coefficient and wall shear stress in a membrane channel.
Rahimi. [12] presented a CFD modeling in order to predict the total permeate flux by integrating the local permeate fluxes over the whole membrane surface. The permeate fluxes from different input-output pressures as well as various cell setups, including a cell equipped with three types of barrier and the same cell without any barrier, were predicted. They compared the CFD prediction results with a simple calculation based on the well-known Darcy equation.
Ghidossi. [13] reviewed the studies on using CFD to model membrane separations and showed that CFD can provide interesting and important information for the development of membrane processes. Ranade and Kumar presented a detailed fluid hydrodynamics of spacer-filled channels using the “unit cell” approach [14]. The CFD modeling was used to evaluate the performance of certain spacer shapes and compare the results in flat and curved channels. Torras. [15] simulated a rotating disk flat membrane module operated at high rotation speeds in the turbulent regime using CFD technique and concluded that the discrepancy for the membrane shear stress is probably due to an incorrect choice of Reynolds number for deducing the approximate solution. In another study, Alexiadis. [16] performed experimental and numerical analyses for a reverse osmosis (RO) module and compared the results in order to validate the model from a practical perspective. They showed that asDP increased, the error between the CFD calculations and experimental results increased. In a more recent study, Pak. [17] simulated a laminar fluid flow in a 2D porous tube as a cross flow micro filtration tubular membrane using CFD technique and developed a numerical finite volume code, using SIMPLE algorithm, for the solution of flow and concentration fields.
In the present study, the effects of fluid flow pattern on the permeate flux through a microfiltration membrane are investigated. Two flow pattern regimes are produced using a marine type impeller placed inside a dead-end cell. The main idea in this study is to illustrate in what extent the flow pattern upon the membrane surface is important. The flow pattern is related to dynamic pressure, which is a part of total pressure upon the membrane surface. The dynamic pressure distribution is to be obtained by CFD modeling. A scientific illustration of the importance of dynamic pressure beside the static pressure can be considered as the novel point of this work.
2 Theory
Microfiltration is one of the most general membrane separation processes. In general, two types of fluid movement regimes are reported, dead-end and cross flow. The driving force in the microfiltration is the pressure gradient across the membrane. The Darcy equation is the most general equation used in literature for determination of permeate flux, which is defined as
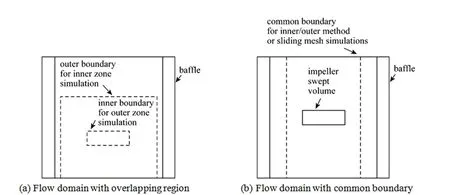
Figure 1 Different subdivisions of flow zones in a mixing tank [20]
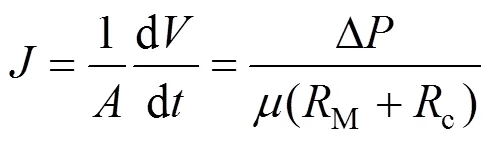
in whichDis the transmembrane pressure,is the viscosity,Mis the membrane resistance, andcis the cake resistance.
In the present study the fluid movement upon the membrane surface is produced by a marine type impeller, the impeller should be modeled similar to that in mixing tanks, which is the most important part for modeling a mixing tank. The three popular approaches for modeling an impeller are: impeller boundary condition, inner-outer iterative procedure and sliding-grid method. In the impeller boundary condition method, which is the most traditional approach, steady conditions are imposed and simulations are conducted in the reference frame. This method needs empirically derived boundary conditions, so the simulation results are strongly dependent on the predefined boundary conditions. The inner-outer method takes the approach just one step further. In this approach, the whole vessel volume is subdivided into two partly overlapping regions, as shown in Fig. 1 (a), an “inner” domain containing the impeller and an “outer” one containing the rest of the tank. A crucial feature of this approach is the overlap region, common to the “inner” and “outer” domains, which provides the iterative matching of the two solutions. The extent of this region and the exact location of its boundaries are largely arbitrary. By contrast, in the multiple frames of reference (MFR) method[18], the “inner” and “outer” steady-state solutions are implicitly matched along a single boundary surface and external iteration is then not required. In the sliding- grid or sliding-mesh method, the flow domain is divided into two cylindrical, non-overlapping sub-domains, each girded as a separate block. The outer one is fixed, while the inner one rotates with the impeller. Fig. 1 (b) shows the flow domain configuration typically used in this method and MFR method as well. Brucato. [19] presented predictions with the three methods for baffled tanks stirred by single and dual Rushton turbines and also by a constant pitched helical impeller.
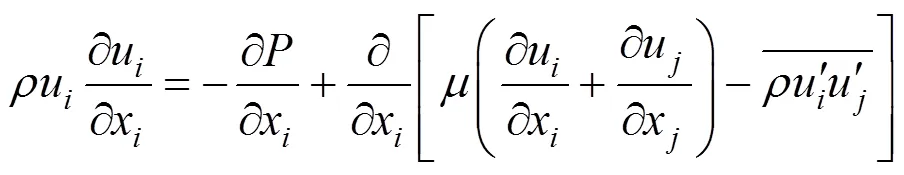
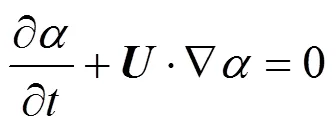
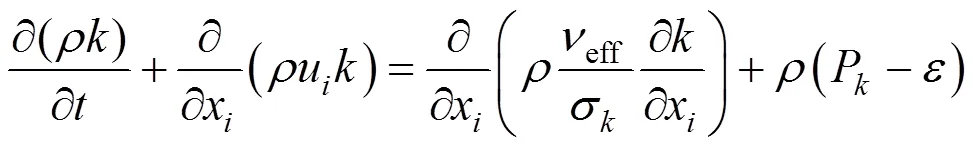
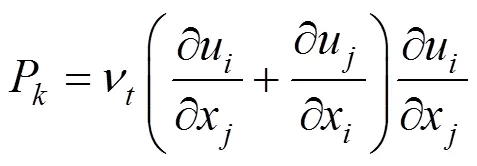
The CFD modeling involves the numerical solution of conservation equations. In this work, the Navier- Stokes equations are applied to all of the control volumes and the RNG-based equations [21, 22] are used to describe the physics associated with the turbulence flow such as velocity field, pressure, turbulent kinetic energy and turbulent dissipation rate. The Navier-Stokes equations for an incompressible flow with constant fluid properties in the Cartesian coordinate are as follows [23]:


As the layout studied is an open surface case, the system is involved with the contact of water and air. Therefore, in Eq. (3), the density () and viscosity () of the fluid depend on the volume fractions of each phase and are calculated by the following equations

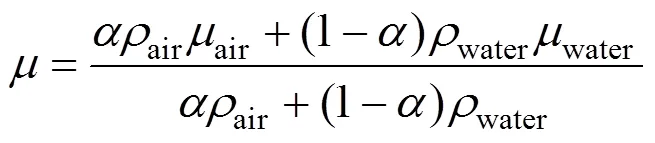
whereis the air volume fraction in the cell. The interface between two phases is tracked by the volume fraction. Conservation ofcan be represented by the interface mass balance,
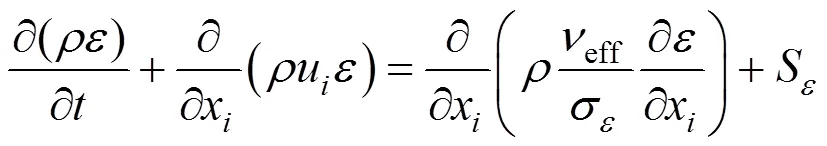
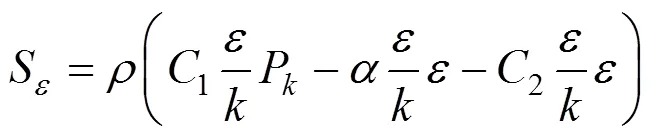
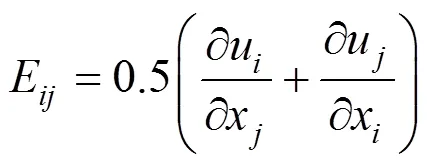
In addition to the above equations, the equations of the RNG-model are as follows [21, 22]
in which
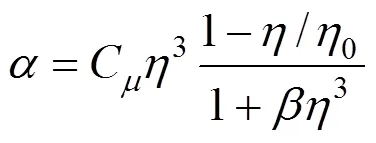
The following coefficients are used in the modeling as the RNG turbulence model parameters [22], , , , , , .
The microfiltration membrane used in the current experiment was a hydrophilic Millipore PVDF (poly vinylidene fluoride) with the commercial name of GVWP. This membrane has a thickness of 120 µm and a porosity of 60%. The average pore size of the membrane is 0.022 µm.

Figure 2 The cell and its accessories
Figure 3 Determination of membrane resistance
In order to eliminate the blocking effect due to the formation of the cake on the membrane surface, the cell was filled with deionized water up to 15 cm. Physical properties of deionized water are considered as those of water. Since the membrane resistance depends on operating pressure, its value was measured under the experimental condition. From the mass of permeate obtained at different pressures in the range of experiments, the membrane resistance was obtained. The effects on the permeate flux were examined by varying the transmembrane pressure as shown in Fig. 3. The permeate flux linearly increases with the increase of transmembrane pressure. For this calculation the Darcy equation was used and the cake resistance,c, was set at zero, as the working fluid was deionized water. The value of 2.5´1010m-1was obtained forM.
The main aim of the present study is to illustrate how the fluid flow pattern affects the permeate flux. Some experiments were carried out for this purpose and each one was repeated three times with a maximum observed difference of 5% between the measured fluxes. The average values of the permeate flux measured during 5 min were used for this analysis. In the first two experiments, the impeller was rotated with the same power and in the fourth one the impeller was stopped. In a marine type impeller, the blades are fixed on a shaft with an angle of 120°relative to each other. When the impeller rotates in different direction it is expected that different fluid flow patterns and velocities are established inside the cell.
In the first step, the impeller rotation speed was 140 r·min-1for both clockwise and counter clockwise directions and the permeate mass from the membrane was measured. Fig. 4 shows the permeate mass of deionized water for different states of impeller: clockwise rotation, counter clockwise rotation and stationary. The increase of the permeate flux is negligible when the impeller rotates in counter clockwise direction, while the collected water with clockwise rotation is three times of that obtained in other layout.
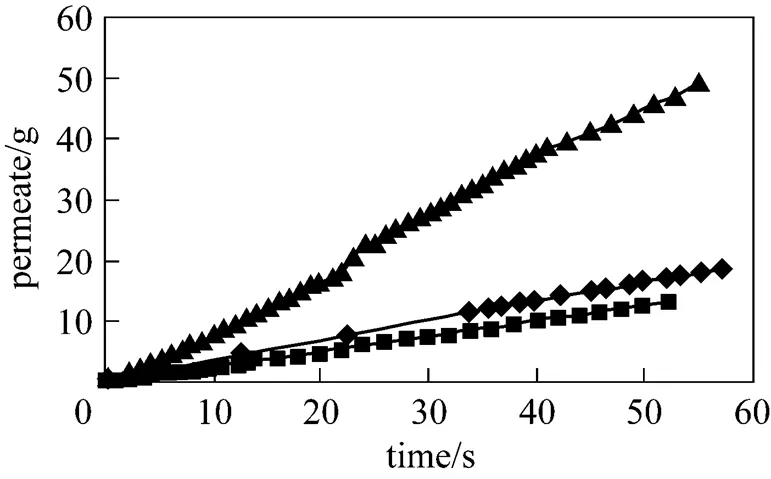

▲ clockwise motion;◆ counter clockwise motion;■ no motion
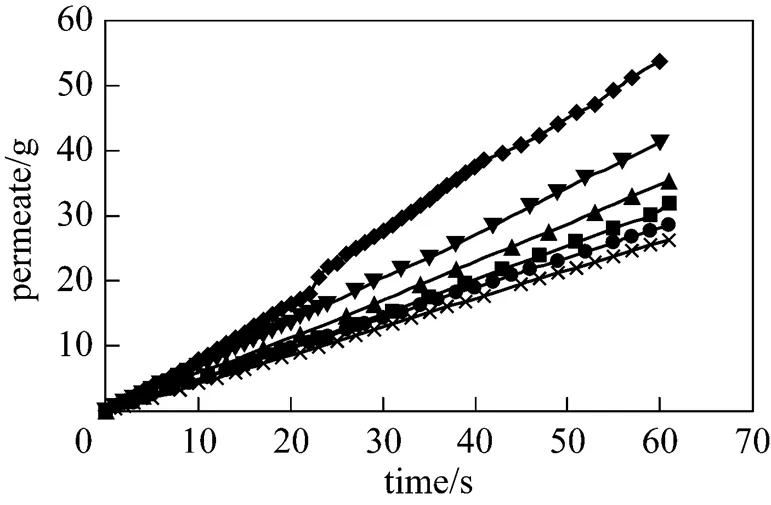
Figure 5 The permeate at various time and different Reynolds numbers
:◆ 5830;▼ 5410;▲ 5000;■ 4580;● 2910; × 2290
In the second step, the experiments were performed at several angular velocities, 55, 70, 110, 120 and 130 r·min-1, in order to investigate the effect of rotation speed on the flux through the membrane. The mass of permeate collected was measured at different time up to 60 s. In order to have more understandable data, the results are compared based on the Reynolds number in an agitated tank, defined as [24]
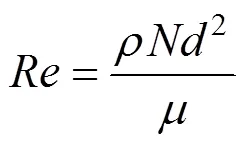
whereis impeller diameter,is rotational speed (r·s-1),andare density and dynamic viscosity of working fluid respectively. The Reynolds numbers related to the angular velocities from 55 to 140 r·min-1are from 2290 to 5830, so that the flow in the cell is turbulent [24].
Figure 5 represents the permeate mass at various time for different Reynolds numbers with clockwise rotation of impeller. The mass of permeate collected increases almost linearly for all cases, indicating at each Reynolds number, the permeate flux rate is constant. The figure also shows that as the rotation speed of impeller increases, the slope of the curve increases. In addition, the difference between the permeate fluxes at higher Reynolds numbers is more considerable. It should be noted that when the Reynolds number increases from 5410 to 5830 (less than 8% increase), the permeate flux increases by more than 25%.
The variation of mass flux at various Reynolds numbers is shown in Fig. 6. As the Reynolds number increases, the permeate flux increases. This increase is more significant for higher Reynolds numbers.
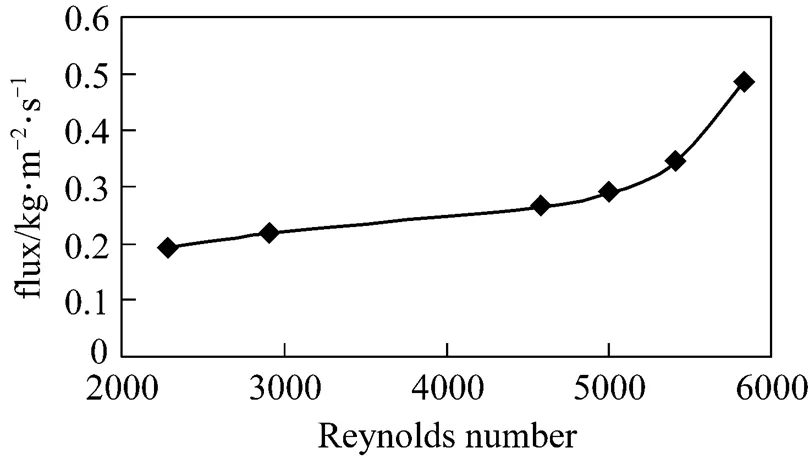
Figure 6 The permeate flux at various Reynolds numbers
4 CFD modeling
The commercial CFD package, FLUENTTMversion 6.2, a finite volume Navier-Stokes solver, was used to model the cell containing an impeller in three dimensions. The fluid region was discretized into a finite set of control volumes, using the mesh generator GAMBITTMof FLUENT. The code is able to employ the MFR model for the impeller modeling.
Based on the definition of Reynolds number, the fluid flow regime in the cell is turbulent. The standard-turbulence model is not appropriate for the strong turbulent flow with unisotropic flow behavior. Therefore, the renormalization group (RNG)-model of Yakhot and Orszag [22] was employed in this study. Using RNG methodology for the governing equations, the RNG-formulated-model will be produced, in which the model constants are reevaluated. The difference between the RNG and the standard-turbulence models appears in the epsilon equation while the kinetic energy equations are identical.
The whole volume was divided into 686124 unstructured tetrahedral meshes. This number of control volume was found by examining different grid numbers between 234320 to 1085234. As no significant difference was found between the predicted results using more than 686124 cells, this number of control volume was used in the modeling to save computer CPU time. The regions close to the impeller were meshed into smaller control volumes in order to increase the precision of predictions. In addition, the region close to the membrane surface was meshed to fine structured hexagonal cells with a size ratio of 0.2 relative to mesh size of the rest of domain. Fig. 7 shows the meshed cell walls, membrane surface and the impeller.

Figure 7 The meshed cell and impeller
4.1 Boundary conditions
The atmospheric pressure was set as the inlet pressure boundary condition for the top of the cell. The modeling was carried out for different angular velocities of the impeller including 140 (for both clockwise and counter clockwise directions), 130, 120, 110, 70 and 55 r·min-1(for clockwise direction only). The membrane surface was assumed as no slip wall condition.
4.2 Solution procedure
The SIMPLE pressure-velocity algorithm, the standard pressure, the second order upwind discretization scheme for momentum, turbulent kinetic energy and dissipation energy were employed in the modeling. The applied convergence criterion was selected to be 10-7.
Volume of Fluid (VOF) model was used to model the fluid free surface inside the cell. In this method, the interface between two phases, water and air, remains fixed [25]. The numerical stability can be obtained easily in this model because the flow field calculations are not coupled with the identification of the free surface location. However, the viscous stresses and surface tension cannot be simulated accurately because the interface within each cell is not located precisely. This limitation is largely overcome by using very fine meshes close to the surface.
5 Results and Discussion
In the present research, the role of fluid flow hydrodynamics on the permeate flux, which has a direct effect on the dynamic pressure distribution, was analyzed by the CFD. The dynamic and static pressures are related to the downward velocity (2/2) of the liquid toward a surface and the head of the liquid above the surface (), respectively. The difference in the permeate flux from the microfiltration membrane is explained by the predicted fluid hydrodynamics upon the membrane surface. As a first step, the flow fields in the vertical slice through the middle of the impeller shaft are shown in Fig. 8, which reveals significant differences between the flows generated by the marine impeller in clockwise and counter clockwise rotation. When the impeller rotates in clockwise direction (a), the impeller pushes the water toward the bottom of the cell and after the fluid hits the membrane surface, it moves upward along the cell wall. In this layout the water is pushed on the membrane surface, increasing the dynamic pressure in downward direction upon the membrane surface. When the marine impeller rotates in the counter clockwise direction (b), the flow pattern consists of a loop in each side of the impeller. Thus the impeller pushes the fluid downward along the cell wall and after it hits the bottom most of the fluid goes up and returns to the impeller. This flow pattern does not have a significant positive effect on pushing the water toward the membrane surface. Therefore, it can not be expected that this layout is effective for increasing the permeate.
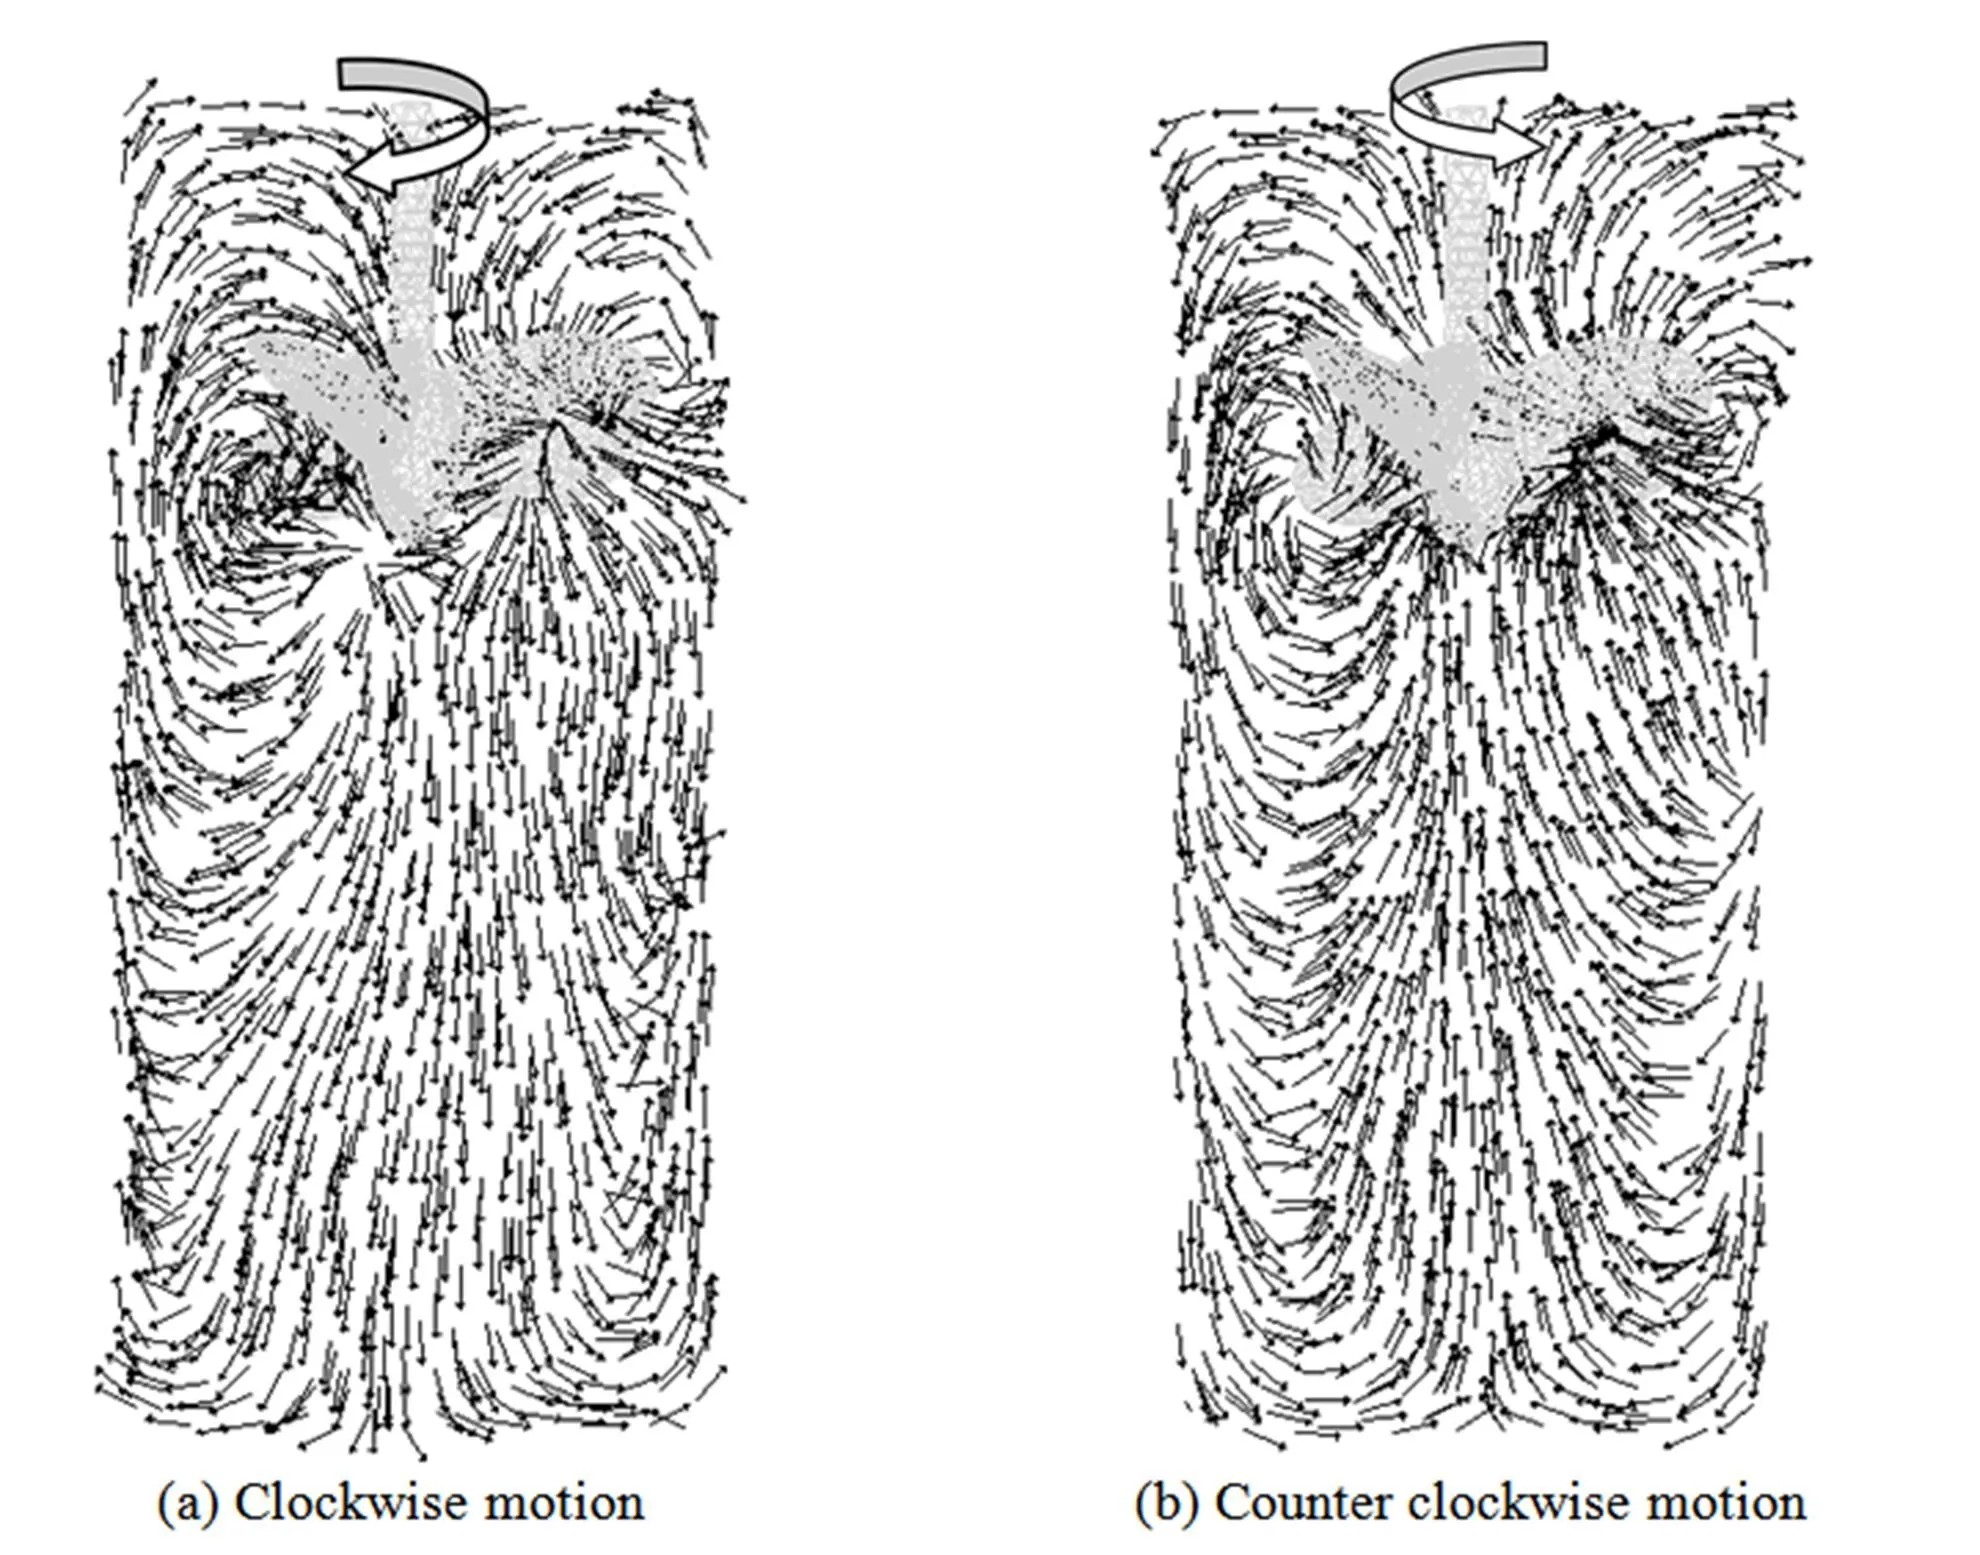
Figure 8 Fluid flow patterns in a vertical slice for two rotation directions
Figure 9 A comparison between the predicted downward axial velocities for two rotation directions
Figure 9 shows a 3D view of the region with the axial downward velocity in the range of 0 to 0.13 m·s-1. In the clockwise setup, the downward flow starts from the impeller and goes toward the membrane surface at the bottom of the cell. For the counter clockwise motion of the impeller, the fluid moves downward only in a small region around the impeller. Therefore, in the clockwise setup, the downward stream causes a higher dynamic pressure upon the membrane surface. This is the main reason why more water passes through the membrane in clockwise layout.
In the second step, the effect of rotation speed on the fluid flow with clockwise impeller rotation is discussed. Fig. 10 shows the average values of predicted dynamic pressure at different downward distances from the impeller at various values of Reynolds number. The pressure increases slightly with increasing distance between the impeller and the cell bottom. In addition, as the Reynolds number increases, the difference between the predicted pressures is larger, especially as the Reynolds number increases from 5410 to 5830 r·min-1. This pressure increases from about 96 to 125 Pa, which means that an 8% increase in the rotation speed causes about 23% increase of this pressure. The trend of pressure change is similar to the curve in Fig. 5 from the experiments, which shows that more permeate is collected at higher Reynolds numbers.
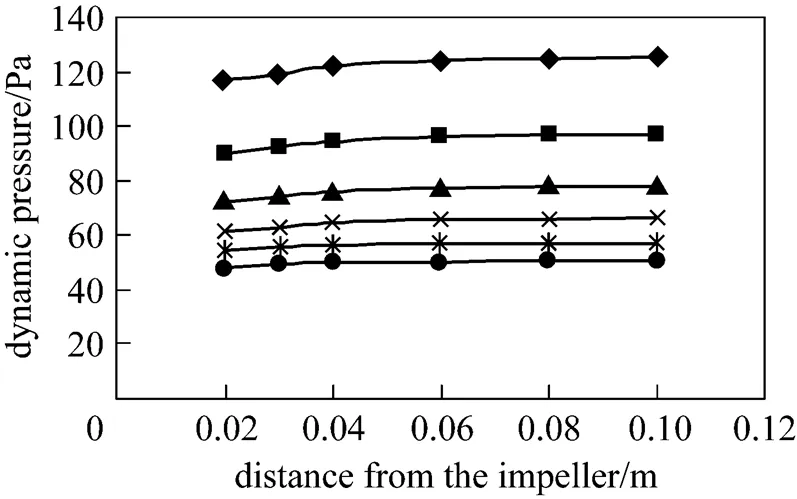
Figure 10 Dynamic pressures on the horizontal slices at different distances from the impeller with clockwise rotation

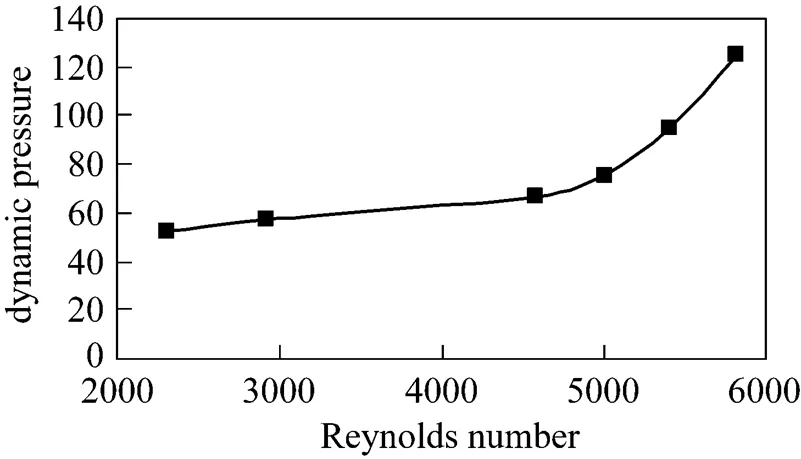
Figure 11 Dynamic pressure on the horizontal close to the membrane at various Reynolds numbers for clockwise motion
Figure 11 illustrates the average dynamic pressure on the horizontal plane close to the membrane at different Reynolds numbers. As the Reynolds number increases, the predicted dynamic pressure on a plane close to the membrane surface increases. The larger slope of the curve at higher Reynolds numbers indicates that at higher speeds the effect of rotation speed and consequently the effect of Reynolds number are highly considerable. A similar trend is observed in the experimental results of Fig. 6.
6 Conclusions
In the present work, an experimental set up was designed to illustrate the importance of the fluid flow pattern and established dynamic pressure on membrane flux. The experimental results show that two different flow patterns produced by an impeller, rotating in the clockwise and counter clockwise directions, cause a significant difference on the permeate flux. The permeate fluxes with the clockwise rotation in some cases are more than three times of those with the counter clockwise rotation. In order to illustrate the effect of dynamic pressure on the permeate flux, some experiments were performed at several rotation speeds (different Reynolds numbers) in the cell. It was observed that as the rotation speed increases the permeate flux increases.
Prediction of dynamic pressure distribution inside the cell is the main contribution of computational fluid dynamics (CFD) modeling in this study. It is tried to show the importance of dynamic pressure beside the static pressure in microfiltration membrane separation. By analyzing the experimental and CFD predicted results it is found that higher dynamic pressure results in more membrane permeate fluxes. In the other words, the results reveal a direct relation between the flux and dynamic pressure. Thus a designer should pay more attention to dynamic pressure as a part of total pressure across a microfiltration membrane.
AcknowledgEmentS
The authors wish to express their thanks to Mr.Rouzbahani and Miss. Sepehri for their help in theexperimental work.
Nomenclature
area, m2
1,2,Cconstants of the-model
Elinear deformation rate, s-1
dissipation function, Pa·s-1
flux, L·m-2·h-1
pressure, N·m-2
resistance, m-1
time, s
source term
velocity vector, m·s-1
,,,u,umean velocity components, m·s-1

x,xCartesian coordinate, m
volume fraction of gas phase in the cell
turbulence dissipation of, m2·s-3
,T,efflaminar, turbulent and effective viscosities, Pa×s
T,effturbulent and effective kinematic viscosity
density, kg·m-3
σ,σturbulent Prandtl numbers for-
Subscripts
,component
1 Wang, S., Yu, Y., Gao, G., “Non-equilibrium molecular dynamics simulation on pure gas permeability through carbon membranes”,...., 14 (2), 164-170 (2006).
2 Lei, Z., Wu, Y., Lu, S., Yang, B., “Mass transfer modeling in pervaporation based on multi-fields synergy theory”,....,16 (1), 79-83 (2008).
3 Zhong, Z., Chen, J., Zhuang, P., “Enhancement of proton exchange membrane fuel cell performance using a novel tapered gas channel”,...., 17 (2), 286-297 (2009).
4 Belfort, G., “Fluid mechanics in membrane filtration: Recent developments”,..., 40 (2), 123-147 (1989).
5 Fimbres-Weihs, G.A., Wiley, D.E., “Review of 3D CFD modeling of flow and mass transfer in narrow spacer-filled channels in membrane modules”,..., 49 (7), 759-781 (2010).
6 Liu, Y., He, G., Liu, X., Xiao, G., Li. B., “CFD simulations of turbulent flow in baffle-filled membrane tubes”,..., 67 (1), 14-20 (2009).
7 Agashichev, S.P., “Modeling concentration polarization phenomena for membrane channel with cylindrical geometry in an ultra filtration process”,, 119 (1-3), 159-168 (1998).
8 Wiley, D.E., Fletcher, D.F., “Computational fluid dynamics modeling of flow and permeation for pressure-driven membrane processes”,, 145 (1-3), 183-186 (2002).
9 Wiley, D.E., Fletcher, D.F., “Techniques for computational fluid dynamics modeling of flow in membrane channels”,..., 211 (1), 127-137 (2003).
10 Damak, K., Ayadi, A., Zeghmati, B., Schmitz, P., “A new Navier–Stokes and Darcy’s law combined model for fluid flow in cross flow filtration tubular membranes”,, 161 (1), 67-77 (2004).
11 Ahmad, A.L., Lau, K.K., Bakar, M.Z.A., Shukor, S.R.A., “Integrated CFD simulation of concentration polarization in narrow membrane channel”,..., 29 (10), 2087-2095 (2005).
12 Rahimi, M., Madaeni, S.S., Abbasi, K., “CFD modeling of permeate flux in cross flow microfiltration membrane”,..., 225 (1-2), 23-31 (2005).
13 Ghidossi, R., Veyret, D., Moulin, P., “Computational fluid dynamics applied to membranes: State of the art and opportunities”,..., 45 (6), 437-454 (2006).
14 Ranade, V.V., Kumar, A., “Comparison of flow structures in spacer- filled flat and annular channels”,, 191 (1-3), 236-244 (2006).
15 Torras, C., Pallarès, J., Valls, R.G., Jaffrin, M.Y., “CFD simulation of a rotating disk flat membrane module”,, 200 (1-3), 453-455 (2006).
16 Alexiadis, A., Wiley, D.E., Vishnoi, A., Lee, R.H.K., Fletcher, D.F., Bao, J., “CFD modeling of reverse osmosis membrane flow and validation with experimental results”,, 217 (1-3), 242-250 (2007).
17 Pak, A., Mohammadi, T., Hosseinalipour, S.M., Allahdini, V., “CFD modeling of porous membranes”,, 222 (1-3), 482-488 (2008).
18 Luo, J.Y., Gosman, A.D., “Prediction of impeller-induced flows in mixing vessels using multiple frame of reference”,...., 136, 549-556 (1994).
19 Brucato, A., Ciafalo, M., Grisafi, F., Micale, G., “Numerical prediction of flow fields in baffled stirred vessels: A comparison of alternative modeling approaches”,..., 53 (21), 3653-3684 (1998).
20 Harris, C.K., Roberts, D., Rosendal, F.J.J., “Computational fluid dynamics for chemical reactor engineering”,..., 51 (10), 1569-1594 (1996).
21 Launder, B.E., Spalding, D.B, “The numerical computation of turbulent flows, computer methods in applied mechanics and engineering”,...., 3 (2), 269-289 (1974).
22 Yakhot, V., Orszag, S.A., “Renormalization group analysis of turbulence (I) Basic theory”,..., 1, 1-51 (1986).
23 Versteeg, H.K., Malalasekera, W., An Introduction to Computational Fluid Dynamics, Longman Limited, England (1995).
24 Iranshahi, A., Devals, C., Heniche, M., fradette, L., Tanguy, P.A.,Takenaka, K., “Hydrodynamics characterization of the Maxblend impeller”,..., 62 (14), 3641-3653 (2007).
25 Hirt, C.W., Nichols, B.D., “Volume of fluid (VOF) method for the dynamics of free surface boundaries”,..., 39, 201-225 (1981).
* To whom correspondence should be addressed. E-mail: masoudrahimi@yahoo.com
2009-08-12,
2010-11-07.
杂志排行

Chinese Journal of Chemical Engineering的其它文章
- Effect of Boundary Layers on Polycrystalline Silicon Chemical Vapor Deposition in a Trichlorosilane and Hydrogen System*
- Separation of Eu3+ Using a Novel Dispersion Combined LiquidMembrane with P507 in Kerosene as the Carrier*
- Fabrication of SPES/Nano-TiO2 Composite Ultrafiltration Membrane and Its Anti-fouling Mechanism*
- Adsorption and Ozonation Kinetic Model for PhenolicWastewater Treatment*
- Properties of Bio-oil from Fast Pyrolysis of Rice Husk*
- Induction of Recombinant Uridine Phosphorylase and Its Application in Biosynthesis of Pyrimidine Nucleosides*