一种毛霉表面成熟干酪的蛋白质水解作用评价
2010-03-21赵新淮
张 娜,赵新淮*
(1.东北农业大学 乳品科学教育部重点实验室,黑龙江 哈尔滨 150030;2.哈尔滨商业大学食品工程学院,黑龙江 哈尔滨 150076)
一种毛霉表面成熟干酪的蛋白质水解作用评价
张 娜1,2,赵新淮1,*
(1.东北农业大学 乳品科学教育部重点实验室,黑龙江 哈尔滨 150030;2.哈尔滨商业大学食品工程学院,黑龙江 哈尔滨 150076)
从毛豆腐中分离出一株毛霉,并应用于表面成熟干酪,以研究干酪成熟过程中所发生的蛋白质水解作用。在90d的成熟过程中,干酪的pH值增加;蛋白质水解作用的评价指标,如干酪外层的水溶性氮-总氮比、pH4.6水溶性氮-总氮比、12g/100mL三氯乙酸可溶性氮-总氮比,在成熟90d后分别增加至(23.68±1.07)%、(19.38± 1.32)%和(8.61±0.85)%,并且高于干酪的内部相应指标。SDS-PAGE和毛细管电泳分析干酪的pH4.6不溶性组分,结果表明酪蛋白在干酪成熟过程中被降解。对干酪成熟过程中分离出的水溶性组分进行RP-HPLC分析,结果显示成熟过程中蛋白质被水解以及形成一些新肽分子。
毛霉;干酪;蛋白质水解;电泳;RP-HPLC
Proteolysis is the most complex and important biochemical event that begins with the hydrolysis of the caseins which formed the cheese matrix (αs1-, αs2-, β- and para-κ-casein) by proteinases during ripening[1], and plays a vital role on cheese flavor and texture development in most cheese varieties[2]. During cheese ripening, casein is hydrolyzed to large peptides mainly by the coagulant and some indigenous milk enzymes e.g. plasmin and cathepsin D. Large peptides are hydrolyzed to small peptides and amino acids by microbial proteinases. Proteolysis has been widely used as a basis for classification of cheese, which can vary substantially according to cheese variety. Therefore, each type of cheese has its own characteristics pattern of proteolysis[3].
Mould-ripened cheese has important status in cheese industry. Moulds are intentionally added to some food products in order to induce the formation of soft texture and specific flavours. Mould-ripened cheese involve surface mould-ripened cheese such as Brie[4], Camermbert[5],Neufchatel[4], Gamalost[6], and interior mould-ripened cheese such as Stilton[7], Roquefort[8], Gorgonzola cheese[9], Tulum cheese[10], Kuflu cheese[11].
Many researches about proteolysis of mould-ripened cheese were reported. Several studies on Blue cheeses such as Gorgonzola, Stilton, Roquefort, Picon Bejes-Tresviso, Danablu have been conducted and their typical properties including technology, gross composition, proteolysis, lipolysis, microflora and volatile profiles had been characterized[4]. Fernandez-Salguero[4]had found that the gradual hydrolysis of proteins leads to the formation of soluble low molecular weight compounds in mould-ripened cheeses. Cinbas et al[12]had reported a similar change occurred in white cheese manufactured by traditional productive method. Bars et al[13]and Hewedi et al[14]had identified six peptides separated fromβ-casein in Camembert cheese during ripening, which indicated that there might be carboxypeptidase in P. camemberti. Oterholm et al[15-16]smeared Mucor mucedo to the surface of Gamalost cheese, and studied the characteristics of proteolysis. Fontecha et al[17]had studied the biochemistry of Cabrales cheese during ripening. Messens et al[18] had reported that the mould-ripened cheese after high pressure treatment had different textures, lipid contents and hydrolytic patterns. Law et al[19]had investigated the effects of pH and salt concentration on velocity of proteolysis in P. camemberti cheese, and found that proteolysis was suppressed at high pH and high salt concentration. O Sullivan et al[20]found that the contents of soluble nitrogen and amino acid in P. camembert cheese during ripening were various with different rennet (animal or vegetable). Gripon[21] had found that a very extensive proteolysis occurred in bluemould cheeses and bothαs1- andβ-caseins were hydrolyzed completely. Dellano et al[22]had identified PTA-soluble peptides in blue cheese by HPLC. Addeo et al[23]had isolated and identified low molecular mass peptides formed during the ripening of Parmagiano-Reggiano cheese by using fast atom bombardmesnt-mass spectrometry. Numerous nonspecific and specific techniques have been employed to study proteolysis occurred during cheese ripening. For example, electrophoresis and chromatography in combination with multivariate statistical analysis have emerged as a powerful tool to improve the understanding of proteolysis occurred in cheese[24].
Mao-tofu, a popular mould-fermented soybean food covered by white fungous mycelia, is produced in central China. Traditionally, mao-tofu is farmhouse-prepared by mould fermentation, primarily Mucor spp., which has helpful impacts on the quality of the final product. The production of mao-tofu is similar to the production of cheese but with less fermentation time; therefore the Mucor used in mao-tofu preparation might be a potential starter in cheese making. We had separated a strain of Mucor spp. from local mao-tofu product in the past, and studied its application in cheese ripening. We had smeared this strain in the surface of fresh cheese and kept cheese at ripening room for 90 d. The impacts of Mucor on cheese ripening and some information about the proteolysis occurred in cheese ripening were evaluated. Some chemical analysis, such as determination of the levels of nitrogen fractions in three mediums (water, buffer of pH 4.6 and 12 g/100 mL TCA), together with sodium dodecyl sulphate-polyacrylamide gel electrophoresis (SDS-PAGE), capillary electrophoresis (CE) and reverse phase high performance liquid chromatography (RP-HPLC), were employed to present that how the proteolysis was progressed during cheese ripening.
1 Materials and Methods
1.1 Materials and reagent
Raw milk was purchased from local dairy farm.
Chymosin (1∶10000 strength, Maxiren-180, DSM Food Specialties, Holland) was conserved at -18 ℃; Casein was from Sigma Co. (St. Louis, MO, USA); The chemicals and reagents used in RP-HPLC and CE analysis were chromatogram grade, and all solutions were dissolved with highly purified water prepared by Milli-Q Plus; Other chemicals and reagents were analytical grade.
1.2 Strain and culture conditions
The Mucor spp. was cultured in slope medium (g/L)∶sodium nitrate 3, sucrose 30, potassium acid phosphate 1, magnesium sulfate 0.5, potassium chloride 0.5, ferrous sulfate 0.01, agar 20. The culture was maintained at (28±1) ℃for 48 h in an incubator and then kept at 4 ℃ for use.
1.3 Apparatus used
Milli-Q Plus (Millipore Corp, Bedford, MA, USA); pulp refiner (Baoli Scientific Research and Appliance Co., Jiangyin, China); pH meter (PH-3C, Mettler Toledo Delta 320, UN); HPLC-system (automated Waters Alliance 2695, USA); Capillary electrophoresis (Beckman P/ACETM system MDQ); uncoated fused-silica capillary column (eCape, Beckman Instruments Inc.); photoDoc-It Imaging System (UVP Inc., San Gabriel, USA).
1.4 Manufacture and ripening of cheese
Whole milk was pasteurized at 63 ℃ for 30 min in 20 L vat. After acidification of cheese to pH 5.5—5.7 with phosphoric acid, calcium chloride and potassium nitrate were added at a level of 0.016% and 0.014% respectively with the mass fraction. At 33 ℃, chymosin was added to vat in dose of 0.0034% (m/m). After setting 30 min, the curd was cut into 1 cm×1 cm×1 cm pieces. Whey was drained 3 times at 15 min interval after being reheated to 35 ℃. The curd was pressed (0.3 MPa for 2 h) in cylindrical mould of 15 cm diameter and 30 cm height at the base, then was removed and cut into cube (3 cm×1.5 cm×1.5 cm). The cheese samples were smeared the Mucor spp. on the surface after being salted in 5 g/ 100 mL refrigerated brine for 18 h, and cultured at (28±1) ℃ for 24 h. Later, all samples were transferred to ripening chamber with relative humidity of 85%—90% and temperature of (4±1) ℃ until to be analyzed.
1.5 Pretreatment of cheeses sample
The cheeses were sampled after 1, 7, 14, 21, 28, 35, 60, 90 d of ripening, and extracted the analysis samples from the central or the external zone of the cheese samples as described by Sihufe et al[25]. The central or the external zone was divided into four equal parts with a knife.
Water-soluble nitrogen (WSN) fraction of the cheese samples was prepared according to the method of Durrieu et al[26], and pH 4.6-soluble nitrogen (pH 4.6-SN) fraction of the cheese samples was prepared according to the method of Kuchroo et al[27]. 12 g/100 mL trichloroacetic acid-soluble nitrogen (12 g/100 mL TCA-SN) fraction was prepared according to the method of Polychroniadou et al[28].
1.6 Chemical analysis
1.6.1 Compositions of cheese
All chemical analysis was carried out triplicately. Moisture content was analyzed based on method of IDF[29]. Ash content was determined by the AOAC method[30]. Fat content was determined by the Soxhlet method using diethyl ether[31]. All were expressed by the weight of 100 g cheese sample (g/100 g). For pH determination, grated cheeses (about 3 g) were mixed with 10 mL distilled water and then homogenized using a pulp refiner for about 3 min. The pH of homogenate was measured using pH meter.
1.6.2 Analysis of nitrogen content
Total nitrogen (TN) content of cheese samples were determined by the Kjeldahl method as described by the FILIDF 20B∶ 1993 standard[32]and expressed as weight in 100 g cheese sample (g/100 g). Nitrogen content in WSN or pH 4.6-SN or 12 g/100 mL TCA-SN fraction was also determined by the Kjeldahl method, and expressed by the weight of 100 g cheese sample (g/100 g).
1.7 Electrophoresis analysis
1.7.1 Sodium dodecyl sulphate-polyacrylamide gel electrophoresis
2.0 g pH 4.6-insoluble (pH 4.6-ISN) fraction separated from pH 4.6-SN extraction was washed three times with 6 mL 1 mol/L sodium acetate buffer (pH 4.6). The remaining fat was eliminated by washing with 4 mL diethyl ether twice. The residue (about 0.2 g) was mixed well with 0.2 mL Trisbuffer (0.06 mol/L, pH 6.8) containing β-mercaptoethanol (5%, V/V), glycerin (25 g/100 mL), SDS (2 g/100 mL), bromophenol blue (0.1 g/100 mL). After being boiled and centrifuged at 10000×g for 10 min, supernatant was separated as analysis sample. A SDS-PAGE analysis method from Laemmli[33]was chosen for evaluation of protein degradation using gradient (12 g/100 mL) gel. The gel was 1.5 mm thick, consisted of 2 cm stacking gel and 10 cm running gel. 10 μL sample prepared was applied to sample slots. The electrophoresis was carried out for 4 h at 120 V. After the end of electrophoresis, the gel was separated. Protein bands were stained with 0.25% Coomassie Brilliant Blue R-250 in methanol-water-acetic acid (5∶5∶1, V/V), and then destained in the same solvent. Standard protein markers were used and their molecular weights (kD) were indicated as follows∶ egg albumin lysozyme, 14.4 kD; trypsin inhibitor, 20.1 kD; bovine carbonic anhydrase, 31.0 kD; rabbit actin, 43.0 kD; bovine serum albumin, 66.2 kD. The gel images were visualized and photographed by PhotoDoc-It Imaging System.
1.7.2 Capillary electrophoresis
The running buffer (50 mmol/L) was prepared by mixing 14.7 mol/L H3PO4, 6 mol/L urea solution and 0.05 g/100 mL, Hydroxypropyl methyl cellulose (HPMC). Then the pH was adjusted to 2.5 with 2 mol/L NaOH. Sample buffer (pH 8.0) consisted of 10 mmol/L H3PO4, 8 mol/L urea, 10 mmol/L dithiothreitol (DTT). Two buffers were filtered through 0.22 μm filter before analysis.
Standard casein and analysis samples of pH 4.6-ISN fractions prepared at 1, 7, 14, 21, 28, 35, 60, 90 d of ripening, were dissolved in sample buffer with final concentration about 10 mg/mL, then left for at least 1 h at room temperature before filtration (0.22 μm filter) and CE analysis. Separations were performed using an uncoated fused-silica capillary column of60 cm×50 μm (50 cm to the detector window). All experiments were carried out in the cationic mode (anode at the inlet and cathode at the outlet). The sample introduction was achieved by pressure injection for 5 s at 0.5 psi. The separations were conducted at 18.5 kV and separation temperature was kept constantly at 30 ℃. UV detection was performed at 214 nm (data collection rate 5 Hz). The capillary was washed with 0.1 mol/L NaOH (3 min), deionised water (5 min), 0.1 mol/L HCl (3 min) and equilibrated with the running buffer (5 min) before each injection. The image obtained and analyzed by 32-Karat software.
1.8 RP-HPLC analysis
WSN was analyzed with method described by Benfeldt et al[34]with some modifications in HPLC fitted with Hypersil C18column (4.6 mm×250 mm, 5 μm), 2996 photodiode array detector. Analysis samples were filtered through 0.45 μm filter. 10 μL samples were injected into the column maintained at 30 ℃ and were eluted at 0.75 mL/min with a linear gradient by using solvent A (0.1% (V/V) trifluoroacetic acid (TFA) in purified water) and solvent B (0.1% (V/V) TFA in acetonitrile).
1.9 Statistical analysis
All data were expressed as means±standard deviation (SD) from at least three independent experiments. One-way analysis of variance (ANOVA) was used to evaluate the significance levels of the analysis data obtained. Differences were considered statistically significant when P<0.05. The SPSS 15.0 version program and Microsoft Excel 2003 were used.
2 Results and Discussion
2.1 Composition changes of Mucor-ripened cheese during ripening
The contents of ash, fat and total protein of cheese after 90 d ripening were listed in Table 1. Compared to original contents in fresh cheese, all indices had increased slightly in ripening cheese. It was moisture loss that led to the composition change in ripening cheese, for moisture content during cheese ripening had a trend to decrease as shown in Fig.1 A. The pH of cheese in the external or central zone during ripening was shown in Fig.1 B. The pH changes in the external or central zone were fluctuated irregularly in early ripening (from 1 to 28 d), but then increased steadily (from 28 d to 90 d). The pH of cheese after 90 d ripening was increased to 6.82±0.24 in external or 6.68±0.29 in central, much higher than that of fresh cheese (P<0.05).
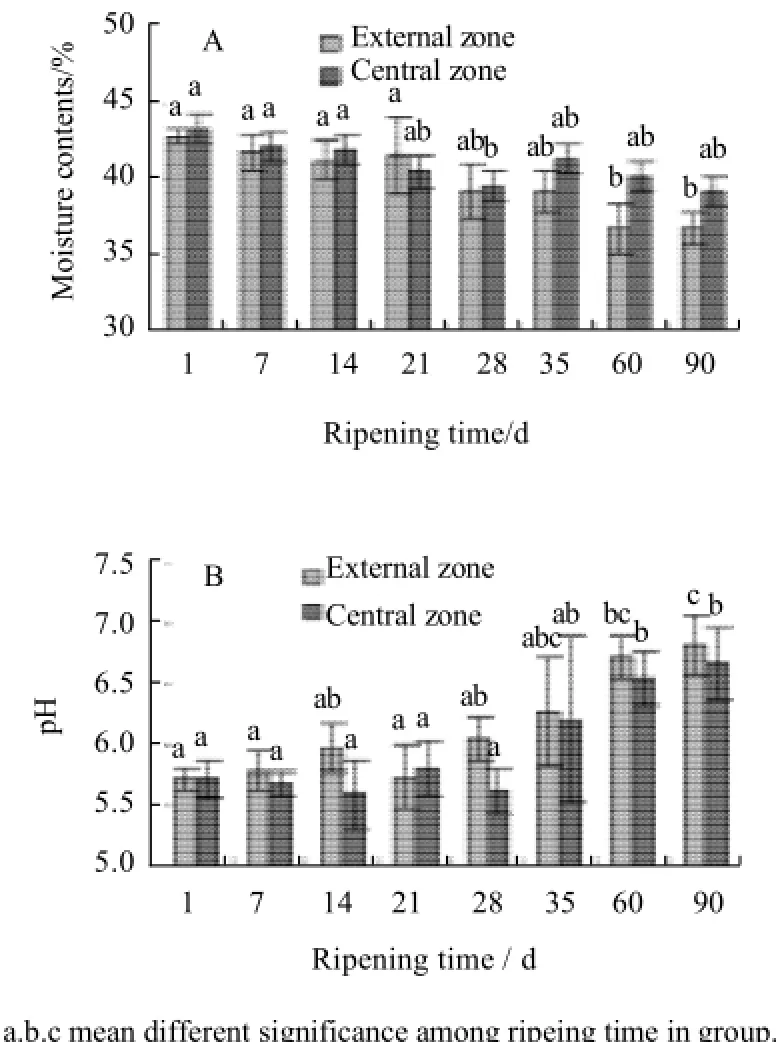
Fig.1 Moisture (A) and pH (B) of surface Mucor-ripened cheese at different ripening times
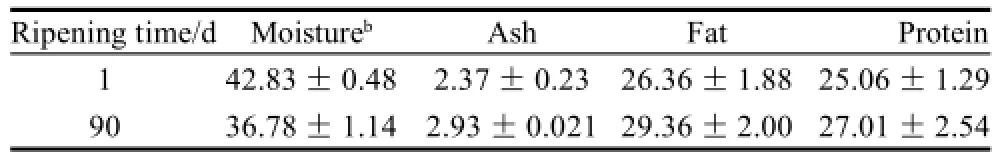
Table 1 Compositions of surface Mucor-ripened cheeses g/100 g
2.2 Changes of ratio of soluble nitrogen to total nitrogen during ripening
Accompanied by proteolysis occurred, SN fractions in cheese, such as WSN, pH 4.6-SN and 12 g/100 mL TCA-SN, were evaluated to indicate proteolysis extent. The changes of ratio of WSN, pH 4.6-SN and 12 g/100 mL trichloroacetic acid-soluble nitrogen to total nitrogen in cheese during 90 d ripening were shown in Fig.2.
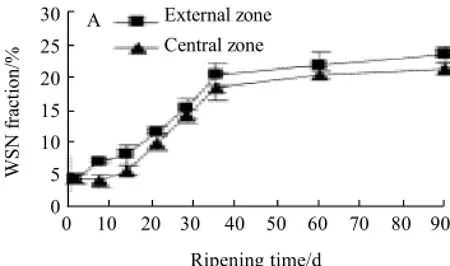
Fig.2 WSN fraction (A), pH 4.6-SN fraction (B) and 12 g/100 mL TCA-SN fraction (C) to total nitrogen for cheese at different ripening times
The changes of ratio of WSN to total nitrogen in cheese during 90 d ripening showed a clear increasing trend (Fig.2 A), both in the external and central zone, indicating proteolysis occurred. Analysis results indicated that the ratio of WSN to total nitrogen was increased from (4.54±0.93)% (external) or (4.55±0.73)% (central) to (23.68±1.07)% (external) or (21.45±0.93)% (central), about 5-fold variation. It also showed found that proteolysis in cheese occurred more rapidly when ripening was progressed during period of 1 d (external) or 7 d (central) to 35 d (external or central), and then was slow down.
Similar change profiles were also found in ratios of pH 4.6-SN to total nitrogen and 12 g/100 mL TCA-SN to total nitrogen in cheese during 90 d ripening (comparing Fig.2 B (central) and Fig.2 C with Fig.2 A). The ratio of pH 4.6-SN to total nitrogen in cheese during ripening was increased from (4.59±0.65)% (external) or (4.16±0.34)% (central) to (19.38±1.32)% (external) or (18.55±0.93)% (central), about 4-fold variation, and was more rapidly when ripening was progressed during period of 1 d (external) or 7 d (central) to 35 d (external or central), then the variation extent was decreased clearly. The ratio of 12 g/100 mL TCA-SN to total nitrogen was increased from (1.91±0.78)% (external) or (1.96±0.72)% (central) to (8.61±0.85)% (external) or (8.08± 0.54)% (central), about 4-fold variation, and was more rapidly when ripening was progressed during period of 1 d (external) or 7 d (central) to 35 d (external or central), then the variation extent was delayed slightly.
It was shown that the ratios of WSN, pH 4.6-SN and 12 g/100 mL TCA-SN to total nitrogen in the external zone during ripening were higher than that in the central zone.
2.3 Electrophoresis analysis
The variations of pH 4.6-ISN fraction in cheese during 90 d ripening were evaluated by SDS-PAGE and CE and the profiles were presented in Fig.3 and Fig.4, which could indicate the degradation of proteins.
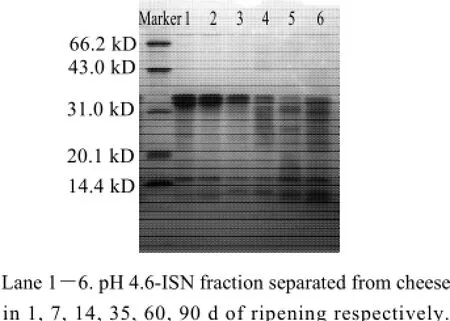
Fig.3 Electrophoresis profiles of SDS-PAGE of pH 4.6-ISN fraction separated from cheese at different ripening times
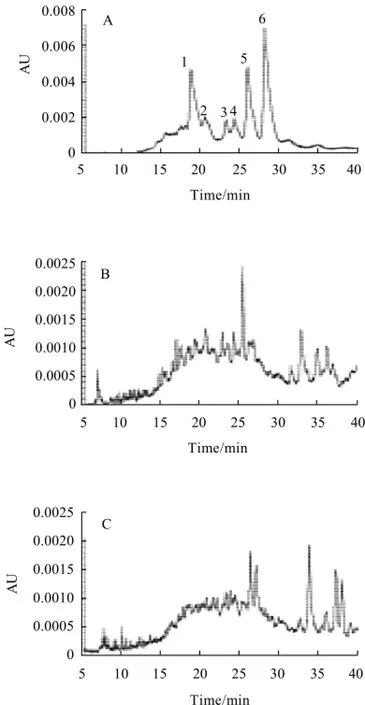
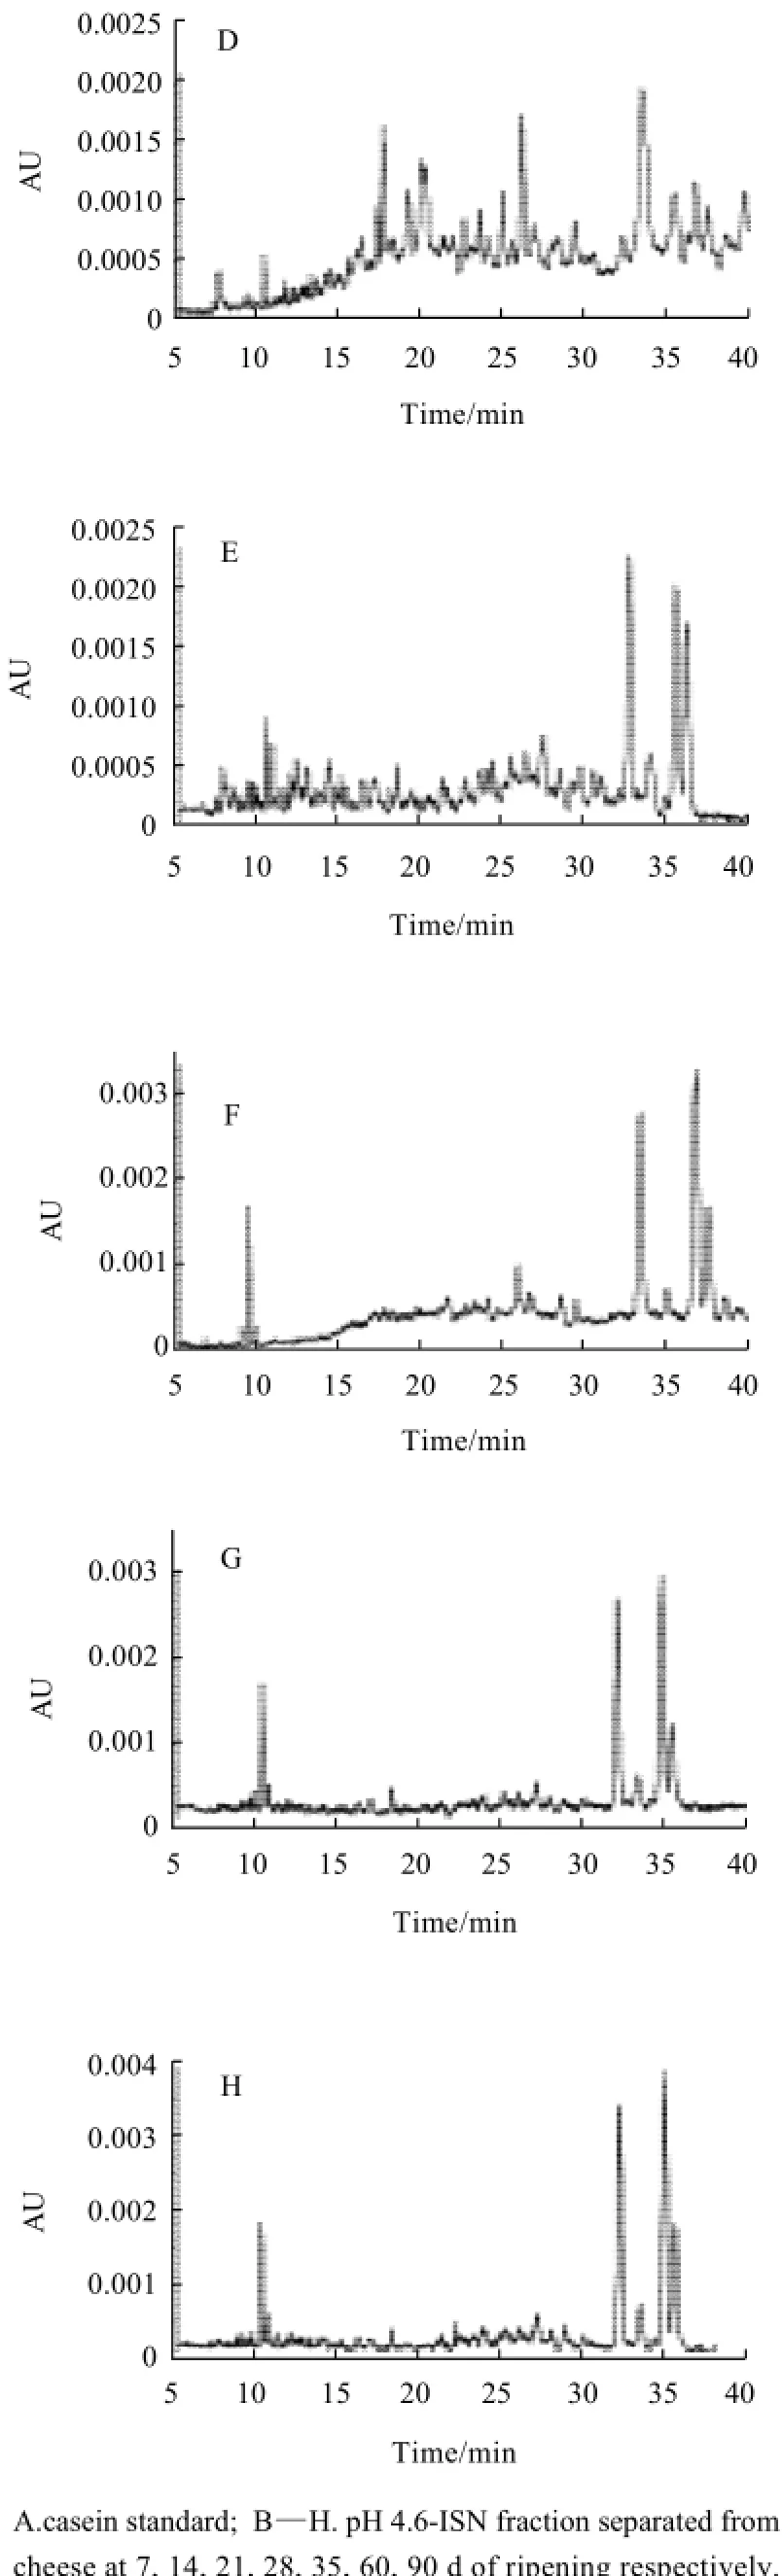
Fig.4 Capillary electrophoresis analysis of pH 4.6-ISN fraction separated from cheese at different ripening times
In SDS-PAGE profile, there were mainly two bands with higher molecular weight in fresh cheese, which wereβcasein and α-casein (Fig.3, lane 1). As ripening progressed, the color of these two bands were getting weaker and the color of other bands with small molecular weight appeared to be intensified (compare lane 1 with lane 2—6). It indicated that caseins in cheese were degraded to small peptides gradually. Distribution of protein bands showed that some peptides with molecular weight in range of 14.4 kD to 31.0 kD were formed in pH 4.6-ISN fraction during early ripening (lane 1, lane 2 and lane 3), then more peptides with the same molecular weight range were formed (lane 4, lane 5 and lane 6). When cheese was ripened for 60 d or 90 d, more peptides with molecular weight less than 14.4 kD were generated and most of casein was degraded.
The degradation of casein in cheese ripening was also could be demonstrated by CE profiles as Fig.4. Analysis results indicated that the migration time of standard casein was in the range of 15 min to 30 min and six peaks were existed (labeled as 1—6 in Fig.4 A). As ripening progressed, there were many new peaks appeared as results of casein degradation (Fig.4 B—H). For example, more peaks with a migration time in the range of 10 min to 30 min were existed and some peaks with a migration time longer than 32 min were produced. It was interesting us that as ripening progressed the peaks of casein were very low and there were only five key peaks left (Fig.4 F—H).
2.4 RP-HPLC analysis
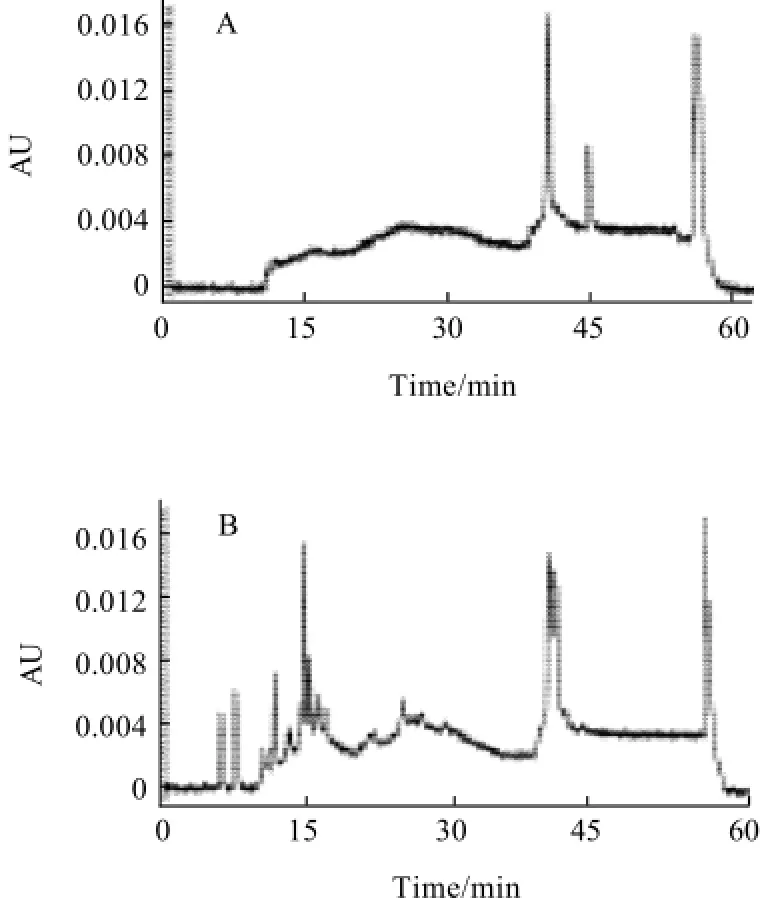
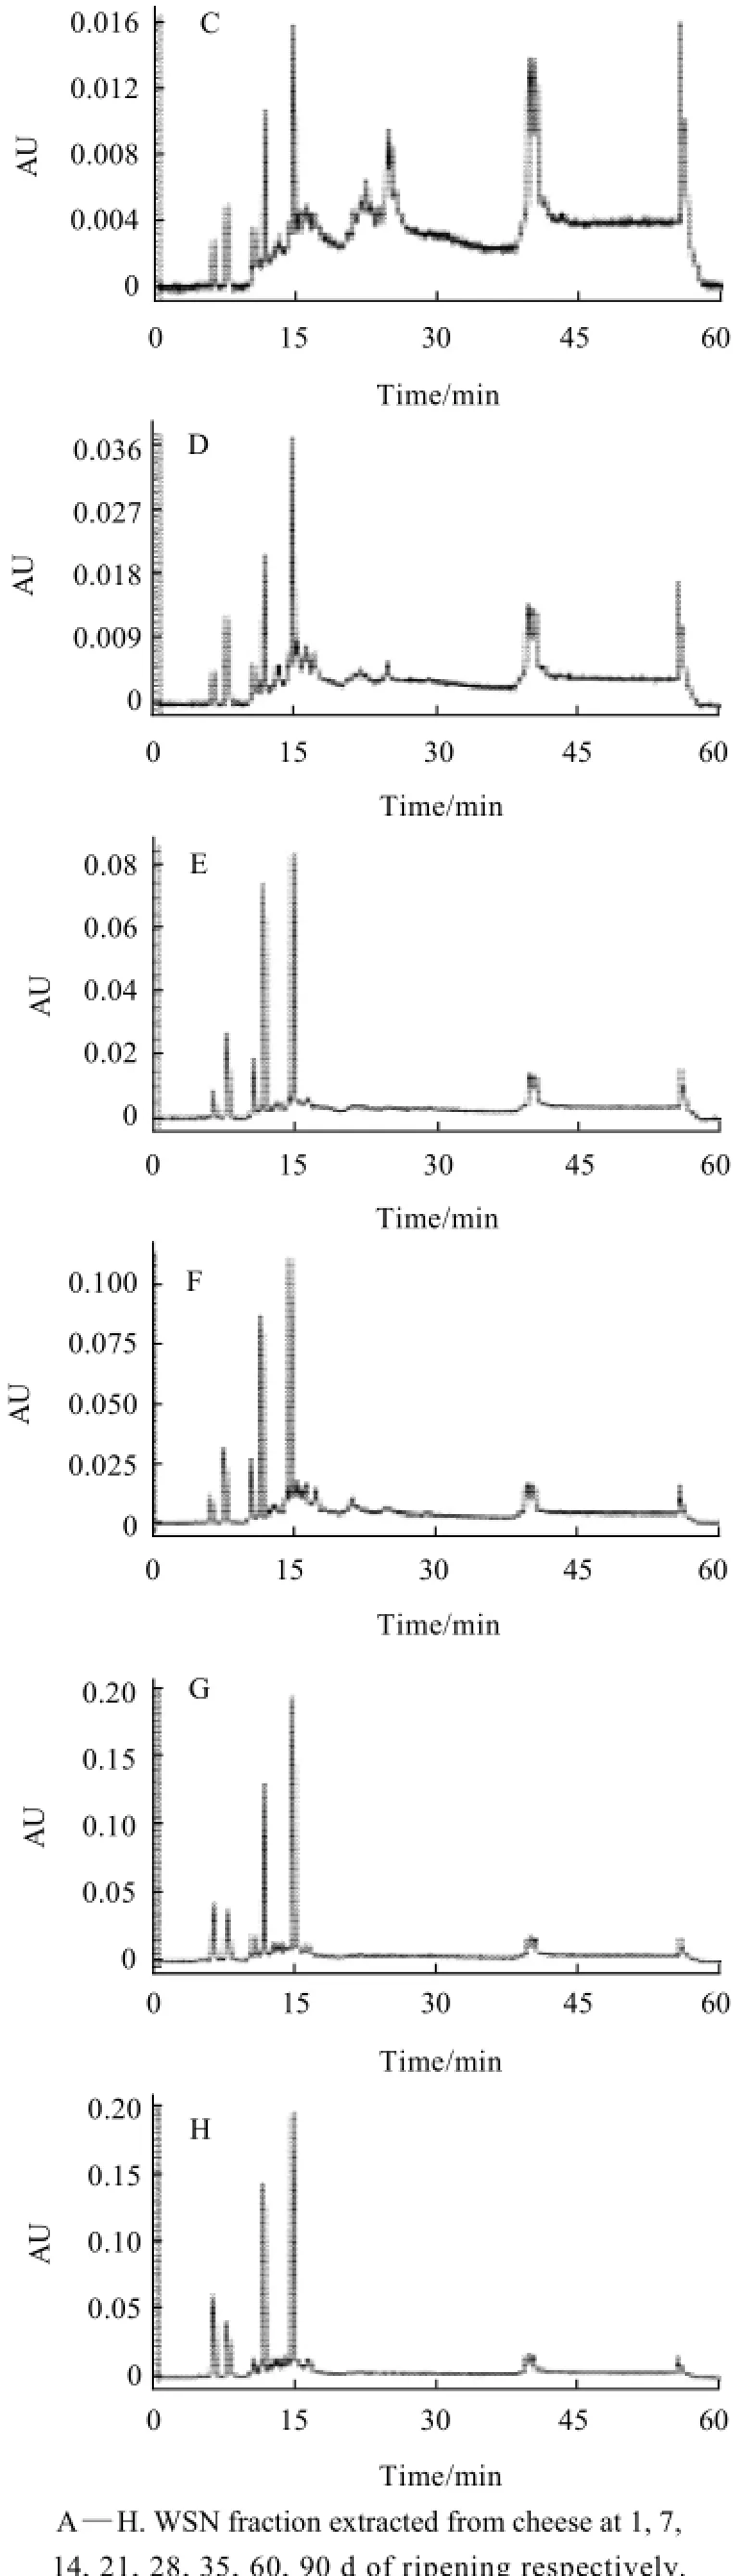
Fig.5 RP-HPLC profiles of WSN fraction extracted from cheese at different ripening times
The proteolysis of cheese occurred during ripening was also evaluated with RP-HPLC for WSN fraction in cheese at 1, 7, 14, 21, 28, 35, 60 d and 90 d of ripening and analysis results were presented in Fig.5. It could be seen that there were only three peaks in WSN fraction of cheese at 1 d of ripening (Fig.5 A). However, some new peaks (peptides) appeared in chromatograms as ripening progressed. When cheese was at 7 d or 14 d of ripening, some peaks with a retention time less than 30 min were produced (Fig.5 B, C). When cheese was at 21 d of ripening or more, the retention time of key peaks was in the range of 5 min to 15 min (Fig.5 D—H). The different peak distributions of WSN fraction of cheese at different ripening time also confirmed the proteolysis occurred in cheese.
3 Discussion
Proteolysis is an important reaction in cheese ripening[4]. Mucor spp. was seldom used in cheese ripening although corresponding study were reported for Mucor mucedo[15-16]. In study, to demonstrate the occurring of the proteolysis and indicate the proteolytic extent at different ripening times in cheese preparation, the different nitrogen fractions were extracted from cheese at different ripening times and analyzed with chemical, electrophoresis and chromatography method.
Chemical analysis results showed that the ratios of WSN, pH 4.6-SN and 12 g/100 mL TCA-SN to total nitrogen in cheese were all increased during ripening. As the degradation products of proteins were peptides with different sizes and amino acids and had improved solubility in usual media, such as water, buffer in pH 4.6 and TCA. Therefore proteolysis of casein in cheese would lead to the increase in soluble nitrogen fractions in cheese[2]. It was found that proteolysis might progress more rapidly at early ripening stage for the ratio of WSN, pH 4.6-SN and 12 g/100 mL TCA-SN to total nitrogen changed much during period of 1 d or 7 d to 35 d. Meanwhile, the proteolysis progressed more intensively in surface of cheese, because the ratio of WSN, pH 4.6-SN and 12 g/100 mL TCA-SN to total nitrogen in the external zone were all higher than that in the central zone without any exception, which was due to the growth of Mucor in surface of cheese and therefore more proteolysis would be occurred. After being ripened by Mucor for 90 d, the ratios of WSN, pH 4.6-SN and 12 g/100 mL TCA-SN to total nitrogen in cheese had a 4-fold or 5-fold increase. It was clearly different from that in cheese ripened for a short time (only 1 d), indicatingthat the degradation of caseins in cheese was happened.
Some researchers had studied the ripening of mould ripened cheese and analyzed the changes of ratios of WSN or pH 4.6-SN or 12 g/100 mL TAC-SN to total nitrogen during cheese ripening. Tomme de Savoie mould-ripened cheese had shown an increased ratio of SN to total nitrogen, with the ratio of WSN to TN reached to 23.5% and the ratio of 12 g/100 mL TCA-SN to TN reached to 5.3% in 57 d of ripening[26]. O Sullivan et al[20]reported that the ratio of pH 4.6-SN to total nitrogen in P. camemberti cheese produced with calf rennet or kid Grandine rennet was increased from 8.1% to 18.0% or 6.9% to 20% from 0 d to 50 d of ripening. Boutrou et al[35]found that the content of pH 4.6-SN were increased from 13 g/kg to 32 g/kg in Geotrichum camdidum soft cheese during 30 d of ripening. The proteolytic changes of Kuflu cheese, a Turkish mould-ripened variety, were studied by Hayaloglu et al[11]. The ratios of pH 4.6-SN and 12 g/100 mL TCA-SN to total nitrogen for 29 cheese samples were reached to 12.39%—28.44% and 10.30%—27.70% in 6 months of ripening. Milesi et al[36]also found the ratios of pH 4.6-SN and 12 g/100 mL TCA-SN to total nitrogen were increased 3-fold in Mini soft cheese during 60 d of ripening. All these results shared similarity to our study that the ratios of WSN, pH 4.6-SN and 12 g/100 mL TCA-SN to total nitrogen were employed to indicate the proteolysis in cheese during its ripening, and increased very much as proteolysis progressed.
Electrophoresis methods are widely used to characterize proteolysis in cheese[37]. The composition changes of pH 4.6-ISN fraction separated from Mucor-ripened cheeses in our study were analyzed by SDS-PAGE and CE. The analysis results obtained were support to the chemical analysis results. SDS-PAGE analysis showed that during cheese ripeningα-casein andβ-casein were decreased gradually and some peptides with molecular weight in a range of 14.4 kD to 31.0 kD were formed, indicating clearly proteolysis of proteins. These phenomena were supported by chemical analysis for ratios of WSN, pH 4.6-SN and 12 g/100 mL TCA-SN to total nitrogen, because all indexes were increased as prolonging ripening time. Similar phenomena were also found by other researches. Ong et al[38]studied the proteolysis of pH 4.6-ISN fraction of Cheddar cheese by SDS-PAGE, and found that after 12 weeks of ripening there were more protein bands with molecular weight in range of 7.4 kD to 30.2 kD. Vannini et al[39]studied the effect of high pressure homogenization on Pecorino cheese during 21 d of ripening with SDS-PAGE. Their results demonstrated that more peptides with molecular weight less than 6.3 kD were formed and most casein was degraded. Proteolysis occurred during cheese ripening was further supported by CE analysis of the pH 4.6-ISN fraction of cheese. It was found in CE analysis that the peak heights ofα- andβ-casein were decreased during 180 d of ripening in ovine milk cheese[40]. Trujillo et al[41] also studied pH 4.6-ISN fraction by CE for goat cheese during 45 d of ripening. CE analysis of the pH 4.6-ISN fraction of Mucor-ripened cheese in our study also indicated that casein was degraded and some new peptides were formed during cheese ripening, which were consistent with SDS-PAGE analysis.
Degradation products of caseins in cheese were peptides with different sizes and could be demonstrated by distribution profiles of water-soluble fraction analyzed by RPHPLC. From our RP-HPLC analysis, it was clearly indicated that a large number of small peptides with the retention time of 5 min to 30 min appeared in water-soluble fraction of cheese and increased as ripening time increased. This suggested that proteolysis occurred during cheese ripening. Some studies had reported similar results. Seneweera et al[42]reported that there were clearly increase of the peaks with retention time of 10 min to 34 min in RP-HPLC profiles of water-soluble fraction extracted from cheese ripened with microcapsule proteolytic enzymes. Michaelidou et al[43]found that there appeared some new peaks in water-soluble fraction of Kefalograviera cheese with retention time of 5 min to 40 min and the peak heights increased during 180 d of ripening. Verdini et al[44] studied the proteolysis of Port Salut Argentino cheeses during ripening. They found that the peak areas with retention time in range of 20 min to 28 min were increased 3-fold or 4-fold in the external zone of cheese during 57 d of ripening. RP-HPLC results in our study were confirmed by these results. The compositions and characteristics of these new peptides need to be identified or determined in future.
4 Conclusions
A surface Mucor-ripened cheese was prepared and the proteolysis occurred during 90 d of ripening was assessed by chemical, electrophoresis and HPLC methods for external or central zone of cheese. Proteolysis induceds by Mucor spp. was evidenced directly by the results from chemical analysis, with the facts that 4-fold or 5-fold increase of the ratios of water-soluble nitrogen fraction, pH 4.6-SN fraction and 12 g/100 mL TCA-SN fraction to total nitrogen were found. Proteolysis induced by Mucor spp. was also sup-
ported by the results from electrophoresis and RP-HPLC analysis. SDS-PAGE analysis for pH 4.6-ISN fraction separated from cheese samples showed that degradation of casein was occurred during ripening and some peptides with molecular weight less than 31.0 kD, especially 14.4 kD, were formed at the same time. CE analysis also confirmed the occurrence of proteolysis during cheese ripening. RP-HPLC analysis for WSN fraction extracted from cheese showed that some new peptides were produced during cheese ripening, especially when cheese was ripened for 21 d or more. All evaluation results declared that this strain of Mucor could induce proteolysis of cheese and have potential application in cheese making as a starter.
∶
[1]FOX P F, MESWEENEY P L H. Dairy chemistry and biochemistry [M]. London∶ Blackie academic and professional, 1998∶ 441.
[2]SOUSA M J, ARDO Y, MCSWEENEY P L H. Advances in the study of proteolysis during cheese ripening[J]. International Dairy Journal, 2001, 11(4/7)∶ 327-345.
[3]VERDINI R A, ZORRILLA S E, RUBIOLO A C. Characterisation of soft cheese proteolysis by RP-HPLC analysis of its nitrogenous fractions. Effect of ripening time and sampling zone[J]. International Dairy Journal, 2004, 14(5)∶ 445-454.
[4]FERNANDEZ-SALGUERO J. Internal mould-ripened cheese∶Characteristics, composition and proteolysis of the main European Blue vein varieties. Italian[J]. Journal of Food Science, 2004, 16(4)∶ 437-445. [5]GABORIT P, MENARD A, MORGAN F. Impact of ripening strains on the typical flavour of goat cheese[J]. International Dairy Journal, 2001, 11(4/7)∶ 315-325.
[6]SIENKIEWICZ-SZAPKA E, JARMO OWSKA B, KRAWCZUK S, et al. Contents of agonistic and antagonistic opioid peptides in different cheese varieties[J]. International Dairy Journal, 2009, 19(4)∶ 258-263.
[7]ERCOLINI D, HILL P J, DODD C E R. Bacterial community structure and location in Stilton cheese[J]. Applied and Environmental Microbiology, 2003, 69(6)∶ 3540-3548.
[8]CHALIER P, CROUZET J. Methyl ketone production from copra oil by Penicillium roqueforti spores[J]. Food Chemistry, 1998, 63(4)∶ 447-445.
[9]CARMINATI D, GATTI M, BONVINI B, et al. High-pressure processing of Gorgonzola cheese∶ Influence on Listeria monocytogenes inactivation and on sensory characteristics[J]. Journal of Food Protection, 2004, 67(8)∶ 1671-1675.
[10]CAKMAKCI S, DAGDEMIR E, HAYALOGLU A A, et al. Influence of ripening container on the lactic acid bacteria population in Tulum cheese World[J]. Journal of Microbiol Biotechnol, 2008, 24(3)∶ 293-299.
[11]HAYLOGLU A A, BRECHANY E Y, DEEGAN K C, et al. Characterization of chemistry, biochemistry and volatile profiles of Kuflu cheese, a mould-ripened variety[J]. Food Science and Technology, 2008, 41(7)∶1323-1334.
[12]CINBAS T, KILIC M. Proteolysis and lipolysis in White cheeses manufactured by two different production methods[J]. International Journal of Food Science and Technology, 2006, 41(5)∶ 530-537.
[13]LE BARS D, GRIPON J C. Role of Penicillium roqueforti proteinases during blue cheese ripening[J]. Journal of Dairy Research, 1981, 48(3)∶479-487.
[14]HEWEDI M M, FOX P F. Ripening of blue cheese∶ characterization of proteolysis[J]. Milchwissenschaft, 1984, 39(4)∶ 198-201.
[15]OTERHOLM A. Norske ostesorter i et historisk perspektiv-Gamelost [J]. Meieriposten, 2003a, 9∶ 200-211.
[16]OTERHOLM A. Norske ostesorter i et historisk perspektiv-Pultost[J]. Meieriposten, 2003b, 9∶ 264-274.
[17]FONTECHA J, PELAEZ C, JUAREZ M, et al. Biochemical and microbiological characteristics of artisanal hard goat s cheese[J]. Journal of Dairy Science, 1990, 73(5)∶ 1150-1157.
[18]MESSENS W, FOUBERT I, DEWETTINCK K, et al. Proteolysis of a high pressure-treated mould-ripened cheese[J]. Milchwissenschaft, 2001, 56∶ 201-204.
[19]LAW B A, WINGMORE A S. Accelerated cheese ripening with food grade proteinases[J]. Journal of Dairy Research, 1982, 49∶ 137-146.
[20]O SULLIVAN N, JSOUSA M, O GRADY-WALSH D, et al. Ripening of Camembert-type cheese made from caprine milk using calf rennet or kid rennet as coagulant[J]. International Journal of Dairy Technology, 2005, 58(1)∶ 13-20.
[21]GRIPON J C. Cheese∶ Chemistry, physics and microbiology[M]. 2nd ed. London∶ Chapman & Hall, 1993.
[22]DELLANO D G, POLO M C, RAMOS M. Production, isolation and identification of low-molecular mass peptides from blue cheese by high performance liquid chromatography[J]. Journal of Dairy Research, 1991, 58(3)∶ 363-372.
[23]ADDEO F, CHIANESE L, SALZANO A, et al. Characterization of the 12% trichloroacetic acid-insoluble oligopeptides of Parmigiano-Reggiano cheese[J]. Journal of Dairy Research, 1992, 59(3)∶ 401-411.
[24]PIRAINO P, UPADHYAY V K, RICCIO P R R, et al. Use of mass spectrometry to characterize proteolysis in cheese[J]. Food Chemistry, 2007, 101(3)∶ 964-972.
[25]SIHUFE G A, ZORRILLA S E, MERCANTI D J, et al. The influence of ripening temperature and sampling site on the lipolysis in Reggianito Argentino cheese[J]. Food Research International, 2007, 40(10)∶ 1220-1226.
[26]DURRIEU C, DEGRAEVE P, CHAPPAZ S, et al. Immunomodulating effects of water-soluble extracts of traditional French Alps cheeses on a human T-lymphocyte cell line[J]. International Dairy Journal, 2006, 16 (12)∶ 1505-1514.
[27]KUCHROO C N, FOX P F. Soluble nitrogen in Cheddar cheese∶Comparison of extraction procedures[J]. Milchwissenschaft, 1982, 37∶331-335.
[28]POLYCHRONIADOU A, MICHAELIDOU A, PASCHALOUDIS N. Effect of time, temperature and extraction method on the trichloroacetic acidsoluble nitrogen of cheese[J]. International Dairy Journal, 1999, 9 (8)∶ 559-568.
[29]IDF. Cheese and processed cheese-determination of total solids content. IDF Standard 4a. Brussels, Belgium[S]. 1982.
[30]Association of Official Analytical Chemists (AOAC). Official Methods of Analysis of AOAC International∶ 2nd Revision[M]. 17th Ed. HORWITZ D. Gaithersburg, Maryland, USA, 2002.
[31]GOBBETTI M, LANCIOTTI R, de ANGELIS M, et al. Study of the effects of temperature, pH and NaCl on the peptidase activities of nonstarter lactic acid bacteria (NSLAB) by quadratic response surface methodology[J]. International Dairy Journal, 1999, 9(12)∶ 865-875.
[32]IDF. Milk. Determination of the nitrogen (Kjeldahl method) and calculation of the crude protein content[S]. Brussels, Belgium∶ International Dairy Federation, 1993.
[33]LAEMMLI U K. Cleavage of structural protein during the assemply of the head of bacteriophage T4[J]. Nature, 1970, 227∶ 680-685.
[34]BENFELDT C, SORENSEN J. Heat treatment of cheese milk∶ effect on proteolysis during cheese ripening[J]. International Dairy Journal, 2001, 11(4/7)∶ 567-574.
[35]BOUTROU R, KERRIOU L, GASSI J Y. Contribution of Geotrichum candidum to the proteolysis of soft cheese[J]. International Dairy Journal, 2006, 16(7)∶ 775-783.
[36]MILESI M M, CANDIOTI M, HYNES E. Mini soft cheese as a simple model for biochemical studies on cheese-making and ripening[J]. Food Science and Technology, 2007, 40(8)∶ 1427-1433.
[37]PARK Y W. Proteolysis and lipolysis of goat milk cheese[J]. Journal of Dairy Science, 2001, 84(Suppl E)∶ 84-92.
[38]ONG L, HENRIKSSON A, SHAH N P. Proteolytic pattern and organic acid profiles of probiotic Cheddar cheese as influenced by probiotic strains of Lactobacillus acidophilus, Lb. paracasei, Lb. casei or Bifidobacterium sp.[J]. International Dairy Journal, 2007, 17(1)∶ 67-78.
[39]VANNINI L, PATRIGNANI F, IUCCI L, et al. Effect of a pre-treatment of milk with high pressure homogenization on yield as well as on microbiological, lipolytic and proteolytic patterns of Pecorino cheese [J]. International Journal of Food Microbiology, 2008, 128(2)∶ 329-335.
[40]IRIGOYEN A, IZCO J M, IBANEZ F C, et al. Evaluation of the effect of rennet type on casein proteolysis in an ovine milk cheese by means of capillary electrophoresis[J]. Journal of Chromatography, 2000, 881 (1/2)∶ 59-67.
[41]TRUJILLO A J, BUFFA M, CASALS I, et al. Proteolysis in goat cheese made from raw, pasteurized or pressure-treated milk[J]. Innovative Food Science and Emerging Technologies, 2002, 3(4)∶ 309-319.
[42]SENEWEERA S, ANJANI, K, PHILLIPS M, et al. Application of encapsulated proteolytic enzyme accelerates cheese ripening[J]. Australian Journal of Dairy Technology, 2006, 61(2)∶ 226.
[43]MICHAELIDOU A, KATSIARI M C, VOUTSINAS L P, et al. Effect of commercial adjunct cultures on proteolysis in low-fat Kefalogravieratype cheese[J]. International Dairy Journal, 2003, 13(9)∶ 743-753.
[44]VERDINI R A, ZORRILLA S E, RUBIOLO A C. Effects of the freezing process on proteolysis during the ripening of Port Salut Argentino cheeses [J]. International Dairy Journal, 2005, 15(4)∶ 363-370.
TS201.2
A
1002-6630(2010)15-0149-10
2009-04-02
张娜(1979—),女,博士研究生,研究方向为食品化学。E-mail:foodzhangna@163.com
*通信作者:赵新淮(1963—),男,教授,博士,研究方向为食品化学及乳品化学。E-mail:xinhuaizhao@21cn.com
